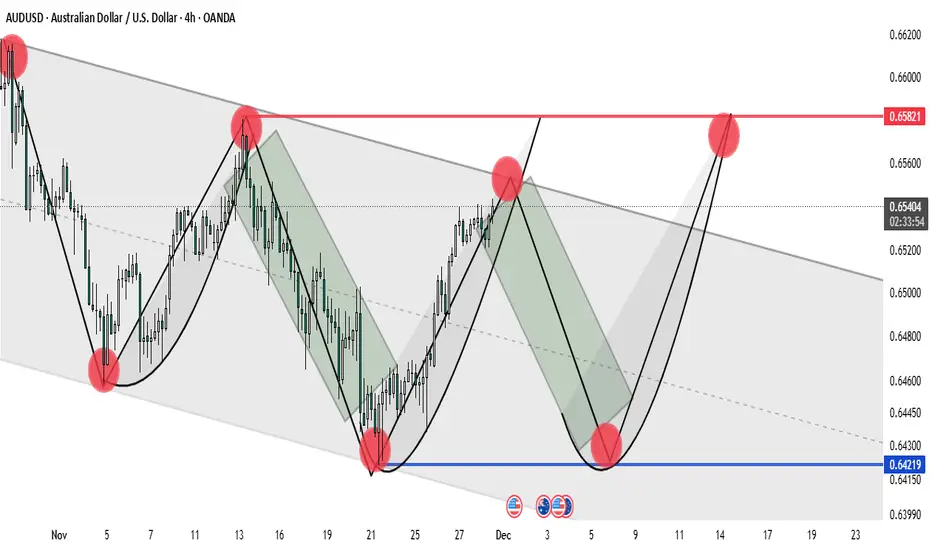
Lingrid | AUDUSD Channel Top Rejection ExpectedFX:AUDUSD has reached the upper boundary of its descending channel, aligning with the weekly-high zone near 0.6540, where price has repeatedly failed to break higher. It is showing early signs of exhaustion after a clean pullback into resistance, with candles losing momentum right at the confluence of the trendline and the upper channel edge — a zone that historically triggers sell-offs. The recent recovery leg appears corrective, keeping the broader bearish trend structure intact.
If sellers defend 0.6540, price is primed for a continuation lower toward 0.6484. The pattern remains bearish as long as price stays below trendline resistance and fails to establish new higher highs.
➡️ Primary scenario: rejection from 0.6540 → decline toward 0.6484.
⚠️ Risk scenario: a breakout above channel would shift momentum into a bullish corrective phase.
If this idea resonates with you or you have your own opinion, traders, hit the comments. I’m excited to read your thoughts!
Trade ideas

AUDUSD: Wait Until The Pullback Ends Before Selling!Welcome back to the Weekly Forex Forecast for the week of Dec. 1-5th.
In this video, we will analyze the following FX market: AUDUSD
AUDUSD had a surprisingly strong week. The weekly candle closed above the previous candle. This would indicate some follow through towards last week's high.
But... it is in a pullback on the HTFs, and could turn over mid to late week, towards the downside.
Wait for the market structure shift before entering new trades.
I'm sticking with the overall trend down until the market shifts the other way.
Enjoy!
May profits be upon you.
Leave any questions or comments in the comment section.
I appreciate any feedback from my viewers!
Like and/or subscribe if you want more accurate analysis.
Thank you so much!
Disclaimer:
I do not provide personal investment advice and I am not a qualified licensed investment advisor.
All information found here, including any ideas, opinions, views, predictions, forecasts, commentaries, suggestions, expressed or implied herein, are for informational, entertainment or educational purposes only and should not be construed as personal investment advice. While the information provided is believed to be accurate, it may include errors or inaccuracies.
I will not and cannot be held liable for any actions you take as a result of anything you read here.
Conduct your own due diligence, or consult a licensed financial advisor or broker before making any and all investment decisions. Any investments, trades, speculations, or decisions made on the basis of any information found on this channel, expressed or implied herein, are committed at your own risk, financial or otherwise.

AUDUSD Breakout and Potential RetraceHey Traders, in the coming week we are monitoring AUDUSD for a buying opportunity around 0.65400 zone, AUDUSD was trading in a downtrend and successfully managed to break it out. Currently is in a correction phase in which it is approaching the retrace area at 0.65400 support and resistance area.
Trade safe, Joe.

AUDUSD H4 | Bearish Reaction Off Key ResistanceMomentum: Bearish
Price is currently within the bearish ichimoku cloud.
Sell entry: 0.65142
- Strong overlap resistance
- 61.8% Fib retracement
- 127.2% Fib extension
Stop Loss: 0.65738
- Swing high resistance
Take Profit: 0.64640
- Overlap support
High Risk Investment Warning
Stratos Markets Limited (tradu.com/uk ), Stratos Europe Ltd (tradu.com/eu ):
CFDs are complex instruments and come with a high risk of losing money rapidly due to leverage. 70% of retail investor accounts lose money when trading CFDs with this provider. You should consider whether you understand how CFDs work and whether you can afford to take the high risk of losing your money.
Stratos Global LLC (tradu.com/en ): Losses can exceed deposits.
Please be advised that the information presented on TradingView is provided to Tradu (‘Company’, ‘we’) by a third-party provider (‘TFA Global Pte Ltd’). Please be reminded that you are solely responsible for the trading decisions on your account. Any information and/or content is intended entirely for research, educational and informational purposes only and does not constitute investment or consultation advice or investment strategy. The information is not tailored to the investment needs of any specific person and therefore does not involve a consideration of any of the investment objectives, financial situation or needs of any viewer that may receive it. Past performance is not a reliable indicator of future results. Actual results may differ materially from those anticipated in forward-looking or past performance statements. We assume no liability as to the accuracy or completeness of any of the information and/or content provided herein and the Company cannot be held responsible for any omission, mistake nor for any loss or damage including without limitation to any loss of profit which may arise from reliance on any information supplied by TFA Global Pte Ltd.

AUD/USD: Buying Opportunity with Continued UptrendCurrently, AUD/USD is continuing its strong uptrend, and with macroeconomic factors supporting this move, the price is likely to continue rising in the short term. After breaking the 0.65 level, this pair is heading towards higher resistance levels, with the nearest target being 0.6570.
With high inflation in Australia, the Reserve Bank of Australia (RBA) is less likely to cut interest rates , which provides stability and support for the AUD. In addition, the expectation that the Federal Reserve will cut rates in December continues to weaken the USD, creating an opportunity for AUD/USD to rise. The current chart shows a recovery price pattern with solid support at the 0.6520 level, reinforcing the uptrend.
The next resistance level that AUD/USD could reach is 0.6570. If the price corrects to the 0.6520 area and holds, it will be an ideal buying opportunity to continue the uptrend. However, traders should be cautious with upcoming economic data from the US. If there is positive news from the US, the USD may quickly recover, causing a pullback for AUD/USD.

AUDUSD Buy Bias Next WeekSimply looking to buy next week as the last Weekly candle closed strongly bullish, while the 4H too flipped bullish. OANDA:AUDUSD

AUDUSD: trendline breakout🛠 Technical Analysis: On the 4-hour timeframe, AUDUSD has broken above a key descending trendline and is currently testing immediate resistance near 0.65595. Although a "Global bearish signal" remains visible from the previous crossover, the recent price action suggests a bullish reversal if buyers can clear this short-term obstacle. The projected trade setup anticipates a confirmed breakout above this level, opening the door for a rapid rally toward the main resistance zone at 0.66200.
🌍 Fundamental Analysis: Volatility is expected to increase towards the end of the week amid Australian GDP data and key US data on Friday and Thursday. Traders are also exercising caution ahead of next week's Fed meeting, but this is more relevant to the medium-term outlook.
❗️ Trade Parameters (BUY) ❗️
➡️ Entry Point: Buy on breakout above short-term resistance (approx. 0.65600 – 0.65650)
🎯 Take Profit: 0.66200 (Major Resistance Zone)
🔴 Stop Loss: Below the recent consolidation (approx. 0.65369)
⚠️ Disclaimer: This is a potential trade idea based on current analysis; market conditions and price direction are subject to change based on news factors and volatility.

Will AUDUSD decline further or remain Bullish? AUDUSD Swing Analysis:
On Weekly chart price is in a Bearish trend , Daily chart price is in a Bullish trend and H4 is in a Bearish trend .
Following daily chart price action, price has pulled back into discounted levels and mitigated the daily OB which is aligned with the weekly key level 0.64105. Price reacted with a strong bullish momentum from this key level which caused price to surge towards the H4 premium levels. Ideally, I am expecting daily chart to facilitate a bullish move to take out the daily weak HH around 0.67068 which is also aligned with weekly key level.
But not all timeframes are aligned, it is best to take a step back and observe how price plays out. Swing structure is Bullish.
Internal structure
While the daily chart is bullish, H4 is in a bearish trend and price has mitigated the H4-OB.
I am expecting price to decline towards H4-LL and possible below daily-LL 0.64105 which is aligned with weekly key level. I am bearish and for possible short positions, it is best to wait for confirmation entries, and we could target the H4-LL.

AUDUSD SHORT TO LONGThere's heavy volume under the red demand (0.64700)
This confirms it is major institutional demand.
•There is low volume between 0.65500 → 0.64900
This is perfect for a fast corrective drop
after breaking the short-term grey zone.
• The top of the chart shows lower volume on the final push up
This indicates weakening buyers, confirming distribution.


Quick AUDUSD Top Down AnalysisIn this video, I go over AUDUSD from the 4Hr and the 1Hr perspective.
There are clean setups happening, and we are in a ranging zone for the next breakout move.
Watch the video for a detailed breakdown!
Like and follow to get more analysis and updates like this.

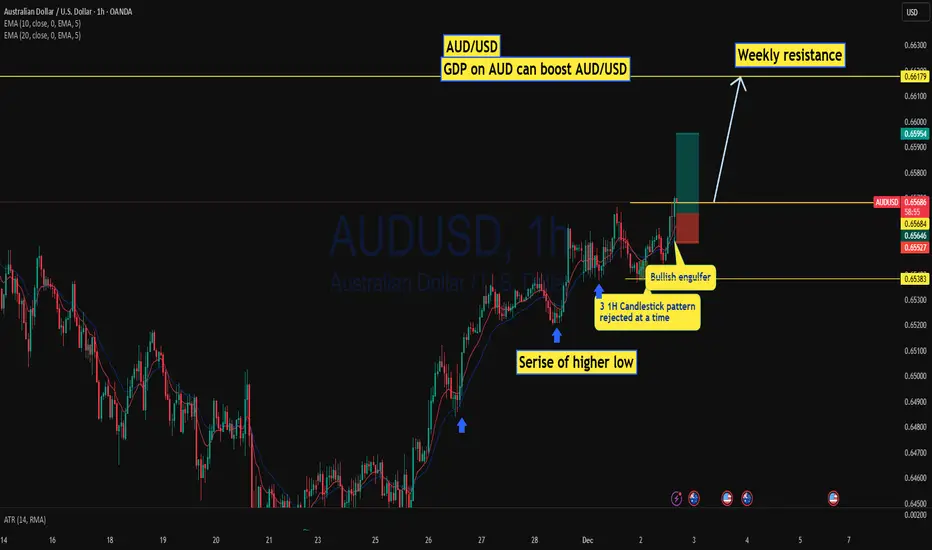
AUD/USD GDP data create a breakout on this pairTrade setup AUD/USD
AUD/USD has finally broken out of recent weekly resistance after previous weekly bullish engulfting candlestick with lowertimeframe uptrend price now breaking out of recent high of 0.65684
With upcoming GDP data on AUD price is showing multiple liquidity grab from 1h support level. There has been 3 1h rejection in a row at price level @0.65383 showing a higher probality move on this pair to the upside.
📌 Entry criteria
Look for bullish continuation above price level 0.65684
Exit Criteria
Targets (Resistance Level)
0.66179
Stoploss level :
Below 0.6538
Market Hunter’s AUDUSD Roadmap: Patiently Awaited Buy LevelsMy friends, greetings
I have prepared an AUDUSD analysis for you.📊
If AUDUSD falls to the 0.64528 – 0.64363 levels, I will open a BUY position there.
Once AUDUSD reaches my BUY entry point, I will share the targets with you here.⚡
You will be informed when I update this analysis.🔔
My friends, I share these analyses thanks to every single like I receive from you.
Your likes increase my motivation and make me want to support you in this way.🙏
I sincerely thank all my friends who support me with their likes.❤️

AUD/USD 2-hour chart Pattern.....AUD/USD 2-hour chart open, with trend lines, Ichimoku cloud, and two “Target Point” markers drawn. From what’s visible:
1. First Target: Around 0.6518 (marked on the chart as the lower target line).
2. Second Target: Around 0.6575 (the higher target line).
These targets appear to be based on a breakout from the descending trendline, with projected upward moves indicated by the vertical arrows.

AUDUSDAUDUSD 📉4H
SELL
Entry 0.65166
SL 0.65810
TP 0.64040
Should you find this analysis insightful, I invite you to like or leave a comment. Constructive feedback and suggestions are greatly appreciated. For further analyses, please follow me at @ydnldn.

AUDUSD H4 | Bearish Reversal Off 61.8% Fibonacci ResistanceMomentum: Bearish
The price is rising toward the sell entry, which aligns with the 61.8% Fibonacci retracement.
Sell entry: 0.6516
Strong overlap resistance
61.8% Fibonacci retracement
Stop loss: 0.6537
Pullback resistance
Slightly below the 78.6% Fibonacci retracement.
Take profit: 0.6465
Overlap support
High Risk Investment Warning
Stratos Markets Limited (tradu.com ), Stratos Europe Ltd (tradu.com ):
CFDs are complex instruments and come with a high risk of losing money rapidly due to leverage. 70% of retail investor accounts lose money when trading CFDs with this provider. You should consider whether you understand how CFDs work and whether you can afford to take the high risk of losing your money.
Stratos Global LLC (tradu.com ): Losses can exceed deposits.
Please be advised that the information presented on TradingView is provided to Tradu (‘Company’, ‘we’) by a third-party provider (‘TFA Global Pte Ltd’). Please be reminded that you are solely responsible for the trading decisions on your account. Any information and/or content is intended entirely for research, educational and informational purposes only and does not constitute investment or consultation advice or investment strategy. The information is not tailored to the investment needs of any specific person and therefore does not involve a consideration of any of the investment objectives, financial situation or needs of any viewer that may receive it. Past performance is not a reliable indicator of future results. Actual results may differ materially from those anticipated in forward-looking or past performance statements. We assume no liability as to the accuracy or completeness of any of the information and/or content provided herein and the Company cannot be held responsible for any omission, mistake nor for any loss or damage including without limitation to any loss of profit which may arise from reliance on any information supplied by TFA Global Pte Ltd.

AUDUSD STRONG BREAKOUT|LONG|
✅ AUDUSD is breaking structure as it trades out of the demand block, signalling a continuation toward the upside liquidity pocket. With momentum shifting, the pair aims to draw toward the next clean inefficiency above before reaction. Time Frame 4H.
LONG🚀
✅Like and subscribe to never miss a new idea!✅

AUDUSD: Market Sentiment & Forecast
Our strategy, polished by years of trial and error has helped us identify what seems to be a great trading opportunity and we are here to share it with you as the time is ripe for us to sell AUDUSD.
Disclosure: I am part of Trade Nation's Influencer program and receive a monthly fee for using their TradingView charts in my analysis.
❤️ Please, support our work with like & comment! ❤️

Buy continuation for the Aussie Dollar - 6 pips SLPrice might take the SL and use a poi below to buy but 6 pips SL is a bargain...use proper risk and money management still !.

AUDUSD: Expect Bearish.Hi traders, what do you think about this idea. will the price retrace or break above the trendline ?
AUDUSD has fulfilled my previous idea, by successfully reaching our target at 0.6540, after retracing above the support level. the pair is trending on a downward momentum of support and resistance for this couple of weeks. it have a been a moment of buying at lows and selling at highs, which we anticipate a short in respect to the market structure and trend.
Key points;
A clear and confirmed reversal below the resistance, would trigger a sell down to 0.6460-0.6400 as the potential target.
Happy weekend,
Thanks for reading.

Sell into New YearHi, think there is at first a small rally to 65.2ish for a short. Possibly accompanied by NzdUsd to 56.6, and UsdCad down to 1.406. Then a sustained sell for the Aussie to 62ish into January for a commodity fuelled rally late in first quarter/early second quarter.

AUDUSD reached resistance short and then long AUDUSD reached resistance area and pullback or correction to fib 0.5 and 0.75 level possible before further rise .

Bearish Symmetrical Triangle Breakdown with Strong Downside AUD/USD 4H – Bearish Symmetrical Triangle Breakdown with Strong Downside Momentum
Detailed Description & Analysis:
Pair: AUD/USD (Australian Dollar vs US Dollar)
Timeframe: 4-hour chart
Key Technical Observations:
Overall Trend:
Strongly bearish. The pair has been in a clear downtrend since early November, making lower highs and lower lows.
Pattern:
A large symmetrical triangle (highlighted in green shading) formed between roughly 10–25 November.
Upper trendline: descending resistance connecting the highs around 0.6620 → 0.6582 → 0.6539
Lower trendline: ascending support connecting the swing lows
The triangle acted as a continuation pattern within the broader downtrend.
Breakdown:
Price broke decisively below the lower trendline of the triangle around 25–26 November with a strong bearish candle and increased volume (visible acceleration downward). This confirms the bearish resolution of the pattern.
Current Price Action (as of 28 Nov):
Trading at ~0.6422 (marked in blue) after a sharp drop from the 0.6582–0.6590 area.
Recent 4H candles show almost uninterrupted selling pressure with very little retracement.
Key Levels:
Immediate resistance: Former triangle support (now resistance) around 0.6480–0.6500
Major horizontal resistance: 0.6582 (multiple prior highs)
Next major support: Psychological 0.6400, then 0.6350–0.6330 zone (2023–2024 lows)
Measured Move Target (from triangle):
Height of the triangle at its widest point ≈ 350–400 pips.
Subtracting from the breakdown point (~0.6520) gives a textbook target around 0.6120–0.6170 longer-term.
Momentum & Sentiment:
Extremely bearish. No meaningful bullish divergence or reversal candles yet. Risk of further capitulation toward multi-year lows if 0.6400 gives way.