AUDUSD potential SELL setupAUDUSD
Bearish Setup
Breakout Analysis:
Distribution pattern with breakdown below key support suggests downside acceleration/momentum.
Strategy Framework:
Since the forecast calls for more downside momentum we can anticipate a corrective move towards BOS. The zone between BOS and Resistance Zone give us our POI, where we should be looking for shorts to ride the downside wave towards our targets.
Technical Analysis:
- Breakdown Level:
- Entry Strategy: Short on confirmed BOS level
- Stop Loss: Above Resistance zone.
Target Zones:
- Primary Target: 1 (R:R 1:2)
- Secondary Target: 2 (R:R 1:3)
- Extension Target: 3 (R:R 1:4)
Bearish Confirmations:
🔻 Rejection candlestick patterns
🔻 Bearish Reversal patterns
🔻 Impulsive moves in line with setups directional bias
Position Management:
- Exit: Partial profits at targets
- Stop adjustment: Trail below resistance
LIKE or COMMENT if this idea sparks your interest, or share your thoughts below!
FOLLOW to keep up with fresh ideas.
Tidypips: "Keep It Clean, Trade Mean!"
Trade ideas

AUDUSD Daily – Testing Demand Zone, Wait for H1 ConfirmationPrice has reached into a daily demand zone around the 0.6430–0.6400 area, a level that previously acted as a launchpad for bullish moves. From a structural standpoint, AUDUSD recently broke structure to the upside, then retraced to mitigate the last bullish impulse before that break , a classic Smart Money Concepts (SMC) behaviour showing a potential shift in order flow.
This zone now represents a high-value area where institutional demand could react again. However, given the size of the daily timeframe, precision entries should only be considered after lower timeframe confirmation, ideally on H1.
Waiting for confirmation means looking for a Break of Structure (BOS) on the H1 chart, a liquidity sweep, or a strong bullish displacement candle. This ensures that the market shows real intent to move higher before capital is committed.

Lingrid | AUDUSD Demand Zone Bounce OpportunityFX:AUDUSD extended its decline after a clear rejection from the resistance zone, breaking below both its upward channel and short-term support trendline. Price is now approaching the demand zone near 0.6430. A rejection and rebound above 0.6430 would confirm a short-term recovery setup as buyers attempt to regain control. Momentum currently leans corrective rather than impulsive, suggesting a possible consolidation before any larger directional move.
⚠️ Risks:
Weakness in commodities or a stronger USD could delay recovery attempts.
Failure to hold 0.6430 may expose price to deeper losses.
Upcoming U.S. macro data could increase volatility across USD pairs.
If this idea resonates with you or you have your own opinion, traders, hit the comments. I’m excited to read your thoughts!

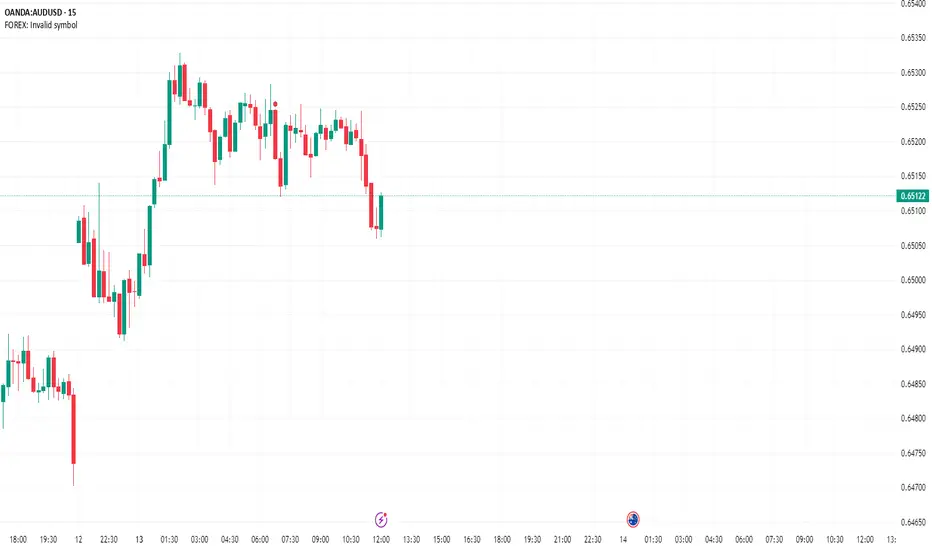
AUDUSD breakdown:Hidden oppportunity while Gold grabs headlines?While everyone's watching gold hit fresh records after Trump's China tariff threats, there's an overlooked opportunity in AUDUSD that could be setting up for a major breakdown.
The Australian dollar just broke key support at 0.6520 against the USD, creating a fundamental and technical alignment for further downside. With Australia sending 63% of its exports to China, any trade war escalation directly impacts the Aussie dollar.
Key Drivers:
Trade War Impact : Australia's heavy dependence on China makes AUD vulnerable to US-China trade war escalation
Technical Breakdown : Break below 0.6520 support with Fibonacci targets at 0.6443, 0.6311, and 0.6254
Dollar Strength : Government shutdown paradoxically supports USD strength by removing spending and debt payments from the equation
RSI Momentum : RSI shows room for further decline with potential head and shoulders pattern forming, targeting the neckline first
This macro/technical alignment presents a strong trading setup. When others chase gold headlines, smart traders can position for the AUD breakdown. Trade smart, respect the levels, and don't miss this overlooked opportunity.
This content is not directed to residents of the EU or UK. Any opinions, news, research, analyses, prices or other information contained on this website is provided as general market commentary and does not constitute investment advice. ThinkMarkets will not accept liability for any loss or damage including, without limitation, to any loss of profit which may arise directly or indirectly from use of or reliance on such information.

AUDUSD Daily FRGNT Forecast - Q4 | W42 | D14 | Y25|📅 Q4 | W42 | D14 | Y25|
📊 AUDUSD Daily FRGNT Forecast
🔍 Analysis Approach:
I’m applying Smart Money Concepts, focusing on:
Identifying Points of Interest on the Higher Time Frames (HTFs) 🕰️
Using those POIs to define a clear trading range 📐
Refining those zones on Lower Time Frames (LTFs) 🔎
Waiting for a Break of Structure (BoS) for confirmation ✅
This method allows me to stay precise, disciplined, and aligned with the market narrative, rather than chasing price.
💡 My Motto:
"Capital management, discipline, and consistency in your trading edge."
A positive risk-to-reward ratio, paired with a high win rate, is the backbone of any solid trading plan 📈🔐
⚠️ Losses?
They’re part of the mathematical game of trading 🎲
They don’t define you — they’re necessary, they happen, and we move forward 📊➡️
🙏 I appreciate you taking the time to review my Daily Forecast.
Stay sharp, stay consistent, and protect your capital
— FRNGT 🚀
FX:AUDUSD

25-09-2025 AUDUSDAs shown in the figure: 1H Bullish Shark
The market is not always chaotic and disorderly, and there is a precise geometric beauty hidden in price fluctuations. The harmonic form long strategy is a powerful tool for accurately identifying potential market reversal points based on the Fibonacci ratio. When the form forms perfectly at the key support level, it often indicates the depletion of bearish momentum and the initiation of bullish trends.

Heading into major resistance?AUD/USD is rising towards the pivot, which is an overlap resistance and oculd reverse to the multi swing low support.
Pivot: 0.6551
1st Support: 0.6469
1st Resistance: 0.6619
Disclaimer:
The above opinions given constitute general market commentary, and do not constitute the opinion or advice of IC Markets or any form of personal or investment advice.
Any opinions, news, research, analyses, prices, other information, or links to third-party sites contained on this website are provided on an "as-is" basis, are intended only to be informative, is not an advice nor a recommendation, nor research, or a record of our trading prices, or an offer of, or solicitation for a transaction in any financial instrument and thus should not be treated as such. The information provided does not involve any specific investment objectives, financial situation and needs of any specific person who may receive it. Please be aware, that past performance is not a reliable indicator of future performance and/or results. Past Performance or Forward-looking scenarios based upon the reasonable beliefs of the third-party provider are not a guarantee of future performance. Actual results may differ materially from those anticipated in forward-looking or past performance statements. IC Markets makes no representation or warranty and assumes no liability as to the accuracy or completeness of the information provided, nor any loss arising from any investment based on a recommendation, forecast or any information supplied by any third-party.

AUDUSD: Bearish Move From Resistance Confirmed?! 🇦🇺🇺🇸
There is a high chance that AUDUSD will retrace
from the underlined blue resistance.
As a confirmation, I spotted a descending triangle pattern
on an hourly time frame.
I expect a bearish move to 0.6488 level.
❤️Please, support my work with like, thank you!❤️
I am part of Trade Nation's Influencer program and receive a monthly fee for using their TradingView charts in my analysis.

AUDUSD Pivotal trading zone at 0.6525The AUDUSD remains in a neutral trend, with recent price action showing signs of a corrective pullback within the broader uptrend.
Support Zone: 0.6475 – a key level from previous consolidation. Price is currently testing or approaching this level.
A bullish rebound from 0.6475 would confirm ongoing upside momentum, with potential targets at:
0.6546 – initial resistance
0.6575 – psychological and structural level
0.6590 – extended resistance on the longer-term chart
Bearish Scenario:
A confirmed break and daily close below 0.6475 would weaken the bullish outlook and suggest deeper downside risk toward:
0.6460 – minor support
0.6440 – stronger support and potential demand zone
Outlook:
Neutral bias remains intact while the AUDUSD trades around pivotal 0.6475 level. A sustained break below or above this level could shift momentum.
This communication is for informational purposes only and should not be viewed as any form of recommendation as to a particular course of action or as investment advice. It is not intended as an offer or solicitation for the purchase or sale of any financial instrument or as an official confirmation of any transaction. Opinions, estimates and assumptions expressed herein are made as of the date of this communication and are subject to change without notice. This communication has been prepared based upon information, including market prices, data and other information, believed to be reliable; however, Trade Nation does not warrant its completeness or accuracy. All market prices and market data contained in or attached to this communication are indicative and subject to change without notice.

Bullish Movement take you TP OpenBefore finalizing the trade, please take a moment to carefully review and confirm your decision to ensure that all details align with your expectations and objectives.
AUDUSD Daily FRGNT Forecast - Q4 | W42 | D13 | Y25|📅 Q4 | W42 | D13 | Y25|
📊 AUDUSD Daily Forecast
🔍 Analysis Approach:
I’m applying Smart Money Concepts, focusing on:
Identifying Points of Interest on the Higher Time Frames (HTFs) 🕰️
Using those POIs to define a clear trading range 📐
Refining those zones on Lower Time Frames (LTFs) 🔎
Waiting for a Break of Structure (BoS) for confirmation ✅
This method allows me to stay precise, disciplined, and aligned with the market narrative, rather than chasing price.
💡 My Motto:
"Capital management, discipline, and consistency in your trading edge."
A positive risk-to-reward ratio, paired with a high win rate, is the backbone of any solid trading plan 📈🔐
⚠️ Losses?
They’re part of the mathematical game of trading 🎲
They don’t define you — they’re necessary, they happen, and we move forward 📊➡️
🙏 I appreciate you taking the time to review my Daily Forecast.
Stay sharp, stay consistent, and protect your capital
— FRNGT 🚀
FX:AUDUSD

AUDUSD Trade Plan 13/10/2025Dear Traders,
The Australian dollar is still within its long-term upward channel. Considering my expectation of a stronger U.S. dollar and the ongoing tariff war between the U.S. and China, a weakening of the Australian dollar seems likely. The highlighted zones have the potential for a reversal or a breakout of the multi-month channel.
Regards,
Alireza!

AUDUSD H4 | Approaching a Confluence Resistance LevelBased on the H4 chart analysis, we could see the price rise to the sell entry which is an overlap resistance that is slightly below the 61.8% Fibonacci retracement and could reverse from this level to the downside.
Sell entry is at 0.6549, which is an overlap resistance that is slightly below the 61.8% Fibonacci retracement and could reverse from this level to the downside.
Stop loss is at 0.6620, which acts as a multi-swing high resistance.
Take profit is at 0.6469, which is a pullback support.
High Risk Investment Warning
Trading Forex/CFDs on margin carries a high level of risk and may not be suitable for all investors. Leverage can work against you.
Stratos Markets Limited (tradu.com ):
CFDs are complex instruments and come with a high risk of losing money rapidly due to leverage. 65% of retail investor accounts lose money when trading CFDs with this provider. You should consider whether you understand how CFDs work and whether you can afford to take the high risk of losing your money.
Stratos Europe Ltd (tradu.com ):
CFDs are complex instruments and come with a high risk of losing money rapidly due to leverage. 66% of retail investor accounts lose money when trading CFDs with this provider. You should consider whether you understand how CFDs work and whether you can afford to take the high risk of losing your money.
Stratos Global LLC (tradu.com ):
Losses can exceed deposits.
Please be advised that the information presented on TradingView is provided to Tradu (‘Company’, ‘we’) by a third-party provider (‘TFA Global Pte Ltd’). Please be reminded that you are solely responsible for the trading decisions on your account. There is a very high degree of risk involved in trading. Any information and/or content is intended entirely for research, educational and informational purposes only and does not constitute investment or consultation advice or investment strategy. The information is not tailored to the investment needs of any specific person and therefore does not involve a consideration of any of the investment objectives, financial situation or needs of any viewer that may receive it. Kindly also note that past performance is not a reliable indicator of future results. Actual results may differ materially from those anticipated in forward-looking or past performance statements. We assume no liability as to the accuracy or completeness of any of the information and/or content provided herein and the Company cannot be held responsible for any omission, mistake nor for any loss or damage including without limitation to any loss of profit which may arise from reliance on any information supplied by TFA Global Pte Ltd.
The speaker(s) is neither an employee, agent nor representative of Tradu and is therefore acting independently. The opinions given are their own, constitute general market commentary, and do not constitute the opinion or advice of Tradu or any form of personal or investment advice. Tradu neither endorses nor guarantees offerings of third-party speakers, nor is Tradu responsible for the content, veracity or opinions of third-party speakers, presenters or participants.

AUDUSD SELLAUDUSD - Distribution
I think we could see a repeat of trade tensions, which could allow for some downside on AUDUSD and for the distribution to finally take place.
We are seeing some breaks in structure, and I'll be closely watching for some confirmation on a pullback.
Let's see I could be wrong !!!

Bearish drop off?The Aussie (AUD/USD) could rise to the pivot and could reverse to the 1st support which is an overlap support.
Pivot: 0.6543
1st Support: 0.6383
1st Resistance: 0.6680
Disclaimer:
The above opinions given constitute general market commentary, and do not constitute the opinion or advice of IC Markets or any form of personal or investment advice.
Any opinions, news, research, analyses, prices, other information, or links to third-party sites contained on this website are provided on an "as-is" basis, are intended only to be informative, is not an advice nor a recommendation, nor research, or a record of our trading prices, or an offer of, or solicitation for a transaction in any financial instrument and thus should not be treated as such. The information provided does not involve any specific investment objectives, financial situation and needs of any specific person who may receive it. Please be aware, that past performance is not a reliable indicator of future performance and/or results. Past Performance or Forward-looking scenarios based upon the reasonable beliefs of the third-party provider are not a guarantee of future performance. Actual results may differ materially from those anticipated in forward-looking or past performance statements. IC Markets makes no representation or warranty and assumes no liability as to the accuracy or completeness of the information provided, nor any loss arising from any investment based on a recommendation, forecast or any information supplied by any third-party.

AUDUSD – Weekly FRGNT Forecast -Q4 | W42 | Y25📊 AUDUSD – Weekly Forecast
💡 Weekly FRGNT Insight
Q4 | W42 | Y25
Weekly Outlook 🔍📅
Here’s a concise breakdown of the current market structure 🧠📈
Higher time frame order blocks have been identified — these remain our key points of interest for potential reactions 🎯🧭.
Patience is key:
Wait for a confirmed break of structure (BOS) 🧱✅ before forming a directional bias. This keeps us disciplined and aligned with what price action is actually showing — not what we want to see.
📈 Risk Management Protocols
🔑 Core principles:
-Risk no more than 1% per trade
-Execute only at pre-identified levels
-Let alerts, not emotions, guide decisions
-Maintain your minimum 1:3 RR plan
🧠 Remember: You’re not paid for how many trades you take, but for how well you manage risk.
“Trade what the market gives — not what your ego wants.”
Stay mechanical. Stay focused. Let the probabilities play out.
FRGNT
FX:AUDUSD

AUDUSD ANALYSIS -10/12/25U.S. continues to see a government shutdown. This has strongly impacted AUDUSD in the past week. Take a look at my analysis.

"AUD/USD Breakout | Bullish Robbery to Overbought Resistance"🚨💰🦘 AUD/USD "The Aussie" Forex Bank Heist 💰🚨
Oi mates & fellow market robbers! 🏴☠️💵
This is your Thief Trader breaking into the Aussie vault — and this time, the loot is in pips, not gold bars. 😎
💥 MISSION PLAN: Bullish raid with layered limit orders — stacking like a pro safecracker. No hesitation, no mercy. Entry? Any price the vault door swings open. 📈🔓
📍 ENTRY:
🎯 Slip in at ANY level, but a true thief knows how to wait for the pullback sweet spots. Layer the buys like bricks in a getaway tunnel.
🛑 STOP LOSS:
🚔 Park it at 0.64900 — our last escape hatch before the police sirens get too close.
🎯 TARGET:
💣 0.66200 — POLICE BARRICADE RESISTANCE ZONE 🚧🔥 Overbought territory where the getaway chopper is waiting.
📊 Why the Aussie vault is ripe for robbery:
Bullish momentum is loading up like a cash van before payday. 💵
Big players pushing price higher — we just tailgate the convoy. 🚚💨
Layering entries means more bags filled if the price dips before liftoff. 🛍️
⚠ Robbery Rules:
Avoid news time unless you love chaos. 📢
Keep SL tight and respect the plan — greedy thieves get caught.
Trailing stop = locking loot while the ride continues.
💖 Boost this heist plan if you’re rolling with the crew! 🚀💰 The more likes, the louder the sirens, the bigger the thrill.
🏆 Stay sharp, stay sneaky, and let’s rob the Aussie bank together! 🐱👤💸

AUDUSD IDEA Price is currently a support area on the 4H timeframe. If this area holds, I'm expecting price to test the downwards trend line before continuing with the bearish momentum down to the 0.64200 support.

AUDUSD LONG I believe price has broken structure to the upside indicating a clear uptrend movement, now price should fill the unmitigated supply level and give us a move back to the upside to continue the trend FOREXCOM:AUDUSD

AUDUSD SET UP Based on the technical analysis it seems to be a bullish move on the #AUDUSD price, which is retracing to a very key area on the daily, four-hour, two-hour and one-hour timeframes, this is an excellent confirmation that the price is about to surge high. I am optimistic about the bull move on AUDUSD in the coming weeks

AUDUSD | Bearish Rejection from Order Block – Target doneHello Billionaires!!
In AUDUSD just delivered a clean Smart Money bearish setup — rejecting from the FVG + Order Block (OB) zone in premium pricing.
After taking the Buy Side Liquidity (BSL), price shifted structure and is now aggressively heading toward the BPR & SSL zone below.
Every pullback is now a chance for Smart Money to sell at premium levels 🚀
📊 Market Storyline:
BSL taken, confirming liquidity grab ✅
FVG + OB rejection in premium ✅
Structural shift to bearish order flow ✅
Target → SSL liquidity zones ✅
Smart Money stays one step ahead — retail still looking for longs 😏
#AUDUSD #AliyanFX #SmartMoneyConcepts #ICT #PriceAction #Liquidity #FVG #BPR #OB #SMC #Forex #TradingViewIdeas

AUDUSD--SHORT--bearish continuation
--monthly bearish
--weekly bearish
--daily bearish
--entry and tp levels are as shown on the chart
