AUDUSDFriday witnessed a big sell. I will watch closely to see any bullish signal as this down move is too sharp, and the DTF IFVG just right there. I target the zone from 0.64500 to 0.64100 for a buy but wont hold long, unless I see the price breaks the previous consolidation to go higher.
Trade ideas

AUDUSD Will Go Down!
HI,Traders !
#AUDUSD already made a
Retest of the horizontal
Level of 0.66145 from where
We are already seeing a
Bearish reaction so we
Will be expecting a
Further bearish move down !
Comment and subscribe to help us grow !

AUDUSD Wave Analysis – 10 October 2025
- AUDUSD broke support level 0.6525
- Likely to fall to support level 0.6410
AUDUSD currency pair recently broke the support zone between the support level 0.6525 (low of wave (1) from September), 61.8% Fibonacci correction of the upward impulse (C) from August and the support trendline from April.
The breakout of this support zone accelerated the active intermediate impulse wave (3).
Given the strongly bullish US dollar sentiment seen today, AUDUSD currency pair can be expected to fall to the next support level 0.6410 (former low of wave (B) from August).

AUDUSD what a move TPIf you check my post you'll see when I posted about this
Thou I didn't wait for the TP to hit but I was sure 100%
Some people sent me a dm saying they held that's fine
At the end of the day we all want something from the market
Congratulations if you took it

AUDUSD short This pair created a reversal pattern
Double top on the higher timeframe
On the lower time frame it created a continuation from the neckline confirming neckline breakout.
The pair is continuing in its down trend.

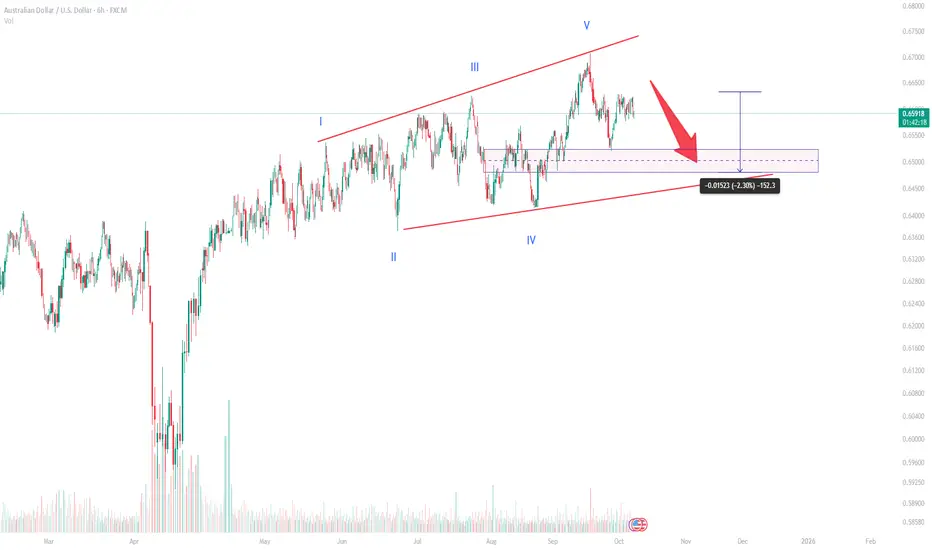
Rising Diagonal Pattern Near CompletionAUD/USD Elliott Wave Analysis – Rising Diagonal Pattern Near Completion
Overview
The AUD/USD pair has formed a clear ending diagonal pattern, signaling potential exhaustion of the current bullish trend. This structure, often seen at the final stage of an impulse wave, suggests that a corrective phase may soon follow. The diagonal appears complete with all five internal waves labeled (I-V), indicating that the market might be preparing for a deeper pullback.
Technical Analysis
According to the Elliott Wave structure visible on the 6-hour chart, AUD/USD completed its fifth and final wave near the 0.67 region. The wedge pattern is now narrowing, with bearish divergence hinting at weakening bullish momentum.
Wave Structure:
Wave I started the diagonal formation, initiating the rising trend.
Waves II and IV acted as corrections, forming higher lows.
Wave V extended slightly but failed to make a strong breakout, suggesting exhaustion.
The price currently trades near 0.6560, with a potential retracement zone between 0.6450 and 0.6500. This range coincides with a strong demand zone and the lower boundary of the diagonal pattern. A pullback into this area could complete the corrective (A)-(B)-(C) structure before the next major directional move.
Key Levels
Support Zone: 0.6450 – 0.6500
Immediate Resistance: 0.6650 – 0.6680
Breakout Confirmation: A sustained break below 0.6450 could confirm the end of the diagonal and open the door toward 0.63 in the medium term.
Invalidation: A breakout above 0.67 would invalidate the bearish correction scenario.
Market Outlook
The diagonal’s completion suggests that the pair may enter a short-term correction phase. However, traders should monitor price action near the support area before confirming the next trend direction. If buyers defend the 0.6450 zone, a rebound toward 0.6650 is likely. Conversely, a clear break below the wedge would strengthen bearish momentum.
Given the overall wave count, the market is likely in transition between an impulsive and a corrective phase. Patience is crucial at this stage, as the next few sessions will determine whether the larger uptrend resumes or a deeper retracement unfolds.
Pullback TradeThe market is on bearish movement for many days now, and the price has rejected this area multiple times today, as we can see the market made a strong bearish move on the 4 hour Timeframe, suggesting that a bearish movement is at hand
WE ONLY TRADE PULLBACKS
comment your thoughts

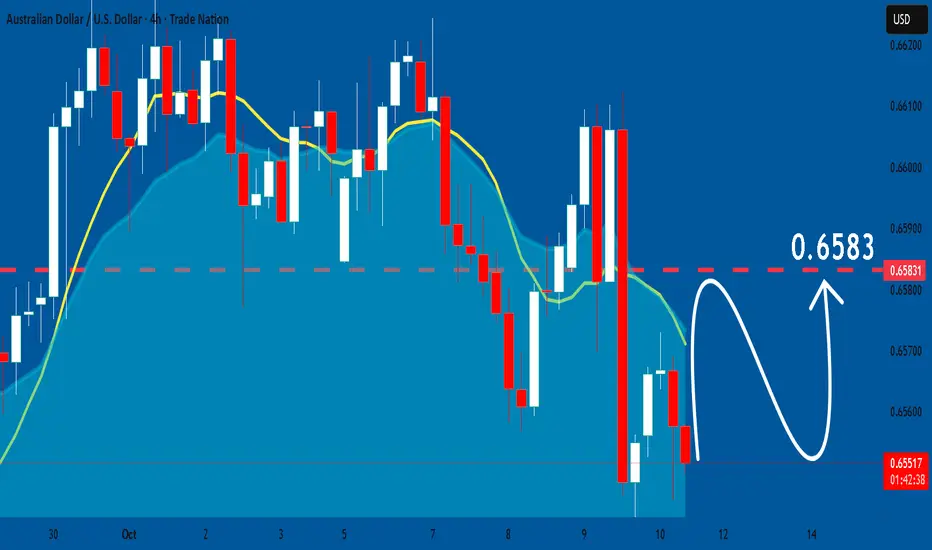
AUDUSD: Expecting Bullish Movement! Here is Why:
Looking at the chart of AUDUSD right now we are seeing some interesting price action on the lower timeframes. Thus a local move up seems to be quite likely.
Disclosure: I am part of Trade Nation's Influencer program and receive a monthly fee for using their TradingView charts in my analysis.
❤️ Please, support our work with like & comment! ❤️
AUDUSD H4 | Bearish Momentum DevelopingAUD/USD is rising towards the sell entry which is a pullback resistance andoculd reverse from this levl to the downside.
Sell entry is at 0.6590, whichis a pullback resistance.
Stop loss is at 0.6621, which is a multi swing high resistance.
Take profit is at 0.6521, which is an overlap support that is slightly above the 61.8% Fibonacci projection.
High Risk Investment Warning
Trading Forex/CFDs on margin carries a high level of risk and may not be suitable for all investors. Leverage can work against you.
Stratos Markets Limited (tradu.com ):
CFDs are complex instruments and come with a high risk of losing money rapidly due to leverage. 65% of retail investor accounts lose money when trading CFDs with this provider. You should consider whether you understand how CFDs work and whether you can afford to take the high risk of losing your money.
Stratos Europe Ltd (tradu.com ):
CFDs are complex instruments and come with a high risk of losing money rapidly due to leverage. 66% of retail investor accounts lose money when trading CFDs with this provider. You should consider whether you understand how CFDs work and whether you can afford to take the high risk of losing your money.
Stratos Global LLC (tradu.com ):
Losses can exceed deposits.
Please be advised that the information presented on TradingView is provided to Tradu (‘Company’, ‘we’) by a third-party provider (‘TFA Global Pte Ltd’). Please be reminded that you are solely responsible for the trading decisions on your account. There is a very high degree of risk involved in trading. Any information and/or content is intended entirely for research, educational and informational purposes only and does not constitute investment or consultation advice or investment strategy. The information is not tailored to the investment needs of any specific person and therefore does not involve a consideration of any of the investment objectives, financial situation or needs of any viewer that may receive it. Kindly also note that past performance is not a reliable indicator of future results. Actual results may differ materially from those anticipated in forward-looking or past performance statements. We assume no liability as to the accuracy or completeness of any of the information and/or content provided herein and the Company cannot be held responsible for any omission, mistake nor for any loss or damage including without limitation to any loss of profit which may arise from reliance on any information supplied by TFA Global Pte Ltd.
The speaker(s) is neither an employee, agent nor representative of Tradu and is therefore acting independently. The opinions given are their own, constitute general market commentary, and do not constitute the opinion or advice of Tradu or any form of personal or investment advice. Tradu neither endorses nor guarantees offerings of third-party speakers, nor is Tradu responsible for the content, veracity or opinions of third-party speakers, presenters or participants.

check the trendIt is expected that the trend will change in the current support area and we will see the start of the upward trend. If the price breaks through the support area, the continuation of the downward trend is likely.

AUDUSD Daily Forecast - Q4 | W41 | D10 | Y25|📅 Q4 | W41 | D10 | Y25|
📊 AUDUSD Daily Forecast
🔍 Analysis Approach:
I’m applying Smart Money Concepts, focusing on:
Identifying Points of Interest on the Higher Time Frames (HTFs) 🕰️
Using those POIs to define a clear trading range 📐
Refining those zones on Lower Time Frames (LTFs) 🔎
Waiting for a Break of Structure (BoS) for confirmation ✅
This method allows me to stay precise, disciplined, and aligned with the market narrative, rather than chasing price.
💡 My Motto:
"Capital management, discipline, and consistency in your trading edge."
A positive risk-to-reward ratio, paired with a high win rate, is the backbone of any solid trading plan 📈🔐
⚠️ Losses?
They’re part of the mathematical game of trading 🎲
They don’t define you — they’re necessary, they happen, and we move forward 📊➡️
🙏 I appreciate you taking the time to review my Daily Forecast.
Stay sharp, stay consistent, and protect your capital
— FRNGT 🚀
FX:AUDUSD

AUDUSD IS GOING TO FLY IN THE MARKETKey Technical Zones:
Resistance Levels:
🔹 0.6582 – Recent rejection zone
🔹 0.6624 – Upper channel resistance
Support Levels:
🔹 0.6540 – Immediate support (currently testing)
🔹 0.6515 – Next downside target if breakdown occurs
Technical Signals:
The falling pressure curve indicates accelerating bearish momentum.
Price action is respecting the descending channel boundaries — each bounce from the upper trendline results in a deeper low.
A minor rebound could occur from the support zone (0.6540) due to oversold conditions, but unless price breaks above 0.6575, the bearish bias remains dominant.

AUDUSD 3 Months uptrend may be setting upGold long positions correlation
BRICS fiat news
No idea from Australian News
Break of 61.8 region may set an 4H uptrend ....
Looking to get a clear buying pressure to hold into buying dips lower.
This might for a good opportunity for 3 months long position...

AUDUSD Bearish EMA(Exponential Moving Average)Wanna share a clean setup to test the strategy
Moving average - Down
Restest resistance
Rejction candle
Extra confirmation with dxy going up soon

Potential bearish reversal ahead?The Aussie (AUD/USD) is rising towards the pivot, which acts as a multi-swing high resistance and could reverse to the pullback support.
Pivot: 0.6620
1st Support: 0.6528
1st Resistance: 0.6657
Disclaimer:
The above opinions given constitute general market commentary, and do not constitute the opinion or advice of IC Markets or any form of personal or investment advice.
Any opinions, news, research, analyses, prices, other information, or links to third-party sites contained on this website are provided on an "as-is" basis, are intended only to be informative, is not an advice nor a recommendation, nor research, or a record of our trading prices, or an offer of, or solicitation for a transaction in any financial instrument and thus should not be treated as such. The information provided does not involve any specific investment objectives, financial situation and needs of any specific person who may receive it. Please be aware, that past performance is not a reliable indicator of future performance and/or results. Past Performance or Forward-looking scenarios based upon the reasonable beliefs of the third-party provider are not a guarantee of future performance. Actual results may differ materially from those anticipated in forward-looking or past performance statements. IC Markets makes no representation or warranty and assumes no liability as to the accuracy or completeness of the information provided, nor any loss arising from any investment based on a recommendation, forecast or any information supplied by any third-party.


AUD/USD 4HR Trendline Breakout Long Setup. Daily Continuation.I will be entering a long trade at the close of the current daily candle on AUD/USD.
Stoploss and take profit provided. With this one management will be if the market does not trade through the target area by daily candle close on Thursday then I will close the trade manually.
Simple trading execution and plan.

AUDUSD Could drop new lowThe AUD/USD is expected to fall further after showing a pullback to the M15 timeframe top in a clear downtrend. The pair is reacting negatively to that resistance area, suggesting that after a short-term retracement to the upside, we could see another move toward new lows.
This setup could offer a high-quality short opportunity with strong potential if the price confirms rejection at the M15 top.
This is not financial advice. You are responsible for your own trades and decisions.

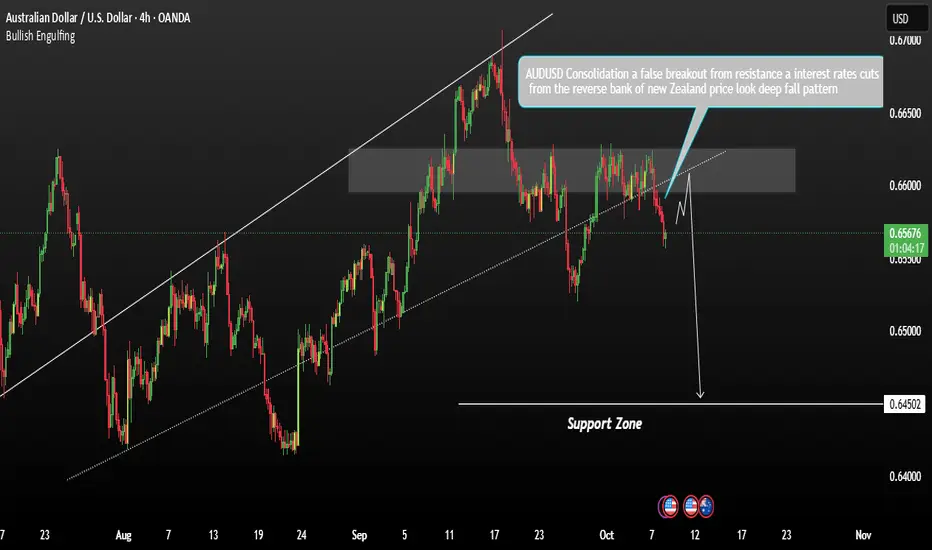
AUDUSD attempted to break above the key resistance levelThe AUD/USD pair recently attempted to break above the key resistance level at 0.6520, but this move appears to have been a false breakout. Following a period of consolidation below resistance, the pair is showing signs of renewed bearish momentum.
From a fundamental perspective, the recent interest rate cuts by the Reserve Bank of New Zealand may have contributed to increased downside pressure on the Australian dollar, strengthening the bearish outlook.
Technical Outlook:
Price is currently trading below the critical resistance zone near 0.6520, confirming sellers are in control Failure to sustain gains above this level suggests a potential continuation of the downtrend If bearish momentum holds, the pair is expected to decline towards the next support level around 0.6450.
You may find more details in the chart.
Trade wisely best of Luck.
Ps; Support with like and comments for better analysis Thanks for Supporting.
AUDUSD Bullish ScenarioAUDUSD presenting a bullish flag pattern ahead of the highly anticipated NFP release which was delayed due to Government Shutdowns in the USA last Friday. Of all USD pairs, AUDUSD look the readiest to move higher as the Australian market enters into Thursday.

possibility of uptrend The recent downtrend is expected to end at the current support level and we will see the start of an uptrend. If the price breaks through the support level, a continuation of the downtrend is likely.

AUDUSD New long term sell-off just starting.The AUDUSD pair has been trading within a 3-year Channel Down pattern. On the September 15 2025 1W candle, the price hit and got rejected on its 1W MA200 (orange trend-line) for the first time since January 30 2023.
That was the pattern's first Bullish Leg and as you can see, even the second one (started September 30 2024) peaked just below the 1W MA200. With the 1W RSI also having been rejected on its 3-year Resistance Zone last month, we expect the pair to start its new Bearish Leg now.
The minimum target on the long-term is the 0.786 Fibonacci retracement level at 0.60700.
-------------------------------------------------------------------------------
** Please LIKE 👍, FOLLOW ✅, SHARE 🙌 and COMMENT ✍ if you enjoy this idea! Also share your ideas and charts in the comments section below! This is best way to keep it relevant, support us, keep the content here free and allow the idea to reach as many people as possible. **
-------------------------------------------------------------------------------
💸💸💸💸💸💸
👇 👇 👇 👇 👇 👇

AUDUSD H4 | Bearish ContinuationThe Aussie (AUD/USD) is rising towards the sell entry, which is a pullback resistance and could drop from this level to the take profit.
Sell entry is at 0.6590, which is a pullback resistance.
Stop loss is at 0.6621, which is a multi-swing high resistance.
Take profit is at 0.6521, which is an overlap support that lines up with the 61.8% Fibonacci projection.
High Risk Investment Warning
Trading Forex/CFDs on margin carries a high level of risk and may not be suitable for all investors. Leverage can work against you.
Stratos Markets Limited (tradu.com ):
CFDs are complex instruments and come with a high risk of losing money rapidly due to leverage. 65% of retail investor accounts lose money when trading CFDs with this provider. You should consider whether you understand how CFDs work and whether you can afford to take the high risk of losing your money.
Stratos Europe Ltd (tradu.com ):
CFDs are complex instruments and come with a high risk of losing money rapidly due to leverage. 66% of retail investor accounts lose money when trading CFDs with this provider. You should consider whether you understand how CFDs work and whether you can afford to take the high risk of losing your money.
Stratos Global LLC (tradu.com ):
Losses can exceed deposits.
Please be advised that the information presented on TradingView is provided to Tradu (‘Company’, ‘we’) by a third-party provider (‘TFA Global Pte Ltd’). Please be reminded that you are solely responsible for the trading decisions on your account. There is a very high degree of risk involved in trading. Any information and/or content is intended entirely for research, educational and informational purposes only and does not constitute investment or consultation advice or investment strategy. The information is not tailored to the investment needs of any specific person and therefore does not involve a consideration of any of the investment objectives, financial situation or needs of any viewer that may receive it. Kindly also note that past performance is not a reliable indicator of future results. Actual results may differ materially from those anticipated in forward-looking or past performance statements. We assume no liability as to the accuracy or completeness of any of the information and/or content provided herein and the Company cannot be held responsible for any omission, mistake nor for any loss or damage including without limitation to any loss of profit which may arise from reliance on any information supplied by TFA Global Pte Ltd.
The speaker(s) is neither an employee, agent nor representative of Tradu and is therefore acting independently. The opinions given are their own, constitute general market commentary, and do not constitute the opinion or advice of Tradu or any form of personal or investment advice. Tradu neither endorses nor guarantees offerings of third-party speakers, nor is Tradu responsible for the content, veracity or opinions of third-party speakers, presenters or participants.
