AUDUSD Daily Forecast -Q4 | W41 | D6 | Y25|📅 Q4 | W41 | D6 | Y25|
📊 AUDUSD Daily Forecast
🔍 Analysis Approach:
I’m applying Smart Money Concepts, focusing on:
Identifying Points of Interest on the Higher Time Frames (HTFs) 🕰️
Using those POIs to define a clear trading range 📐
Refining those zones on Lower Time Frames (LTFs) 🔎
Waiting for a Break of Structure (BoS) for confirmation ✅
This method allows me to stay precise, disciplined, and aligned with the market narrative, rather than chasing price.
💡 My Motto:
"Capital management, discipline, and consistency in your trading edge."
A positive risk-to-reward ratio, paired with a high win rate, is the backbone of any solid trading plan 📈🔐
⚠️ Losses?
They’re part of the mathematical game of trading 🎲
They don’t define you — they’re necessary, they happen, and we move forward 📊➡️
🙏 I appreciate you taking the time to review my Daily Forecast.
Stay sharp, stay consistent, and protect your capital
— FRNGT 🚀
FX:AUDUSD
Trade ideas

AUDUSD H1 | Bearish Drop Confirmation onAUD/USD has rejected off the sell entry, which is a pullback resistance and could drop from this level to the take profit.
Sell entry is at 0.6606, which is a pullback resistance.
Stop loss is at 0.6627, which is a pullback resistance that lines up with the 127.2% Fibonacci extension.
Take profit is at 0.6581, which is a pullback support.
High Risk Investment Warning
Trading Forex/CFDs on margin carries a high level of risk and may not be suitable for all investors. Leverage can work against you.
Stratos Markets Limited (tradu.com ):
CFDs are complex instruments and come with a high risk of losing money rapidly due to leverage. 65% of retail investor accounts lose money when trading CFDs with this provider. You should consider whether you understand how CFDs work and whether you can afford to take the high risk of losing your money.
Stratos Europe Ltd (tradu.com ):
CFDs are complex instruments and come with a high risk of losing money rapidly due to leverage. 66% of retail investor accounts lose money when trading CFDs with this provider. You should consider whether you understand how CFDs work and whether you can afford to take the high risk of losing your money.
Stratos Global LLC (tradu.com ):
Losses can exceed deposits.
Please be advised that the information presented on TradingView is provided to Tradu (‘Company’, ‘we’) by a third-party provider (‘TFA Global Pte Ltd’). Please be reminded that you are solely responsible for the trading decisions on your account. There is a very high degree of risk involved in trading. Any information and/or content is intended entirely for research, educational and informational purposes only and does not constitute investment or consultation advice or investment strategy. The information is not tailored to the investment needs of any specific person and therefore does not involve a consideration of any of the investment objectives, financial situation or needs of any viewer that may receive it. Kindly also note that past performance is not a reliable indicator of future results. Actual results may differ materially from those anticipated in forward-looking or past performance statements. We assume no liability as to the accuracy or completeness of any of the information and/or content provided herein and the Company cannot be held responsible for any omission, mistake nor for any loss or damage including without limitation to any loss of profit which may arise from reliance on any information supplied by TFA Global Pte Ltd.
The speaker(s) is neither an employee, agent nor representative of Tradu and is therefore acting independently. The opinions given are their own, constitute general market commentary, and do not constitute the opinion or advice of Tradu or any form of personal or investment advice. Tradu neither endorses nor guarantees offerings of third-party speakers, nor is Tradu responsible for the content, veracity or opinions of third-party speakers, presenters or participants.

Bullish bounce off major support?AUD/USD has bounced off the support level, which is a pullback support that aligns with the 50% Fibonacci retracement and could bounce from this level to our take profit.
Entry: 0.6579
Why we like it:
There is a pullback support that aligns with the 50% Fibonacci retracement.
Enjoying your TradingView experience? Review us!
Please be advised that the information presented on TradingView is provided to Vantage (‘Vantage Global Limited’, ‘we’) by a third-party provider (‘Everest Fortune Group’). Please be reminded that you are solely responsible for the trading decisions on your account. There is a very high degree of risk involved in trading. Any information and/or content is intended entirely for research, educational and informational purposes only and does not constitute investment or consultation advice or investment strategy. The information is not tailored to the investment needs of any specific person and therefore does not involve a consideration of any of the investment objectives, financial situation or needs of any viewer that may receive it. Kindly also note that past performance is not a reliable indicator of future results. Actual results may differ materially from those anticipated in forward-looking or past performance statements. We assume no liability as to the accuracy or completeness of any of the information and/or content provided herein and the Company cannot be held responsible for any omission, mistake nor for any loss or damage including without limitation to any loss of profit which may arise from reliance on any information supplied by Everest Fortune Group.
Stop loss: 0.6529
Why we like it:
There is a pullback support level.
Take profit: 0.6682
Why we like it:
There is a swing high resistance.

AUDUSD: Momentum Picking UpKey observations
Daily Timeframe:
Price holds above EMA20 and bullish bar indicates potential upside momentum
EMA20 remains above EMA60 to technically indicate uptrend
H1 Timeframe:
Price cross above DTL to indicate upside momentum
Price also crossing above EMA20 to indicate uptrend resumption

Strong bullish idea audusdLook more bullish
Trading in a strong inner buy channel
Wait to 1st bullish and then drop towards our long term target

AUDUSDAUDUSD IS LOOKING LONG AND THE FOLLOWING DATAS WE BACK MY CLAIMS.
The current Governor of the Reserve Bank of Australia (RBA) is Michele Bullock,
AU10Y=4.34-4.389% CLOSE OF FRIDAY
RBA RATE =3.60%
AUDUSD MARKET CLOSE EXCHANGE RATE =0.66022
The current Chair of the Federal Reserve is Jerome Powell.
He has served as Chair since February 2018 and is expected to lead through at least mid-2026. Powell has been focused on balancing inflation control with economic growth amid evolving global conditions.
the US 10-year Treasury yield is approximately 4.121%.
This yield reflects market expectations for future inflation, economic growth, and Federal Reserve monetary policy.
Current Federal Funds Rate
The Federal Reserve’s target range for the federal funds rate as of September 2025
FFR= 4.00% - 4.25%.
The Fed cut rates by 25 basis points in September 2025, marking the first easing since late 2024, with markets expecting possible additional cuts before year-end.
The interest rate differential between Australia and the United States plays a significant role in the AUD/USD exchange rate and is closely related to the principles of Uncovered Interest Parity (UIP), which suggests that currencies with higher interest rates should depreciate over time relative to currencies with lower interest rates, aligning expectations with actual movements.
Current Interest Rate Differential
The Reserve Bank of Australia (RBA) maintains a cash rate of approximately 3.6%
The Federal Reserve (Fed) has a target rate of about 4.0% to 4.25%
The interest rate differential is roughly -0.4% to -0.65%, indicating that the U.S. rates are slightly higher than Australia's.
UIP Context for AUD/USD
According to UIP, the Australian dollar (AUD) should depreciate against the USD over time due to the higher U.S. interest rates, assuming risk neutrality.
Despite this, the AUD has been relatively resilient, trading near 0.66020 close of market on The interest rate differential between Australia and the United States plays a significant role in the AUD/USD exchange rate and is closely related to the principles of Uncovered Interest Parity (UIP), which suggests that currencies with higher interest rates should depreciate over time relative to currencies with lower interest rates, aligning expectations with actual movements.
Market Dynamics
The interest rate differential influences carry trade strategies, where traders borrow in the lower-yielding currency (JPY, EUR) and invest in higher-yielding currencies (AUD, USD).
Global risk appetite, economic data, and central bank signals can suppress or amplify pure UIP effects, which often do not fully materialize in the short term.
the current economic outlook will give AUD a long advantage
the dxy is down and us10y underperforms .
#AUDUSD #AU10Y #US10Y #DXY

AUDUSD is still on the uptrendAU on the 4H TF has tested the 0.6570 price level with a week. based on technicals price will come back to retest the 0.6570 price level before heading upwards. This retest completes the second shoulder in the head and shoulder pattern. in the week ahead we are looking for a buy based on technicals.

AUDUSDBroke weekly resistance zone around 0.65700. Made a retest and looks to be forming an inverse head and shoulder visible on the H4 with 3rd touch on daily TF support trendline. Need to have a clean breakout above 0.66200 with a possible retest to push higher. Looking to swing to next daily resistance around 0.69000.

AUDUSD | Bearish drop offThe price has reacted off our sell entry and could drop to our take profit.

AUDUSDAudusd has been dancing around this for sometime
But I still think we will see further downward movement
This week has been a slow market week.
#audusd

AUDUSDBearish structure on the daily chart
We lower the timeframe and look for a change in structure
TP at 1:3.5

AUDUSD LongAUDUSD H&S formation on the H4/Daily timeframe.
W bottom formation on the H1 timeframe.
D1 Trendline break and retest near the 61.8 fib level.
Target at 1.27 fib extension level. Which is near the Daily supply zone.
RR 1:8.
Be careful as there is NFP news this NY session.

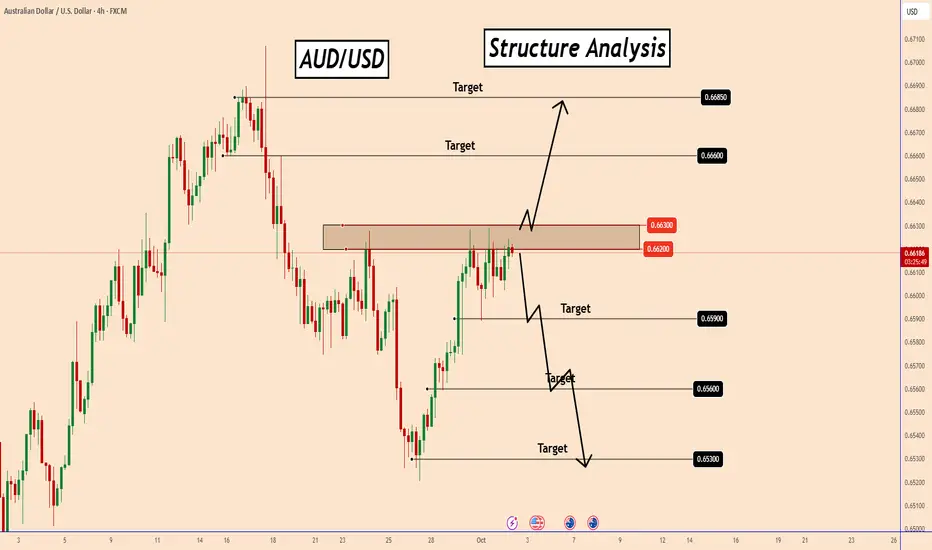
AUDUSD: Structure AnalysisAUDUSD: Structure Analysis
At the moment, AUDUSD is testing a strong structure area which can push the price in both directions. We need to be careful because this is a structure of high importance for the future direction of the price.
Bearish scenario:
If the price stays below this structure area 0.6620 - 0.6630, it should decrease to 0.5690; 0.6560 and maybe to 0.6530 where it was on September 26.
Bullish scenario:
If the price crosses the structure area 0.6620 - 0.6630, then it should increase further as the bullish scenario is showing 0.6660 and 0.6685.
You may focus on the scenario you want to trade.
You may find more details in the chart!
Thank you and Good Luck!
❤️PS: Please support with a like or comment if you find this analysis useful for your trading day❤️
uptrendIt is expected that the trend change will take place within the current support range and we will witness the start of the uptrend. A break of the resistance trend line will be a confirmation of the uptrend.

AUDUSD Daily Forecast -Q4 | W40 | D3 | Y25|
📅 Q4 | W40 | D3 | Y25|
📊 AUDUSD Daily Forecast
🔍 Analysis Approach:
I’m applying Smart Money Concepts, focusing on:
Identifying Points of Interest on the Higher Time Frames (HTFs) 🕰️
Using those POIs to define a clear trading range 📐
Refining those zones on Lower Time Frames (LTFs) 🔎
Waiting for a Break of Structure (BoS) for confirmation ✅
This method allows me to stay precise, disciplined, and aligned with the market narrative, rather than chasing price.
💡 My Motto:
"Capital management, discipline, and consistency in your trading edge."
A positive risk-to-reward ratio, paired with a high win rate, is the backbone of any solid trading plan 📈🔐
⚠️ Losses?
They’re part of the mathematical game of trading 🎲
They don’t define you — they’re necessary, they happen, and we move forward 📊➡️
🙏 I appreciate you taking the time to review my Daily Forecast.
Stay sharp, stay consistent, and protect your capital
— FRNGT 🚀
FX:AUDUSD

AUD/USD Inverse Head and ShoulderLooking at the 4H timeframe the Aussie is setting up a possible inverse head and shoulder pattern. The neckline would be around .6628. Watch for a break there to retest the highs.

AUDUSD Daily Forecast - Q4 | W40 | D1 | Y25|📅 Q4 | W40 | D1 | Y25|
📊 AUDUSD Daily Forecast
🔍 Analysis Approach:
I’m applying Smart Money Concepts, focusing on:
Identifying Points of Interest on the Higher Time Frames (HTFs) 🕰️
Using those POIs to define a clear trading range 📐
Refining those zones on Lower Time Frames (LTFs) 🔎
Waiting for a Break of Structure (BoS) for confirmation ✅
This method allows me to stay precise, disciplined, and aligned with the market narrative, rather than chasing price.
💡 My Motto:
"Capital management, discipline, and consistency in your trading edge."
A positive risk-to-reward ratio, paired with a high win rate, is the backbone of any solid trading plan 📈🔐
⚠️ Losses?
They’re part of the mathematical game of trading 🎲
They don’t define you — they’re necessary, they happen, and we move forward 📊➡️
🙏 I appreciate you taking the time to review my Daily Forecast.
Stay sharp, stay consistent, and protect your capital
— FRNGT 🚀
FX:AUDUSD

AUDUSD Will Explode! BUY!
My dear subscribers,
My technical analysis for AUDUSD is below:
The price is coiling around a solid key level - 0.6592
Bias - Bullish
Technical Indicators: Pivot Points High anticipates a potential price reversal.
Super trend shows a clear buy, giving a perfect indicators' convergence.
Goal - 0.6603
My Stop Loss - 0.6585
About Used Indicators:
By the very nature of the supertrend indicator, it offers firm support and resistance levels for traders to enter and exit trades. Additionally, it also provides signals for setting stop losses
Disclosure: I am part of Trade Nation's Influencer program and receive a monthly fee for using their TradingView charts in my analysis.
———————————
WISH YOU ALL LUCK

AUDUSD Technical & Order Flow AnalysisOur analysis is based on a multi-timeframe top-down approach and fundamental analysis.
Based on our assessment, the price is expected to return to the monthly level.
DISCLAIMER: This analysis may change at any time without notice and is solely intended to assist traders in making independent investment decisions. Please note that this is a prediction, and I have no obligation to act on it, nor should you.
Please support our analysis with a boost or comment!

AUD/USD could bounce from THIS support levelThe AUD/USD is one of my favourite long plays right now owing to a risk on rally, rallying metal prices, a more hawkish than expected RBA, and the US dollar being under pressure across the board.
Dip-buyers will need to step in around current levels near 0.6580 to maintain control. This level was support/resistance in the past, and my expectations are that it will likely hold as support.
Resistance is clear to see: at 0.6625. If this level gets cleared, then we could well see a continuation towards and above last month's high of 0.6707
By Fawad Razaqzada, market analyst with FOREX.com

AUDUSD BullishAfter exiting a correction, the first impulse (Wave 1) appears. I expect a retracement of at least 50% of the Fibonacci.

AUD/USD SENDS CLEAR BEARISH SIGNALS|SHORT
Hello, Friends!
AUD/USD pair is trading in a local downtrend which know by looking at the previous 1W candle which is red. On the 9H timeframe the pair is going up. The pair is overbought because the price is close to the upper band of the BB indicator. So we are looking to sell the pair with the upper BB line acting as resistance. The next target is 0.652 area.
Disclosure: I am part of Trade Nation's Influencer program and receive a monthly fee for using their TradingView charts in my analysis.
✅LIKE AND COMMENT MY IDEAS✅

AUDUSD Will Go Higher From Support! Buy!
Here is our detailed technical review for AUDUSD.
Time Frame: 4h
Current Trend: Bullish
Sentiment: Oversold (based on 7-period RSI)
Forecast: Bullish
The market is testing a major horizontal structure 0.661.
Taking into consideration the structure & trend analysis, I believe that the market will reach 0.666 level soon.
P.S
We determine oversold/overbought condition with RSI indicator.
When it drops below 30 - the market is considered to be oversold.
When it bounces above 70 - the market is considered to be overbought.
Like and subscribe and comment my ideas if you enjoy them!
