Trade Setup: AUD/USDType: Short
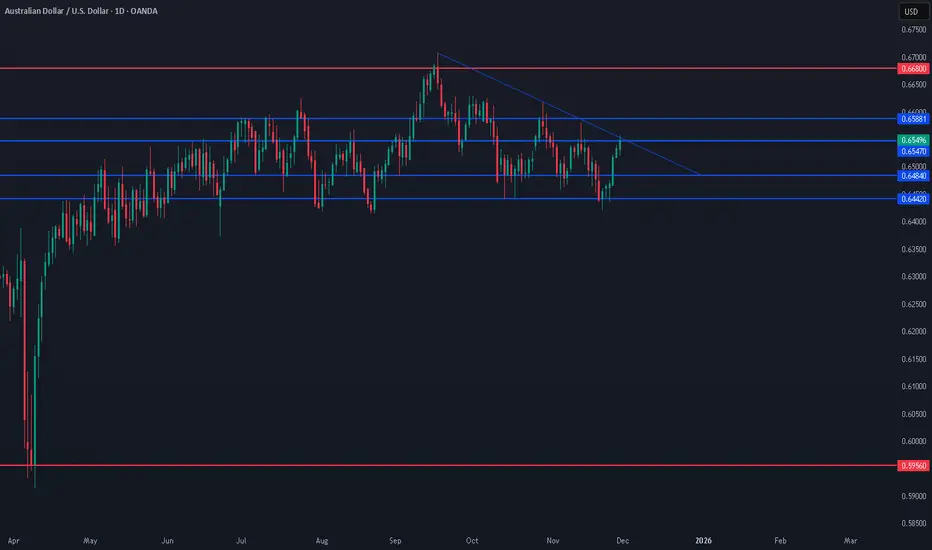
Entry: 0.65194
Stop-Loss: 0.66747
Target: 0.62088
Risk-Reward: 2:1
Rationale: Tracking this trade with proper risk management.
Trade ideas

RBA Turns Hawkish, USD Weakens – AUDUSD Surges Without Brakes!If I had to choose one pair that’s “waking up” thanks to the news flow, it would definitely be AUDUSD. The RBA maintains a clearly hawkish tone , Australian inflation remains high, and the economy continues to recover well. Meanwhile, across the Pacific, the market is increasingly expecting the Fed to begin cutting rates soon . The result? A weaker USD , while the Australian dollar attracts more capital — the perfect “tailwind environment” for a bullish trend.
On the 3H chart, AUDUSD is moving smoothly inside an ascending wedge , forming higher highs and higher lows, with price holding firmly above the Ichimoku cloud — a classic structure of a strong bullish market. After a brief shakeout at the lower boundary, buyers stepped in aggressively, engulfing the previous bearish candle and keeping price close to the upper edge of the wedge.
My preferred scenario: price may make a small pullback around 0.6570 to gather momentum, then continue pushing toward the target zone at 0.6630 — aligned with the upper boundary of the wedge and the next resistance area ahead. As long as the fundamental backdrop continues to favor AUD and the USD fails to regain strength, the most reasonable strategy is to buy with the trend , taking advantage of shallow pullbacks rather than trying to fight the rising wave of AUDUSD.

check the trend The price is expected to consolidate above the support area and then the start of an uptrend is likely.
If the price breaks through the support area, a continuation of the correction is likely.

AUD-USD Bullish Bias! Buy!
Hello,Traders!
AUDUSD pair reclaimed the demand zone after sweeping sell-side liquidity, shifting structure bullish. If momentum holds, price may target the premium inefficiency above as buy-side liquidity gets drawn. Time Frame 3H.
Buy!
Comment and subscribe to help us grow!
Check out other forecasts below too!
Disclosure: I am part of Trade Nation's Influencer program and receive a monthly fee for using their TradingView charts in my analysis.

aud ready for sellAfter the price chart hits the 4-hour trendline and the price reverses, it provides an opportunity to sell with a low risk and perhaps a drop to the lower trendline in the 4-hour timeframe. If the previous low is broken, you can sell.

AUD/USD Breakout Above Trendline – Bullish Momentum BuildingMarket Structure:
Price has been trading within a descending structure, respecting a downward trendline resistance. Recently, the pair has broken above this trendline, signaling a potential shift in short-term momentum from bearish to bullish.
Key Levels:
Trendline Resistance (Broken): Price has successfully closed above the declining trendline, indicating a possible breakout.
Horizontal Support Zone (Purple Region): This zone has been acting as a strong demand area, with multiple rejections showing buyers defending this level.
Breakout Confirmation:
After the breakout, price is currently retesting the trendline and showing signs of holding above it. A successful retest followed by bullish momentum would strengthen the probability of continued upward movement.
Bullish Scenario:
If buyers maintain control above the breakout level, the market is likely to form a higher low and push upward toward the next target zone around 0.65600–0.65650. This aligns with the projected bullish path illustrated on the chart.
Bias:
Bullish, as long as price remains above the retested trendline and the horizontal support zone.
Invalidation:
A strong move back below the trendline and into the support zone would invalidate the breakout and potentially resume bearish pressure.

AUDUSD formed a H&S pattern on 1H TF - likely a bullish reversa?AUDUSD on 1H TF showing a H&S pattern and is likely to have a reversal of trend at the break of support zone

AUDUSDDo we have this AUDUSD in the bag?
You sure know we do.
Still some technical analysis along the trend done to get this trade.
DrElder_

AUDUSD is bearish in for a while!AUDUSD is bearish in 1-5min timeframe having met necessary conditions as explained in the image above.
Conditions:
1. Create a liquidity sweep on the highs and only then;
2. Break of structure on the swing low.

Waiting for the Break: High-Probability Trade Setup”Price action is beginning to lean bullish across the board, but we’re running head-first into a major descending trendline on the daily chart. That level hasn’t given way lightly in the past, so I’m not interested in forcing longs into a wall.
What I do expect is a healthy retracement—something that shakes out weak hands and reloads the larger move—potentially down into the 0.6500 zone. That area has the structure to generate real momentum if buyers are serious about violating the trendline.
Jumping long right here carries more risk than reward. The cleaner play, in my view, is to hunt tactical shorts into the pullback, then reassess for a confirmed bullish continuation once the market shows its hand.
Bigger picture: I’m still bullish. I just prefer to let the market breathe before taking the high-probability entry.
AUDUSD Sell Setup 4H Chart
AUD/USD on the H4 timeframe is offering a potential short opportunity, but only with confirmation. The RSI being overbought aligns with the expectation of a near-term pullback, yet the decisive element will be a bearish engulfing candle at the channel resistance.
Until that appears, this remains a watch-and-wait environment, not an early entry zone. Market Structure:
Channel-Bound Price Action
On the 4-hour timeframe, AUD/USD has been respecting a clearly defined descending channel. Price is currently trading near the upper boundary, which typically acts as dynamic resistance.
Key implications:
The closer the price is to the top of the channel, the higher the probability of a corrective pullback. However, channels often break when momentum and fundamentals align, so resistance must be confirmed by price rejection — not assumed.
Momentum Conditions: RSI Overbought
RSI on the H4 chart has moved into overbought territory.
This signals short-term exhaustion in bullish momentum. Increased likelihood of a corrective move lower. However, RSI becoming overbought in an uptrend can indicate strength, not necessarily a reversal.
3. Candlestick Confirmation: Bearish Engulfing as Key Trigger
Given the context, a bearish engulfing candle at channel resistance offers exactly the kind of confirmation needed before entering a short position. So we'll wait for that trigger.
Targets
First target (T1): Middle Channel midline.
Second target (T2): Opposite boundary of the channel.

AUDUSD Is Bullish! Buy!
Here is our detailed technical review for AUDUSD.
Time Frame: 9h
Current Trend: Bullish
Sentiment: Oversold (based on 7-period RSI)
Forecast: Bullish
The market is testing a major horizontal structure 0.654.
Taking into consideration the structure & trend analysis, I believe that the market will reach 0.658 level soon.
P.S
Please, note that an oversold/overbought condition can last for a long time, and therefore being oversold/overbought doesn't mean a price rally will come soon, or at all.
Like and subscribe and comment my ideas if you enjoy them!

AUDUSD FRGNT Daily Forecast - Q4 | W48| D26 | Y25 |📅 Q4 | W48| D26 | Y25 |
📊 AUDUSD FRGNT Daily Forecast
🔍 Analysis Approach:
I’m applying Smart Money Concepts, focusing on:
Identifying Points of Interest on the Higher Time Frames (HTFs) 🕰️
Using those POIs to define a clear trading range 📐
Refining those zones on Lower Time Frames (LTFs) 🔎
Waiting for a Break of Structure (BoS) for confirmation ✅
This method allows me to stay precise, disciplined, and aligned with the market narrative, rather than chasing price.
💡 My Motto:
"Capital management, discipline, and consistency in your trading edge."
A positive risk-to-reward ratio, paired with a high win rate, is the backbone of any solid trading plan 📈🔐
⚠️ Losses?
They’re part of the mathematical game of trading 🎲
They don’t define you — they’re necessary, they happen, and we move forward 📊➡️
🙏 I appreciate you taking the time to review my Daily Forecast.
Stay sharp, stay consistent, and protect your capital
— FRNGT 🚀
FX:AUDUSD

AUDUSD FRGNT Daily Forecast - Q4 | W49| D3| Y25 |📅 Q4 | W49| D3| Y25 |
📊 AUDUSD FRGNT Daily Forecast
🔍 Analysis Approach:
I’m applying Smart Money Concepts, focusing on:
Identifying Points of Interest on the Higher Time Frames (HTFs) 🕰️
Using those POIs to define a clear trading range 📐
Refining those zones on Lower Time Frames (LTFs) 🔎
Waiting for a Break of Structure (BoS) for confirmation ✅
This method allows me to stay precise, disciplined, and aligned with the market narrative, rather than chasing price.
💡 My Motto:
"Capital management, discipline, and consistency in your trading edge."
A positive risk-to-reward ratio, paired with a high win rate, is the backbone of any solid trading plan 📈🔐
⚠️ Losses?
They’re part of the mathematical game of trading 🎲
They don’t define you — they’re necessary, they happen, and we move forward 📊➡️
🙏 I appreciate you taking the time to review my Daily Forecast.
Stay sharp, stay consistent, and protect your capital
— FRNGT 🚀
FX:AUDUSD

sell AudusdOur current bias on AUD/USD remains bearish.
Price is showing clear signs of weakness, with momentum favoring the downside. As long as the market continues to respect the current lower-high structure, we expect further selling pressure and the possibility of a deeper retracement toward lower support levels.

AUDUSD -Order block has been tappedAUDUSD – 25/11/2025
Inducement taken
FVG formed at 9 AM, aligned with a clean H4 wick
Head and Shoulders pattern present with 3-pin structure
Price reacted around the 78.6% Fibonacci retracement


AUDUSD Bearish below 0.6500 resistanceThe AUDUSD currency pair continues to display a bearish outlook, in line with the prevailing downward trend. Recent price action suggests a corrective pullback, potentially setting up for another move lower if resistance holds.
Key Level: 0.6500
This zone, previously a consolidation area, now acts as a significant resistance level.
Bearish Scenario (rejection at 0.6500):
A failed test and rejection at 0.6500 would likely resume the bearish momentum.
Downside targets include:
0.6425 – Initial support
0.6400 – Intermediate support
0.6380 – Longer-term support level
Bullish Scenario (breakout above 0.6500):
A confirmed breakout and daily close above 0.6500 would invalidate the bearish setup.
In that case, potential upside resistance levels are:
0.6520 – First resistance
0.6550 – Further upside target
Conclusion
AUDUSD remains under bearish pressure, with the 0.6500 level acting as a key inflection point. As long as price remains below this level, the bias favours further downside. Traders should watch for price confirmation around that level to assess the next move.
This communication is for informational purposes only and should not be viewed as any form of recommendation as to a particular course of action or as investment advice. It is not intended as an offer or solicitation for the purchase or sale of any financial instrument or as an official confirmation of any transaction. Opinions, estimates and assumptions expressed herein are made as of the date of this communication and are subject to change without notice. This communication has been prepared based upon information, including market prices, data and other information, believed to be reliable; however, Trade Nation does not warrant its completeness or accuracy. All market prices and market data contained in or attached to this communication are indicative and subject to change without notice.

+80...The Aussie Dollar hasn't fulfilled bearish objectives yetAUDUSD hasn't taken that strong draw on liquidity which is the H4 Iow that shows many rejections candles. Until that happens, I'm still bearish on the Aussie Dollar.
Our first setup gave us 80 pips but hopefully, this new setup goes straight to TP.

AUD/USD Market Outlook (Updated With 0.64600 Break Level)Previous Analysis Summary:
In the last update, we highlighted that AUD/USD was maintaining strength inside a higher-timeframe demand zone, with buyers consistently defending the structure. The pair was forming an accumulation phase, and we noted that a higher-timeframe breakout was required to shift momentum decisively to the upside. Until that confirmation, AUD/USD was expected to remain in a controlled range with a bullish lean.
Current Analysis:
AUD/USD continues to hold structurally strong, and the key breakout level is now 0.64600 .
A clean break and rejection above 0.64600 would confirm bullish intent, opening the next liquidity pools on the higher-timeframe charts.
On the U.S. side , the dollar is starting to soften as markets price a higher likelihood of a Fed rate cut in the coming month . Recent U.S. data has shown signs of cooling, and commentary from officials has tempered expectations of further tightening. This supports the AUD/USD upside scenario.
A major macro layer comes from Japan and the long-standing BOJ carry-trade dynamic .
For years, the BOJ kept funding rates around 0% , allowing global investors to borrow yen at extremely low cost and channel that money into U.S. Treasuries , taking advantage of the yield spread. These flows consistently supported the USD.
Now, with the BOJ signaling a gradual move away from its ultra-easy, near-0% funding environment , conditions may force partial unwinding of these carry positions . As cheap yen liquidity tightens:
* Investors reduce U.S. Treasury exposure
* USD demand drops
* Funds get repatriated into JPY
* USD weakens structurally
Combined with a dovish Fed backdrop, this creates a multi-layered catalyst for broader USD softness.
Overall AUD/USD remains constructive:
* Technical structure is solid and price is holding demand
* Fed tone is more dovish
* BOJ carry-trade unwind adds downward pressure on USD
* A break above 0.64600 is the key confirmation needed for bullish continuation toward higher liquidity targets

21.11.25 Morning ForecastPairs on Watch -
FX:AUDUSD
FX:EURUSD
FX:CADJPY
FX:GBPJPY
A short overview of the instruments I am looking at for today, multi-timeframe analysis down to what I will be looking at for an entry. Enjoy!

AUDUSD: Support Zone, Anticipate Buy!..Hello everyone,
AUDUSD is presently at the support area, as we can clearly spot in the formation. the pair have been moving on horizontal range of support and resistance in the bigger time frame, giving both the buyers and sellers chances to take place in the market.
The probability of buy is high, in regards to the structure zones.
Key points;
A confirmed reversal above the support, would set off upward rise to 0.6540 as the potential target.
Thanks for reading.

AUDUSD bullish ideaThe price is near the weekly low and I think the probability is high that it will reverse.
