21.11.25 Morning ForecastPairs on Watch -
FX:AUDUSD
FX:EURUSD
FX:CADJPY
FX:GBPJPY
A short overview of the instruments I am looking at for today, multi-timeframe analysis down to what I will be looking at for an entry. Enjoy!
Trade ideas

AUDUSD bullish ideaThe price is near the weekly low and I think the probability is high that it will reverse.

AUDUSD: Support Zone, Anticipate Buy!..Hello everyone,
AUDUSD is presently at the support area, as we can clearly spot in the formation. the pair have been moving on horizontal range of support and resistance in the bigger time frame, giving both the buyers and sellers chances to take place in the market.
The probability of buy is high, in regards to the structure zones.
Key points;
A confirmed reversal above the support, would set off upward rise to 0.6540 as the potential target.
Thanks for reading.

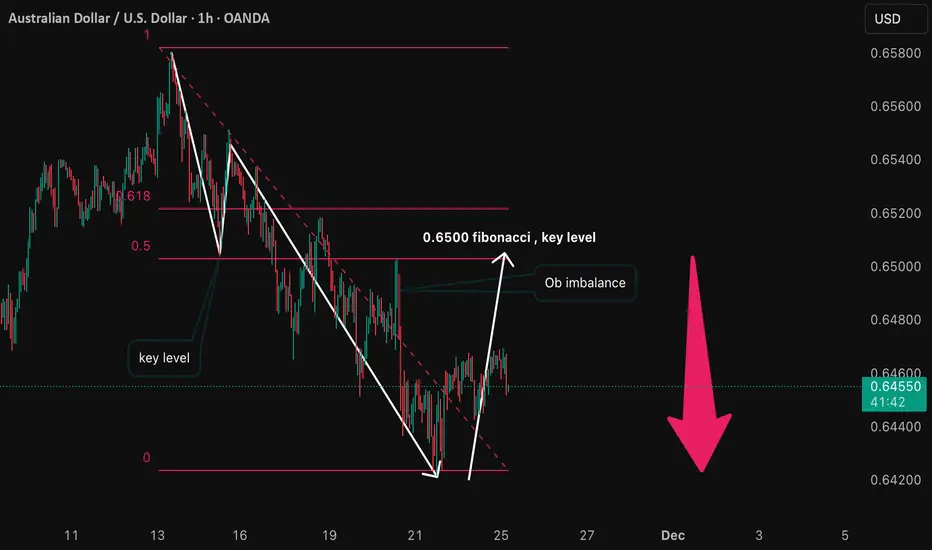
AUDUSD Bearish below 0.6500 resistanceThe AUDUSD currency pair continues to display a bearish outlook, in line with the prevailing downward trend. Recent price action suggests a corrective pullback, potentially setting up for another move lower if resistance holds.
Key Level: 0.6500
This zone, previously a consolidation area, now acts as a significant resistance level.
Bearish Scenario (rejection at 0.6500):
A failed test and rejection at 0.6500 would likely resume the bearish momentum.
Downside targets include:
0.6425 – Initial support
0.6400 – Intermediate support
0.6380 – Longer-term support level
Bullish Scenario (breakout above 0.6500):
A confirmed breakout and daily close above 0.6500 would invalidate the bearish setup.
In that case, potential upside resistance levels are:
0.6520 – First resistance
0.6550 – Further upside target
Conclusion
AUDUSD remains under bearish pressure, with the 0.6500 level acting as a key inflection point. As long as price remains below this level, the bias favours further downside. Traders should watch for price confirmation around that level to assess the next move.
This communication is for informational purposes only and should not be viewed as any form of recommendation as to a particular course of action or as investment advice. It is not intended as an offer or solicitation for the purchase or sale of any financial instrument or as an official confirmation of any transaction. Opinions, estimates and assumptions expressed herein are made as of the date of this communication and are subject to change without notice. This communication has been prepared based upon information, including market prices, data and other information, believed to be reliable; however, Trade Nation does not warrant its completeness or accuracy. All market prices and market data contained in or attached to this communication are indicative and subject to change without notice.


AUDUSD Bullish MoveAUDUSD looks bullish this Tuesday. A falling channel is forming on the 1hr and m15 chart. Price could bounce from 0.6444 towards 0.649, a 500 pip move.

AUDUSD H1 | Bearish Reaction Off Key ResistanceMomentum: Bearish
Price is currently within the bearish ichimoku cloud.
Sell entry: 0.64842
- Strong Pullback resistance
- 78.6% Fib retracement
- 161.8% Fib extension
- Fair Value Gap
Stop Loss: 0.65060
- Swing high resistance
Take Profit: 0.64514
- Overlap support
High Risk Investment Warning
Stratos Markets Limited (tradu.com/uk ), Stratos Europe Ltd (tradu.com/eu ):
CFDs are complex instruments and come with a high risk of losing money rapidly due to leverage. 70% of retail investor accounts lose money when trading CFDs with this provider. You should consider whether you understand how CFDs work and whether you can afford to take the high risk of losing your money.
Stratos Global LLC (tradu.com/en ): Losses can exceed deposits.
Please be advised that the information presented on TradingView is provided to Tradu (‘Company’, ‘we’) by a third-party provider (‘TFA Global Pte Ltd’). Please be reminded that you are solely responsible for the trading decisions on your account. Any information and/or content is intended entirely for research, educational and informational purposes only and does not constitute investment or consultation advice or investment strategy. The information is not tailored to the investment needs of any specific person and therefore does not involve a consideration of any of the investment objectives, financial situation or needs of any viewer that may receive it. Past performance is not a reliable indicator of future results. Actual results may differ materially from those anticipated in forward-looking or past performance statements. We assume no liability as to the accuracy or completeness of any of the information and/or content provided herein and the Company cannot be held responsible for any omission, mistake nor for any loss or damage including without limitation to any loss of profit which may arise from reliance on any information supplied by TFA Global Pte Ltd.

AUD/USD Fibonacci Overlap method 0.6494 AUD/USD – Analyzed using the Fibonacci Overlap method.
Price pulled back into the 0.6494 confluence area and then reacted lower, continuing its bearish movement.
AUDUSD Short I am shorting AUDUSD, and the reasons are
Following the trend, good to enter the wave.
Creating channel to break the October lows.
Bearish hammer on daily chart.

AUDUSD LONGAfter a BOS on 4 h create a new LL
we wait for BOS on 1 H create a HH
After take a BUY trade on DEMAND create on 15 MN

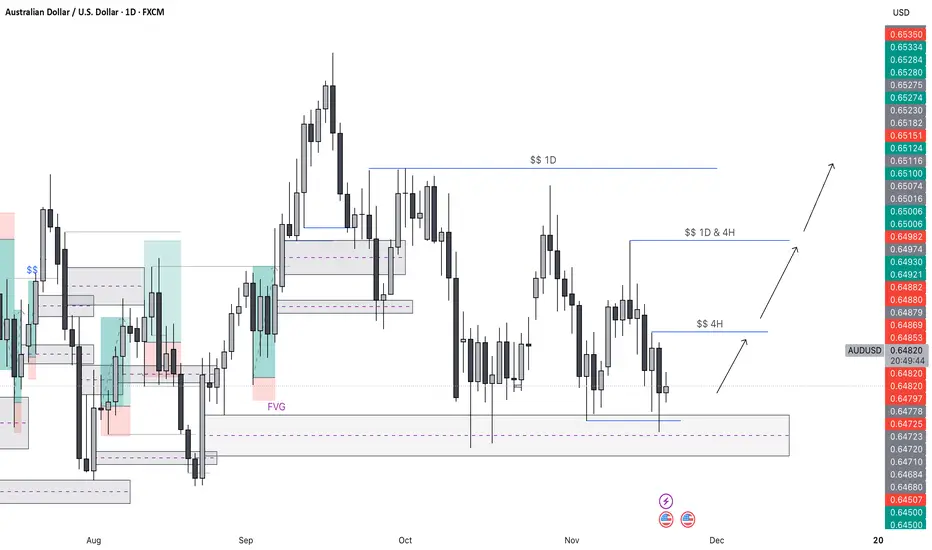
AUD/USD - Market Structure Outlook with Key Higher-Timeframe This chart highlights a multi-timeframe liquidity framework, combining 1D and 4H supply/demand zones to outline potential price reactions. Current price action is consolidating within a higher-timeframe demand zone, suggesting the possibility of a bullish response. The marked 4H and 1D liquidity pools above price represent key upside targets if the market confirms a reversal from this zone. Fair Value Gaps (FVGs), imbalances, and structural breaks provide additional confluence for a potential shift in order flow. Arrows illustrate the projected path toward liquidity objectives on both the 4H and 1D levels.
Macro-Fundamental Context:
Recent labor market data has shown a rise in unemployment during August, indicating early signs of cooling conditions. The latest FOMC comments reinforce that policymakers are becoming increasingly sensitive to any further softening in employment. This raises the possibility of a more cautious or even accommodative stance if data continues to weaken. Today’s September release is expected to come in negative as well, and if confirmed, it could further pressure the Fed’s tightening narrative.
Alongside this, DXY has been losing bullish momentum, reflecting hesitation from dollar buyers as rate expectations begin to shift. A weakening dollar often aligns with risk-on flows across major markets, which could support the bullish reaction anticipated in the technical setup. If DXY continues to soften, it may add confluence to a potential upward move toward the higher-timeframe liquidity pools highlighted on the chart.
AUD-USD Correction Ahead! Sell!
Hello, Traders!
AUDUSD swept the lows beneath the demand boundary, grabbing sell-side liquidity before shifting order flow. A corrective pullback into the mitigation zone may fuel a continuation toward the target imbalance. Time Frame 3H.
Sell!
Comment and subscribe to help us grow!
Check out other forecasts below too!
Disclosure: I am part of Trade Nation's Influencer program and receive a monthly fee for using their TradingView charts in my analysis.

Could we see a bearish reversal from here?Aussie (AUD/USD) is falling towards the pivot and could bounce to the 1st resistance.
Pivot: 0.6384
1st Support: 0.6275
1st Resistance: 0.6540
Disclaimer:
The opinions given above constitute general market commentary and do not constitute the opinion or advice of IC Markets or any form of personal or investment advice.
Any opinions, news, research, analyses, prices, other information, or links to third-party sites contained on this website are provided on an "as-is" basis, are intended to be informative only, and are not advice, a recommendation, research, a record of our trading prices, an offer of, or solicitation for, a transaction in any financial instrument and thus should not be treated as such. The information provided does not involve any specific investment objectives, financial situation, or needs of any specific person who may receive it. Please be aware that past performance is not a reliable indicator of future performance and/or results. Past performance or forward-looking scenarios based upon the reasonable beliefs of the third-party provider are not a guarantee of future performance. Actual results may differ materially from those anticipated in forward-looking or past performance statements. IC Markets makes no representation or warranty and assumes no liability as to the accuracy or completeness of the information provided, nor any loss arising from any investment based on a recommendation, forecast, or any information supplied by any third party.

Wait…are we bullish?Hello traders! Here’s a technical chart breakdown for AUD/USD based on current structure, trend, momentum, and supportive macro data. (Note: this is analysis, not a guarantee. Always manage risk.)
⸻
Market Overview
Going into the weekly close, AUD/USD created a new November low on Thursday, but price recovered strongly and closed near Friday’s highs — a sign of bullish intention.
If this momentum continues, we’re looking at:
• Intraday potential: ~40 pips
• Swing potential: ~100 pips, if price breaks out of the current downward channel
Our first target aligns with previous support from earlier this month, while the secondary swing target sits at a key higher-timeframe resistance level that price may revisit.
⸻
📌 Trade Idea (Long AUD/USD)
• Entry: 0.64450
• Target 1: 0.64850 (+40 pips)
• Target 2: 0.65250 (+80 pips)
• Stop Loss: 0.64050 (–40 pips)
Risk-to-Reward
• To T1: 1:1
• To T2: 1:2.5
⸻
📈 Technical Breakdown
Structure
There is a large expanding wedge forming (not shown on the chart), which can act as a bullish continuation pattern if price breaks to the upside. This would support a larger measured move.
Momentum
• RSI: Currently recovering from oversold conditions, supporting bullish continuation.
• On the daily timeframe, RSI has been trending higher without reaching overbought zones — leaving room for further upside.
Invalidation
• A break below 0.64050 (our stop loss area) would invalidate the bullish structure and indicate a bearish shift.
⸻
📰 Fundamental Support: Australia Labor Market
Australia’s latest labour data came in stronger than expected, adding confidence to the bullish bias:
• Employment increased by +42,000 (doubled expectations)
• Full-time jobs rose
• Unemployment rate fell by 0.2%
Stronger labour numbers reduce the odds of near-term RBA rate cuts and support AUD strength.
⸻
📅 What’s Next?
We’ll be monitoring price action next week for additional confirmations and potential long setups. A breakout above the channel + sustained bullish momentum would increase the likelihood of reaching T1 and T2.

Is the market underestimating the AUDUSD rate differential?The odds for an interest rate cut by the US Federal Reserve on December 18th have seen a dramatic increase, jumping from approximately 40% to 70% in a major market reversal.
This sharp revision in market expectations is driven by mounting evidence of a slowing U.S. economy. Goldman Sachs Chief Economist Jan Hatzius cautioned that the U.S. economy may lose momentum faster than current projections anticipate. And today we got data from payroll processing firm ADP showing private companies lost an average of 13,500 jobs per week over the last four weeks.
Continued weak economic data is expected to keep weighing on the U.S. dollar. In contrast, the Reserve Bank of Australia is expected to keep a tighter stance relative to peers, and I don't know if markets are entirely pricing in a differential, with the recent up trend of the AUDUSD appearing to taper off.

AUDUSD H4 | Bearish Reversal Off 38.2% Fibonacci ResistanceMomentum: Bearish
Price is retracing upward toward the sell entry, which sits at a pullback resistance level that aligns well with the 38.2% Fibonacci retracement.
Sell Entry: 0.6475
Pullback resistance
38.2% Fibonacci retracement
Stop Loss: 0.6516
Overlap resistance
61.8% Fibonacci retracement
Take Profit: 0.6389
Swing low support
61.8% Fibonacci extension
High Risk Investment Warning
Stratos Markets Limited (tradu.com ), Stratos Europe Ltd (tradu.com ):
CFDs are complex instruments and come with a high risk of losing money rapidly due to leverage. 70% of retail investor accounts lose money when trading CFDs with this provider. You should consider whether you understand how CFDs work and whether you can afford to take the high risk of losing your money.
Stratos Global LLC (tradu.com ): Losses can exceed deposits.
Please be advised that the information presented on TradingView is provided to Tradu (‘Company’, ‘we’) by a third-party provider (‘TFA Global Pte Ltd’). Please be reminded that you are solely responsible for the trading decisions on your account. Any information and/or content is intended entirely for research, educational and informational purposes only and does not constitute investment or consultation advice or investment strategy. The information is not tailored to the investment needs of any specific person and therefore does not involve a consideration of any of the investment objectives, financial situation or needs of any viewer that may receive it. Past performance is not a reliable indicator of future results. Actual results may differ materially from those anticipated in forward-looking or past performance statements. We assume no liability as to the accuracy or completeness of any of the information and/or content provided herein and the Company cannot be held responsible for any omission, mistake nor for any loss or damage including without limitation to any loss of profit which may arise from reliance on any information supplied by TFA Global Pte Ltd.

AUDUSD FRGNT Daily Forecast -Q4 | W48| D25 | Y25 |📅 Q4 | W48| D25 | Y25 |
📊 AUDUSD FRGNT Daily Forecast
🔍 Analysis Approach:
I’m applying Smart Money Concepts, focusing on:
Identifying Points of Interest on the Higher Time Frames (HTFs) 🕰️
Using those POIs to define a clear trading range 📐
Refining those zones on Lower Time Frames (LTFs) 🔎
Waiting for a Break of Structure (BoS) for confirmation ✅
This method allows me to stay precise, disciplined, and aligned with the market narrative, rather than chasing price.
💡 My Motto:
"Capital management, discipline, and consistency in your trading edge."
A positive risk-to-reward ratio, paired with a high win rate, is the backbone of any solid trading plan 📈🔐
⚠️ Losses?
They’re part of the mathematical game of trading 🎲
They don’t define you — they’re necessary, they happen, and we move forward 📊➡️
🙏 I appreciate you taking the time to review my Daily Forecast.
Stay sharp, stay consistent, and protect your capital
— FRNGT 🚀
FX:AUDUSD

AUD/USD Rises from Multi-Month LowsAUD/USD is trading near 0.6465 this Tuesday as the Australian Dollar comes under pressure amid heightened geopolitical tensions in the Asia-Pacific. The Aussie dipped briefly below 0.6450 earlier in the week after comments from Japan’s top diplomatic official suggesting a strong response to a Chinese move over Taiwan triggered a sharp risk-off tone in Asian markets. That risk-off shift ended the modest rebound in the Aussie following last week’s positive PMI prints.
Looking ahead, the key drag on the pair is the lack of follow-through on Australia’s improved manufacturing and services data, while the greenback remains supported even as Fed rate-cut expectations face re-assessment. Unless risk sentiment recovers or Australia delivers a fresh positive surprise, AUD/USD is more likely to drift lower than break higher in the near term.
In the above chart, AUD/USD rates remain in the multi-month range that’s defined price action for the better part of the past seven months; the recent rebound finds the pair moving off of intermediate lows carved out in July and August. Momentum has a slightly bearish tilt, insofar as MACD continues to trend deeper beneath its signal line as each of the 20-day, 50-day, and 100-day exponential moving averages (EMA) sustain a negative slope.

AUDUSD — CLS Daily vs 1H Chart AUDUSD — Daily vs 1H Chart 📈
Price has purged into a key level on both the Weekly and Daily timeframes, then formed a CLS range on the Daily chart.
Once price pulls back into the Daily Gap on the 1H, I’ll look to go long toward the Daily 50% level.
🎯 Target → 0.64695
OANDA:AUDUSD

AUDUSD Short - 25th Nov25AUDUSD Pair shows movement towards 0.65 Resistance Zone , I expect bearish movement once it has entered 0.65 zone.
Expected Entry Price = 0.65000
Expected TP = 0.64700 / 30 PIPS
Risk Management/ SL = 0.65100 / 10 PIPS

Lingrid | AUDUSD Relief Rally Then Downtrend ContinuationFX:AUDUSD perfectly played out my previous trading idea . Price is pulling back toward the mid-range zone after rejecting the descending trendline, confirming that sellers still control the broader structure. The market continues to form lower highs and lower lows inside the downward channel, with the recent compression breakdown reinforcing bearish momentum. If price retests 0.64750 and fails to break above it, continuation toward the 0.64150 support becomes the most likely scenario as the trend resumes. Broader context shows a consistent bearish flow, with corrective rallies repeatedly turning into continuation moves.
⚠️ Risks:
A clean breakout above 0.64750 may invalidate the bearish setup and trigger a deeper correction.
USD weakness or unexpected macro data could disrupt downside continuation.
Failure to maintain momentum along the trendline may lead to sideways consolidation instead of a clean drop.
If this idea resonates with you or you have your own opinion, traders, hit the comments. I’m excited to read your thoughts!

AUDUSD Bearish Bias!
HI,Traders !
#AUDUSD is making a
Retest of the horizontal
Resistance of 0.64759
So as we are locally
Bearish biased we will
Be expecting a further
Bearish move down !
Comment and subscribe to help us grow !
