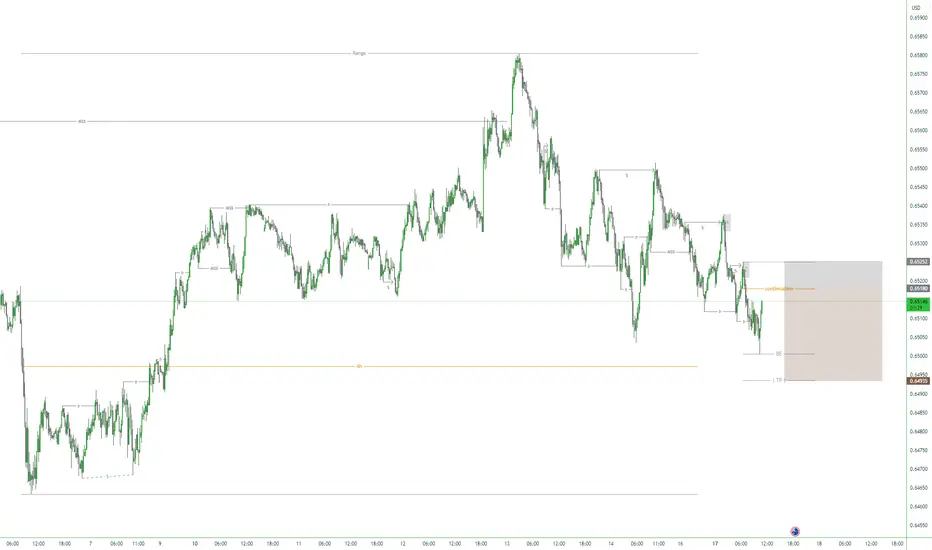
AUSSIE H4 | Heading Into 61.8% Fibonacci ResistanceMomentum: Bearish
The price is rising towards the sell entry which aligns with the 61.8% Fibonacci retracement and al;so trading below the ichimoku cloud.
Sell entry: 0.6451
Pullback resistance
61.8% FIbonacci retracement
Stop loss: 0.6516
Overlap resistance
Slighlty above the 50% Fibonacci retracement
Take profit: 0.6389
Swing low support
161.8% FIbonacci extension
High Risk Investment Warning
Stratos Markets Limited (tradu.com ), Stratos Europe Ltd (tradu.com ):
CFDs are complex instruments and come with a high risk of losing money rapidly due to leverage. 70% of retail investor accounts lose money when trading CFDs with this provider. You should consider whether you understand how CFDs work and whether you can afford to take the high risk of losing your money.
Stratos Global LLC (tradu.com ): Losses can exceed deposits.
Please be advised that the information presented on TradingView is provided to Tradu (‘Company’, ‘we’) by a third-party provider (‘TFA Global Pte Ltd’). Please be reminded that you are solely responsible for the trading decisions on your account. Any information and/or content is intended entirely for research, educational and informational purposes only and does not constitute investment or consultation advice or investment strategy. The information is not tailored to the investment needs of any specific person and therefore does not involve a consideration of any of the investment objectives, financial situation or needs of any viewer that may receive it. Past performance is not a reliable indicator of future results. Actual results may differ materially from those anticipated in forward-looking or past performance statements. We assume no liability as to the accuracy or completeness of any of the information and/or content provided herein and the Company cannot be held responsible for any omission, mistake nor for any loss or damage including without limitation to any loss of profit which may arise from reliance on any information supplied by TFA Global Pte Ltd.
Trade ideas

AUDUSD FRGNT FUN COUPON FRIDAY Forecast - Q4 | W47| D21 | Y25 |📅 Q4 | W47| D21 | Y25 |
📊 AUDUSD FRGNT Daily Forecast
🔍 Analysis Approach:
I’m applying Smart Money Concepts, focusing on:
Identifying Points of Interest on the Higher Time Frames (HTFs) 🕰️
Using those POIs to define a clear trading range 📐
Refining those zones on Lower Time Frames (LTFs) 🔎
Waiting for a Break of Structure (BoS) for confirmation ✅
This method allows me to stay precise, disciplined, and aligned with the market narrative, rather than chasing price.
💡 My Motto:
"Capital management, discipline, and consistency in your trading edge."
A positive risk-to-reward ratio, paired with a high win rate, is the backbone of any solid trading plan 📈🔐
⚠️ Losses?
They’re part of the mathematical game of trading 🎲
They don’t define you — they’re necessary, they happen, and we move forward 📊➡️
🙏 I appreciate you taking the time to review my Daily Forecast.
Stay sharp, stay consistent, and protect your capital
— FRNGT 🚀
OANDA:AUDUSD


The Global Shadow System1. Foundations of the Global Shadow System
The shadow system emerged alongside globalization. As the movement of capital accelerated in the 20th century, governments liberalized financial markets and reduced restrictions on cross-border flows. While these steps facilitated investment and economic growth, they also opened channels for unmonitored capital movement.
The system rests on four foundations:
1.1 Secrecy
Secrecy is the lifeblood of the shadow world. Whether in offshore financial centres or covert diplomatic channels, secrecy shields actors from accountability. Jurisdictions like the British Virgin Islands, Cayman Islands, Panama, and Luxembourg built industries around confidential structures, shell companies, and trusts.
1.2 Regulatory Fragmentation
Different countries have different laws. Global actors exploit these inconsistencies, creating a patchwork of loopholes and arbitrage opportunities. A company may be headquartered in one country, registered in another, banked in a third, and operational in dozens of others—all to avoid taxes, scrutiny, or liability.
1.3 Financial Innovation
Derivatives, complex securities, and digital assets—while beneficial in many ways—also enable obfuscation. Financial technology often evolves faster than regulation, creating zones where oversight lags behind activity.
1.4 Geopolitical Competition
Nations sometimes encourage secret channels to advance their interests. Intelligence services run covert operations; states use secret funding networks; governments enable their corporations to operate with minimal oversight abroad.
2. The Financial Shadow World
The financial sector contains some of the most sophisticated components of the global shadow system. The most prominent elements include:
2.1 Offshore Tax Havens
These jurisdictions specialize in:
Low or zero taxation
Strict banking secrecy
Minimal reporting requirements
Offshore havens attract corporations, private wealth, and even government officials wanting to move funds discreetly. Research suggests that trillions of dollars of global wealth are parked offshore, depriving nations of tax revenue and hiding ownership structures.
2.2 Shell Companies and Trusts
A shell company exists mainly on paper but can hold assets, open bank accounts, and move funds. Trusts further obscure the true owner by separating legal ownership from beneficiaries. These instruments are commonly used in:
money laundering
tax avoidance
political corruption
global mergers and acquisitions
2.3 Shadow Banking
Shadow banking refers to financial intermediaries that perform bank-like functions but are not regulated like banks. This includes hedge funds, private equity, money market funds, and structured investment vehicles. The 2008 financial crisis exposed how massively interconnected shadow banking is with the formal economy.
2.4 Illicit Financial Flows
Illicit flows encompass illegal money from corruption, trafficking, sanctions evasion, and organized crime. The global shadow system provides channels for these funds to move across borders and integrate into the legal economy.
3. Political and Geopolitical Components
Beyond finance, the global shadow system includes political and geopolitical networks that operate invisibly or unofficially.
3.1 Backdoor Diplomacy
Nations often communicate secretly through back channels:
intelligence services
private envoys
intermediaries in third countries
These channels allow negotiations, coup planning, and geopolitical coordination away from public view.
3.2 Corporate Influence and Lobby Networks
Multinational corporations exert massive influence on global rules. Lobby groups, think tanks, political donations, and policy consultants form a shadow ecosystem that shapes trade agreements, tax policies, and regulations without direct public accountability.
3.3 Intelligence Alliances
Agreements like the Five Eyes network operate partly in secrecy, sharing surveillance, cyber intelligence, and counterterrorism data. Such networks influence global security policies without democratic transparency.
3.4 Private Military and Security Companies
Firms like Wagner (Russia), Blackwater/Academi (US), and other PMCs operate in conflict zones, often without public oversight. They influence wars, resource extraction, and political transitions, forming a covert layer of global warfare.
4. Shadow Economies and Illicit Trade
The shadow economy includes activities that are legal in some contexts but hidden from regulators, as well as outright illegal sectors.
4.1 Black Markets
These markets deal in:
narcotics
arms
counterfeit products
human trafficking
wildlife trade
The shadow system provides the logistics, banking, and distribution channels needed to sustain these markets.
4.2 Crypto and Digital Shadows
Cryptocurrencies and digital assets have added new layers:
privacy coins like Monero
decentralized finance (DeFi)
darknet markets
ransomware payments
Though blockchain is transparent, anonymity tools create shadowed zones of activity.
4.3 Informal Economies
Millions of workers globally operate in informal sectors without legal protections. While not criminal, these activities form part of the grey economy that escapes tax and regulatory systems.
5. How the Shadow System Shapes Global Outcomes
The global shadow system influences the world in several powerful ways:
5.1 Rising Inequality
The wealthy use offshore structures to minimize taxes, while ordinary citizens face stricter rules. This widens the gap between elites and the public.
5.2 Policy Distortion
Governments may appear powerless against corporate tax avoidance or illicit flows, but often they are influenced by the same networks that benefit from secrecy.
5.3 Financial Crises
Unregulated financial products and shadow banking were major contributors to the 2008 crisis and remain potential future risks.
5.4 Undermined Democracy
Opaque funding, influence networks, and secret diplomacy reduce the transparency that democracies require to function.
5.5 Geopolitical Manipulation
Nations use covert financial and intelligence networks to influence elections, destabilize rivals, and secure strategic resources.
6. Efforts to Regulate the Shadow System
International bodies and governments have attempted reforms:
OECD’s BEPS framework targets corporate tax avoidance.
FATF regulations target money laundering and terror financing.
Automatic exchange of financial information reduces secrecy in banking.
Pandora and Panama Papers revelations pressured certain offshore centres.
Despite these efforts, the shadow system persists due to powerful incentives, political protection, and the complexity of global finance.
Conclusion
The global shadow system is an invisible but deeply influential structure shaping our world. It is built on secrecy, financial engineering, regulatory loopholes, and geopolitical backchannels. It affects economies, politics, crime, diplomacy, and global development. Understanding its mechanisms helps explain why inequality persists, why financial crises erupt, and why global governance remains fragmented. The shadow world is not merely a hidden side of globalization—it is its backbone.
AUD/USD Just Confirmed the Fade — Here’s Why I’m SellingI’ve been watching this pair quietly range under key resistance for weeks, but now it’s finally showing its hand. AUD/USD just gave a clean rejection from a stacked confluence zone — weekly trendline, lower high, and both 21 & 200 EMAs capping price. Smart money tapped the zone, failed to break above, and now we’re seeing momentum shift downward. That tells me one thing: continuation is likely.
My bias is bearish, with confirmation across the Weekly, Daily, and 4H. Price rejected off a weekly support/resistance flip (0.6499), failed to close above 0.6518, and respected the trendline beautifully. The 4H gave us a minor rally that tapped into structure before dumping — classic mitigation move. As long as we stay below 0.6518, I’m holding a short bias with targets down toward the next clean liquidity pocket near 0.6455 and potentially deeper at 0.6420.
🔻Trade Setup:
Entry Zone: 0.6499–0.6504
Stop Loss: 0.6518
Take Profit 1: 0.6455
Take Profit 2: 0.6420
This is a clean setup that fits my criteria as a swing trader. I’m shorting with structure, not emotion — and I’ll let the chart tell me when it’s done. Until then, I’m just flowing with the momentum.
🖤 Let’s trade smart.

AUD/USD Bearish Retracement SetupThe 15-minute AUD/USD chart shows price tapping into the session high (SH) formed across the London and New York sessions. This level sits inside a broader bearish premium zone, signalling exhaustion for buyers.
With the general market direction still bearish, this reaction at the SH is expected to produce a retracement back toward the TP area. The rejection wick and slowdown in momentum strengthen the case for a corrective move lower.
Overall, the confluence of SH and bearish structure supports a short-term drop toward TP before any further reassessment of trend continuation.


I'm still a bit Bearish on the AUSSIE DOLLAR CHOCH + BOS + Liq (IND) + M45 OB
Fortunately, yesterday's sweet zone held.
New signal Alert 🚨
AUDUSD
Pair: AUD/USD (Aussie Dollar)
Side: Sell (Sell Limit)
Entry: 0.6505
QP/STP: 0.6480 (25 pips)
TP 1: 0.6450 (55 pips)
TP 2: Open
Stop Loss: 0.6511 (6 pips - enough space for price to breathe)
Do not over-leverage your account, use proper risk and money management.
I9.11.25

AUD-USD Local Short! Sell!
Hello,Traders!
AUDUSD reacted from the horizontal supply, creating bearish displacement and confirming orderflow shift lower. Expect a continuation into the next liquidity pocket below. Time Frame 1H.
Sell!
Comment and subscribe to help us grow!
Check out other forecasts below too!
Disclosure: I am part of Trade Nation's Influencer program and receive a monthly fee for using their TradingView charts in my analysis.

AUD/USD – Bearish Breakout Signal Triggered AUD/USD – Bearish Breakout Signal Triggered (79% Backtest Probability)
A fresh SELL signal has been generated on AUD/USD, driven by a confirmed Breakout pattern on the current timeframe.
This setup aligns strongly with our automated trend-following model and carries a 79% historical backtest probability, indicating a high-quality bearish continuation opportunity.
🔍 Technical Breakdown
The price structure on AUD/USD is currently reflecting:
1. Bearish Breakout Structure
The pair recently pushed through a minor intraday structure, forming a lower high — a classic precursor to bearish continuation.
The breakout reflects rejection of upper liquidity, signaling sellers stepping in with control.
2. Trend Alignment
Our trend-following model confirms that:
The pair is trading below key dynamic levels.
Momentum indicators show downside pressure building.
The breakout pattern is clean and free from noise, improving its reliability.
This confluence increases the confidence that the downside move may continue.
🌍 Market Context & Macro Influence
Dollar strength continues to weigh heavily on AUD/USD, as:
Risk sentiment remains fragile
Interest rate differentials favor USD
Recent macro data prints support a stronger dollar outlook
AUD continues to show weakness due to commodity softness and cautious global sentiment
In short, the macro backdrop supports the bearish technical structure currently forming on the chart.
📌 Key Technical Levels to Watch
Immediate Resistance: 0.65297
Sellers are expected to defend this zone aggressively.
Immediate Support: 0.64907
A clean break below this region may accelerate bearish momentum.
Major Resistance: 0.65753
A strong structural ceiling — bullish invalidation sits above this level.
Major Support: 0.64451
The next major liquidity target for sellers if the present breakout expands.
🎯 Trade Parameters (Based on 0.10 Lot Size)
Parameter Level
Entry 0.65102
Stop Loss (SL) 0.65302
Take Profit (TP) 0.64702
Risk $50
Potential Profit $100
R:R Ratio 1 : 2
This structure offers a clean, mechanical setup with well-defined risk boundaries.
🛡 Risk Management Notes
Professional-grade risk practices include:
Never risk more than 1–2% of total capital per trade
Consider scaling into the position if price retests the breakout zone
Use a trailing stop after price moves in your favor
Avoid holding during high-impact USD or AUD economic events
Ensure proper position sizing based on your account balance
If volatility expands, consider partial profit-taking
Breakout trades can accelerate quickly — staying disciplined is essential.
📌 Final Thoughts
AUD/USD currently presents a high-probability bearish continuation setup, supported by both technical structure and macro context.
With backtested performance at 79%, clear levels, and defined risk, this opportunity fits well within professional trend-following models.
Traders should monitor price behavior near support at 0.64907 — a breakdown from this region may trigger the next wave of selling pressure toward 0.64702 and beyond.

AUDUSD — Bearish Liquidity Grab + HTF Trendline ReactionPrice swept buyside liquidity and tapped into HTF supply aligned with the descending trendline.
No bullish follow-through → absorption + rejection confirms weakness.
Bias remains bearish toward the next sell-side liquidity at the prior swing low.
Invalidation: Clean break above supply / trendline.

I'm Bearish on the Aussie DollarCHOCH + BOS + Liq (IND) + H1 OB
Unfortunately, yesterday's sweet zone @0.6160 didn't hold
New signal Alert 🚨
AUDUSD
Pair: AUD/USD (Aussie Dollar)
Side: Sell (Sell Limit)
Entry: 0.6508
QP/STP: 0.6483 (25 pips)
TP 1: 0.6453 (50 pips)
TP 2: Open
Stop Loss: 0.6518 (10 pips - enough space for price to breathe)
Do not over-leverage your account, use proper risk and money management.
I8.11.25
Ask me any question !!!

AUDUSD: Watching 0.6470 as Fed Cut Bets GrowHey Traders,
In today’s session we’re monitoring AUDUSD for a potential buying opportunity around the 0.64700 zone. The pair remains in a clear uptrend, and price is currently pulling back toward a major trend support / S&R confluence at 0.64700 — a level where bulls have previously stepped in with conviction.
On the macro side, I continue to think that the incoming data will ultimately force the FED into a December cut, despite the market still being mixed on the odds. If that scenario plays out, it would set the stage for broad USD weakness, which aligns perfectly with a bullish continuation on AUDUSD.
A reaction from the 0.64700 area could offer a solid continuation setup if the trend structure holds.
Trade safe,
Joe.

AUDUSD: Bullish Forecast & Bullish Scenario
It is essential that we apply multitimeframe technical analysis and there is no better example of why that is the case than the current AUDUSD chart which, if analyzed properly, clearly points in the upward direction.
Disclosure: I am part of Trade Nation's Influencer program and receive a monthly fee for using their TradingView charts in my analysis.
❤️ Please, support our work with like & comment! ❤️

AUDUSDAUDUSD price is currently approaching the support zone at 0.64866-0.64670$. If the price cannot break above 0.64670$, it is expected that the price will have a chance to rebound. Consider buying in the red zone.
🔥Trading futures, forex, CFDs and stocks carries a risk of loss.
Please consider carefully whether such trading is suitable for you.
>>GooD Luck 😊
❤️ Like and subscribe to never miss a new idea!

AUDUSD FRGNT Daily Forecast - Q4 | W47| D18 | Y25 |📅 Q4 | W47| D18 | Y25 |
📊 AUDUSD FRGNT Daily Forecast
🔍 Analysis Approach:
I’m applying Smart Money Concepts, focusing on:
Identifying Points of Interest on the Higher Time Frames (HTFs) 🕰️
Using those POIs to define a clear trading range 📐
Refining those zones on Lower Time Frames (LTFs) 🔎
Waiting for a Break of Structure (BoS) for confirmation ✅
This method allows me to stay precise, disciplined, and aligned with the market narrative, rather than chasing price.
💡 My Motto:
"Capital management, discipline, and consistency in your trading edge."
A positive risk-to-reward ratio, paired with a high win rate, is the backbone of any solid trading plan 📈🔐
⚠️ Losses?
They’re part of the mathematical game of trading 🎲
They don’t define you — they’re necessary, they happen, and we move forward 📊➡️
🙏 I appreciate you taking the time to review my Daily Forecast.
Stay sharp, stay consistent, and protect your capital
— FRNGT 🚀
OANDA:AUDUSD

Warning: AUD/USD Sinking – Any Reversal Ahead?Hello everyone, today we’ll analyze the AUD/USD pair in the context of its clear downtrend.
In terms of news, the USD is strengthening due to expectations that the Federal Reserve (Fed) will keep interest rates high, putting pressure on the AUD. Additionally, the lack of supportive data from Australia recently has made investors concerned about the economic outlook of the country.
From a technical perspective, the chart shows that AUD/USD is in a downtrend as the price breaks through a descending triangle pattern . The resistance at 0.65200 has been rejected several times, and the buying pressure is weakening. This indicates that the downtrend could continue, especially as the price has tested and failed to break through this resistance level.
The next key support levels are 0.64700 and 0.64200. If the price breaks these support levels, the downtrend will likely accelerate. Given the current context, AUD/USD may continue to fall in the short term, unless there’s an unexpected shift in policy from the Fed or Australia .
In conclusion, the downtrend of AUD/USD is clear and significant . The support levels at 0.64700 and 0.64200 are important levels to watch for trading.

Falling towards key support?AUD/USD is pulling back toward the pivot level, which serves as a multi–swing-low support zone. From this area, the pair may find buying interest and potentially rebound toward the 1st resistance level.
Pivot: 0.6468
1st Support: 0.6444
1st Resitance: 0.6498
Disclaimer:
The opinions given above constitute general market commentary and do not constitute the opinion or advice of IC Markets or any form of personal or investment advice.
Any opinions, news, research, analyses, prices, other information, or links to third-party sites contained on this website are provided on an "as-is" basis, are intended to be informative only, and are not advice, a recommendation, research, a record of our trading prices, an offer of, or solicitation for, a transaction in any financial instrument and thus should not be treated as such. The information provided does not involve any specific investment objectives, financial situation, or needs of any specific person who may receive it. Please be aware that past performance is not a reliable indicator of future performance and/or results. Past performance or forward-looking scenarios based upon the reasonable beliefs of the third-party provider are not a guarantee of future performance. Actual results may differ materially from those anticipated in forward-looking or past performance statements. IC Markets makes no representation or warranty and assumes no liability as to the accuracy or completeness of the information provided, nor any loss arising from any investment based on a recommendation, forecast, or any information supplied by any third party.

AUD/USD Long - 4 Hr - Daily support and resistance zones marked - looks like the market is staying within this zone.
- I believe a new higher high will be formed from my price trigger point.
- Rejection at the 61.8 level on my fib tool - shows buyers stepping in.


Small continuation, all structure mapped out Overall BullishStructure is mapped out, really strong bullish Overall, I'm prioritizing longs when price reach our Fibo LVL, this is a beautiful continuation as price has been sweeping liquidity and fueling shorts moves for slow periods of time. I'm looking for this type of moves before hitting our Fibo and changing BIAS to longs
AUDUSD bearish trend continuation below 0.6560The AUDUSD pair is currently trading with a bearish bias, aligned with the broader downward trend. Recent price action shows an oversold rally towards the resistance, suggesting a temporary relief rally within the downtrend.
Key resistance is located at 0.6560, a prior consolidation zone. This level will be critical in determining the next directional move.
A bearish rejection from 0.6560 could confirm the resumption of the downtrend, targeting the next support levels at 0.6480, followed by 0.6460 and 0.6440 over a longer timeframe.
Conversely, a decisive breakout and daily close above 0.6560 would invalidate the current bearish setup, shifting sentiment to bullish and potentially triggering a move towards 0.6580, then 0.6600.
Conclusion:
The short-term outlook remains bearish unless the pair breaks and holds above 0.6560. Traders should watch for price action signals around this key level to confirm direction. A rejection favours fresh downside continuation, while a breakout signals a potential trend reversal or deeper correction.
This communication is for informational purposes only and should not be viewed as any form of recommendation as to a particular course of action or as investment advice. It is not intended as an offer or solicitation for the purchase or sale of any financial instrument or as an official confirmation of any transaction. Opinions, estimates and assumptions expressed herein are made as of the date of this communication and are subject to change without notice. This communication has been prepared based upon information, including market prices, data and other information, believed to be reliable; however, Trade Nation does not warrant its completeness or accuracy. All market prices and market data contained in or attached to this communication are indicative and subject to change without notice.

Lingrid | AUDUSD Weekly High False Breakout - Sell SetupFX:AUDUSD is rejecting the resistance block after forming a clear lower high right beneath the descending red trendline. Price is now slipping back under the minor breakout zone, showing fading bullish momentum inside the shaded range. As long as price stays below 0.6550, sellers remain in control with a clean path toward the 0.6500 liquidity zone. A break and retest of that zone may open further downside into the deeper support area.
⚠️ Risks:
A strong reclaim above 0.6550 would invalidate the bearish structure.
Sudden USD weakness could trigger a corrective bounce.
Failure to hold below the blue trendline may cause a short-term squeeze before continuation lower.
If this idea resonates with you or you have your own opinion, traders, hit the comments. I’m excited to read your thoughts!
