AUD/USD Climbs on Jobs Report as Wedge Pattern Eyes BreakoutDespite a slightly stronger dollar, via the DXY index, AUD/USD managed to tick slightly higher on Friday, rising by about 0.15% in afternoon U.S. trading. The Australian employment report surprised to the upside this week, with the country’s unemployment rate dropping to 4.3%. That reduced rate cut odds, likely explaining some of the strength this week.
Friday’s move helped the currency rise about 0.73% for the week, although prices remain inside of last week’s open/closing range. Zooming out a bit, this month’s price action puts the currency at about a 0.08% loss, with prices remaining contained within the October swing high/low levels. In fact, prices have retracted to the pseudo 50% Fibonacci retracement level from that range. Indecision within the range shows that AUD/USD traders haven’t come to a consensus on the direction for the currency’s path yet.
Zooming out to the weekly chart, we see that a symmetrical wedge pattern has formed, with the bottom of the wedge starting in late June and the top of the wedge defined by the September highs. Prices rallied into the wedge formation, suggesting that this could be a bullish wedge that could see an upside breakout if prices manage to pierce above the pattern. If we assume an upside breakout is to occur, we can take the measured move to gauge the upside target once resistance breaks. The measured move is defined by the widest part of the pattern, which measures 0.03344. That could put prices within touching distance of the 0.69000 level, which is where 2024 trading saw resistance. Alternatively, a clean break below the pattern’s support would invalidate the pattern and dash hopes of a breakout.
Trade ideas

AUD/USD – Bullish Reversal from Demand Zone | 2H Chart Analysis Busy: 🔹 AUD/USD – Bullish Reversal from Demand Zone | 2H Chart Analysis 🔹
Price has respected a key demand zone with support from the Ichimoku cloud.
Bullish price action suggests a potential breakout & retest setup targeting 0.6580 and 0.6615.
- Entry Zone: 0.6530 – 0.6540
- Stop Loss: 0.6490
- TP1: 0.6580
- TP2: 0.6615
- Risk:Reward: 1:2 or better
📊 If the price confirms breakout above 0.6550 with a retest, this setup can play out cleanly.
#AUDUSD #Ichimoku #ForexAnalysis #TradingView #BreakoutSetup
Busy: AUD/USD – Bullish Reversal from Demand Zone | 2H Chart Analysis

EURUSD FRGNT Daily Forecast -Q4 | W46 | D14 | Y25 |📅 Q4 | W46 | D14 | Y25 |
📊 EURUSD FRGNT Daily Forecast
FRGNT FUN COUPON FRIDAY
🔍 Analysis Approach:
I’m applying Smart Money Concepts, focusing on:
Identifying Points of Interest on the Higher Time Frames (HTFs) 🕰️
Using those POIs to define a clear trading range 📐
Refining those zones on Lower Time Frames (LTFs) 🔎
Waiting for a Break of Structure (BoS) for confirmation ✅
This method allows me to stay precise, disciplined, and aligned with the market narrative, rather than chasing price.
💡 My Motto:
"Capital management, discipline, and consistency in your trading edge."
A positive risk-to-reward ratio, paired with a high win rate, is the backbone of any solid trading plan 📈🔐
⚠️ Losses?
They’re part of the mathematical game of trading 🎲
They don’t define you — they’re necessary, they happen, and we move forward 📊➡️
🙏 I appreciate you taking the time to review my Daily Forecast.
Stay sharp, stay consistent, and protect your capital
— FRNGT 🚀

AUDUSD H1 | Bullish Bounce off Key SupportMomentum: Bullish
Price is currently above the ichimoku cloud.
Buy entry: 0.6548
- Pullback support
- 61.8% Fib retracement
Stop Loss: 0.6529
- Multi-swing low support
Take Profit: 0.6579
- Swing high resistance
Stratos Markets Limited (tradu.com/uk ), Stratos Europe Ltd (tradu.com/eu ):
CFDs are complex instruments and come with a high risk of losing money rapidly due to leverage. 70% of retail investor accounts lose money when trading CFDs with this provider. You should consider whether you understand how CFDs work and whether you can afford to take the high risk of losing your money.
Stratos Global LLC (tradu.com/en ): Losses can exceed deposits.

AUDUSD – Wave (iv) Pullback Into Channel SupportTimeframe : 1H
Bias: Bullish continuation
Setup Type: Elliott Wave (Wave (iv) → Wave (v)) inside ascending channel
Market Explanation
Your chart shows:
A completed 5-wave impulsive structure forming within a rising channel.
Price has pulled back from the top of wave (iii) into the wave (iv) retracement zone.
Wave (iv) is reacting at:
Channel support
Previous minor structure (wave (4))
A Fibonacci retracement zone (~38.2%–50%)
This aligns perfectly with a buy-the-dip wave (v) continuation trade.
TARGETS (Wave (v) Objective)
TP1: 0.6580 – 0.6590
(Mid-channel & previous high of wave (iii))
TP2 : 0.6615 – 0.6620
(Upper channel resistance and projected wave (v) completion)

Falling towards strong support?Aussie (AUD/USD) is falling towards the pivot and could bounce to the 1st resistance.
Pivot: 0.6516
1st Support: 0.6503
1st Resistance: 0.6548
Disclaimer:
The opinions given above constitute general market commentary and do not constitute the opinion or advice of IC Markets or any form of personal or investment advice.
Any opinions, news, research, analyses, prices, other information, or links to third-party sites contained on this website are provided on an "as-is" basis, are intended to be informative only, and are not advice, a recommendation, research, a record of our trading prices, an offer of, or solicitation for, a transaction in any financial instrument and thus should not be treated as such. The information provided does not involve any specific investment objectives, financial situation, or needs of any specific person who may receive it. Please be aware that past performance is not a reliable indicator of future performance and/or results. Past performance or forward-looking scenarios based upon the reasonable beliefs of the third-party provider are not a guarantee of future performance. Actual results may differ materially from those anticipated in forward-looking or past performance statements. IC Markets makes no representation or warranty and assumes no liability as to the accuracy or completeness of the information provided, nor any loss arising from any investment based on a recommendation, forecast, or any information supplied by any third party.

AUDUSD FRGNT Daily Forecast -Q4 | W46 | D14 | Y25 |📅 Q4 | W46 | D14 | Y25 |
📊 AUDUSD FRGNT Daily Forecast
FRGNT FUN COUPON FRIDAY
🔍 Analysis Approach:
I’m applying Smart Money Concepts, focusing on:
Identifying Points of Interest on the Higher Time Frames (HTFs) 🕰️
Using those POIs to define a clear trading range 📐
Refining those zones on Lower Time Frames (LTFs) 🔎
Waiting for a Break of Structure (BoS) for confirmation ✅
This method allows me to stay precise, disciplined, and aligned with the market narrative, rather than chasing price.
💡 My Motto:
"Capital management, discipline, and consistency in your trading edge."
A positive risk-to-reward ratio, paired with a high win rate, is the backbone of any solid trading plan 📈🔐
⚠️ Losses?
They’re part of the mathematical game of trading 🎲
They don’t define you — they’re necessary, they happen, and we move forward 📊➡️
🙏 I appreciate you taking the time to review my Daily Forecast.
Stay sharp, stay consistent, and protect your capital
— FRNGT 🚀
OANDA:AUDUSD

Stop!Loss|Market View: AUDUSD🙌 Stop!Loss team welcomes you❗️
In this post, we're going to talk about the near-term outlook for the AUDUSD currency pair☝️
Potential trade setup:
🔔Entry level: 0.65167
💰TP: 0.64443
⛔️SL: 0.65582
"Market View" - a brief analysis of trading instruments, covering the most important aspects of the FOREX market.
👇 In the comments 👇 you can type the trading instrument you'd like to analyze, and we'll talk about it in our next posts.
💬 Description: The Australian dollar price is currently moving in a downward channel, but there's a clear trend of price pressure toward 0.65230, which is bearish. The pair is likely to break this support level within the next 1-2 trading days and move toward 0.64480.
Thanks for your support 🚀
Profits for all ✅

AUDUSD CONTINUE BULLISH Technically:
AUDUSD broke consolidation box
AUDUSD retest the resistance become support
AUDUSD no bearish divergence

AUDUSD H1 | Bullish Bounce off Key SupportMomentum: Bullish
Price is currently the ichimoku cloud.
Buy entry: 0.6515
- Strong overlap support
Stop Loss: 0.6488
- Overlap support
Take Profit: 0.6559
- Overlap resistance
Stratos Markets Limited (tradu.com/uk ), Stratos Europe Ltd (tradu.com/eu ):
CFDs are complex instruments and come with a high risk of losing money rapidly due to leverage. 70% of retail investor accounts lose money when trading CFDs with this provider. You should consider whether you understand how CFDs work and whether you can afford to take the high risk of losing your money.
Stratos Global LLC (tradu.com/en ): Losses can exceed deposits.

AUDUSD short setup2 Supply Zones. But I'll chose the closer one for now since it swept liq(x) before bearish move.
This is a low probability setup. Manage risk effectively.


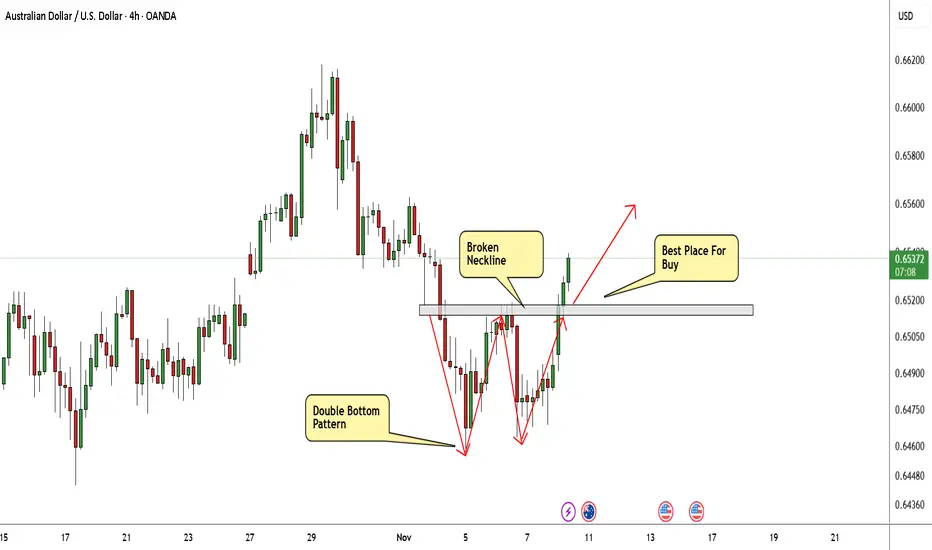
AUD/USD Made Clear Reversal Pattern,Long Setup To Get 150 Pips !Here is my 4H Chart On AUD/USD , The price creating a very clear reversal pattern ( Double Bottom Reversal Pattern ) and the price made a very good bullish price action now And the price confirmed the pattern by closing above the neckline. so we can enter a buy trade when the price go back to retest the broken neckline to can use a small stop loss , or we can enter now if you are aggressive trader but the stop loss will be bigger , and we can targeting from 50 to 100 pips with a decent stop loss .
Reasons To Enter :
1- Perfect Touch For The Area .
2- Clear Bullish Price Action .
3- Bigger T.F Giving Good Bullish P.A .
4- Clear Reversal Pattern .
5- Pattern Confirmed .
AUDUSD Breakout and Potential RetraceHey Traders, in today's trading session we are monitoring AUDUSD for a buying opportunity around 0.64800 zone, AUDUSD was trading in a downtrend and successfully managed to break it out. Currently is in a correction phase in which it is approaching the retrace area at 0.64800 support and resistance area.
Trade safe, Joe.

AUDUSD Is Bearish! Short!
Please, check our technical outlook for AUDUSD.
Time Frame: 1D
Current Trend: Bearish
Sentiment: Overbought (based on 7-period RSI)
Forecast: Bearish
The market is trading around a solid horizontal structure 0.658.
The above observations make me that the market will inevitably achieve 0.641 level.
P.S
Overbought describes a period of time where there has been a significant and consistent upward move in price over a period of time without much pullback.
Like and subscribe and comment my ideas if you enjoy them!

AUDUSDConsidering the price range at the bottom of the channel and the candlestick formed on the daily timeframe, the probability of it retesting **0.66231** is high.

AUDUSD FRGNT Daily Forecast & Full Pre LDN Open Breakdown Q4 W46📅 Q4 | W46 | D13 | Y25 |
📊 AUDUSD FRGNT Daily Forecast & Full Pre LDN Open Breakdown
🔍 Analysis Approach:
I’m applying Smart Money Concepts, focusing on:
Identifying Points of Interest on the Higher Time Frames (HTFs) 🕰️
Using those POIs to define a clear trading range 📐
Refining those zones on Lower Time Frames (LTFs) 🔎
Waiting for a Break of Structure (BoS) for confirmation ✅
This method allows me to stay precise, disciplined, and aligned with the market narrative, rather than chasing price.
💡 My Motto:
"Capital management, discipline, and consistency in your trading edge."
A positive risk-to-reward ratio, paired with a high win rate, is the backbone of any solid trading plan 📈🔐
⚠️ Losses?
They’re part of the mathematical game of trading 🎲
They don’t define you — they’re necessary, they happen, and we move forward 📊➡️
🙏 I appreciate you taking the time to review my Daily Forecast.
Stay sharp, stay consistent, and protect your capital
— FRNGT 🚀
OANDA:AUDUSD

AUDUSD FRGNT Daily Forecast - Q4 | W46 | D13 | Y25 |📅 Q4 | W46 | D13 | Y25 |
📊 AUDUSD FRGNT Daily Forecast & Full Pre LDN Open Breakdown
🔍 Analysis Approach:
I’m applying Smart Money Concepts, focusing on:
Identifying Points of Interest on the Higher Time Frames (HTFs) 🕰️
Using those POIs to define a clear trading range 📐
Refining those zones on Lower Time Frames (LTFs) 🔎
Waiting for a Break of Structure (BoS) for confirmation ✅
This method allows me to stay precise, disciplined, and aligned with the market narrative, rather than chasing price.
💡 My Motto:
"Capital management, discipline, and consistency in your trading edge."
A positive risk-to-reward ratio, paired with a high win rate, is the backbone of any solid trading plan 📈🔐
⚠️ Losses?
They’re part of the mathematical game of trading 🎲
They don’t define you — they’re necessary, they happen, and we move forward 📊➡️
🙏 I appreciate you taking the time to review my Daily Forecast.
Stay sharp, stay consistent, and protect your capital
— FRNGT 🚀
OANDA:AUDUSD

AUDUSD – When Capital Starts Leaning Toward the BullsThe market is entering an interesting phase as Australia’s latest economic data brings renewed confidence to the AUD. Stronger-than-expected job growth and the RBA’s stance of “no interest-rate cuts anytime soon” have created a solid foundation for the Australian dollar to attract buying pressure. Meanwhile, the USD is gradually losing momentum as markets reduce expectations of a quick policy move from the Fed. This shift makes the AUD a more attractive short-term choice.
On the chart, AUDUSD has just broken above short-term resistance and is holding firmly above the 0.6560 nearby support — an important area the market may use to accumulate before pushing higher. The current structure leans bullish, with higher lows forming and clear buying interest each time price retests support.
As long as AUDUSD stays above 0.6560, the next target lies around 0.6620 — a zone that previously acted as strong rejection. This will be the level where bulls truly test their strength before deciding whether to extend the uptrend.

AUD/USD – Looking for buys off the 4H BC zoneAfter completing a clean bearish correction, price shifted bullish on the 4H.
I’m waiting for a retrace into the BC + Order Block zone (0.6490) to go long.
Targeting 0.6560 , stop below 0.6463 .
If 0.6460 breaks cleanly, setup’s invalid.
R:R ≈ 1:2.6 — let’s see if demand holds 👀
Disclaimer: This post is for educational purposes only and does not constitute financial advice.

AUDUSD - BullishAUDUSD is bullish on 1H timeframe and breaking out of its consolidation box. Buy stop above box and SL below.

AUDUSD BREAKOUT TESTSo basically on the 1 hour time frame we are expecting a breakout test out of the consolidation zone only unto that happens we can neither long or short
