UKOIL M30 | Potential Bullish riseUKOIL has bounced off the buy entry aat 60.69, whichis a pullback support and could rise from this level to the upside.
Stop loss is at 59.83, which lines up with the 61.8% Fibonacci projection.
Take profit is at 62.94, which is a swing high resistance.
High Risk Investment Warning
Trading Forex/CFDs on margin carries a high level of risk and may not be suitable for all investors. Leverage can work against you.
Stratos Markets Limited (tradu.com ):
CFDs are complex instruments and come with a high risk of losing money rapidly due to leverage. 65% of retail investor accounts lose money when trading CFDs with this provider. You should consider whether you understand how CFDs work and whether you can afford to take the high risk of losing your money.
Stratos Europe Ltd (tradu.com ):
CFDs are complex instruments and come with a high risk of losing money rapidly due to leverage. 66% of retail investor accounts lose money when trading CFDs with this provider. You should consider whether you understand how CFDs work and whether you can afford to take the high risk of losing your money.
Stratos Global LLC (tradu.com ):
Losses can exceed deposits.
Please be advised that the information presented on TradingView is provided to Tradu (‘Company’, ‘we’) by a third-party provider (‘TFA Global Pte Ltd’). Please be reminded that you are solely responsible for the trading decisions on your account. There is a very high degree of risk involved in trading. Any information and/or content is intended entirely for research, educational and informational purposes only and does not constitute investment or consultation advice or investment strategy. The information is not tailored to the investment needs of any specific person and therefore does not involve a consideration of any of the investment objectives, financial situation or needs of any viewer that may receive it. Kindly also note that past performance is not a reliable indicator of future results. Actual results may differ materially from those anticipated in forward-looking or past performance statements. We assume no liability as to the accuracy or completeness of any of the information and/or content provided herein and the Company cannot be held responsible for any omission, mistake nor for any loss or damage including without limitation to any loss of profit which may arise from reliance on any information supplied by TFA Global Pte Ltd.
The speaker(s) is neither an employee, agent nor representative of Tradu and is therefore acting independently. The opinions given are their own, constitute general market commentary, and do not constitute the opinion or advice of Tradu or any form of personal or investment advice. Tradu neither endorses nor guarantees offerings of third-party speakers, nor is Tradu responsible for the content, veracity or opinions of third-party speakers, presenters or participants.
Trade ideas

OIL possibly reversing.OIL has broken out of the channel and started making Higher Highs on the lower timeframes. We will wait patiently to see if it is a FakeOut or will come back retesting and fly UP.🧐
BRENT keep an eyebrent may have some further downside completing wb potentially as low as 45. look for entry at current levels for w3 to start a strong move up..

AB=CD Brent A 4H AB=CD on Brent crude oil.
Simple pattern with target at 67.5.
Divergence on multiple indicators 4H and below.

Max bat Brent crudeThe obvious pattern is the max bat an hybrid pattern, gartley/bat. The image on screen gives max bat fib ratios.
The most crucial part of analysis is the price action from around early April. The red circle is around the heaviest volume candles. The fractal/ swing low candle has affected price ever since with multiple touches top of candle body as support and resistance. With price now approaching lower boundaries of candle body we appear to be at a crucial juncture.
The gold lines are round numbers 75 and 60. I think 90 is a reasonable target from here. Long.

Brent analysis for next weekBrent ended daily at resistance around 65.
I think Brent will be bearish next week, rebounding around 65 to hit support around 59.

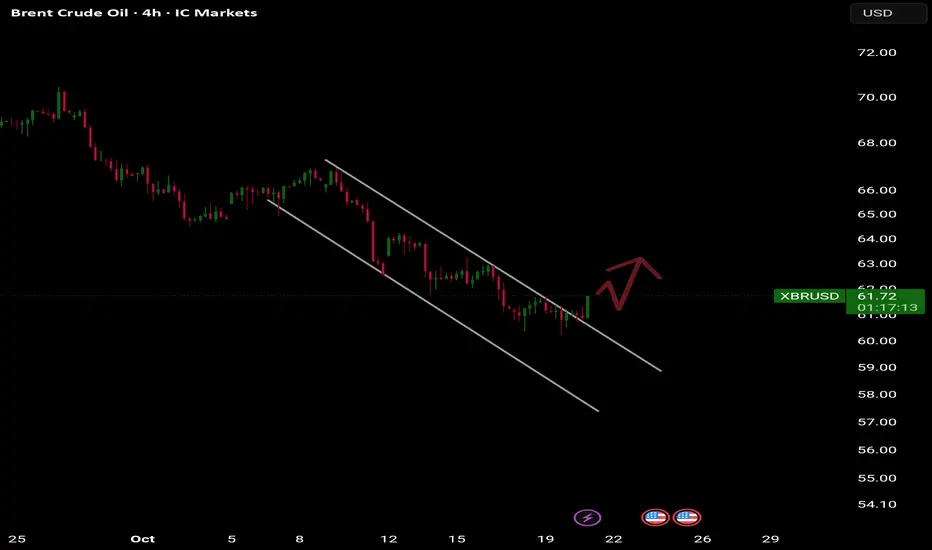
Brent Crude Oil – Potential Reversal and Early Recovery Setup#Brent Crude Oil – Potential Reversal and Early Recovery Setup
Current price: $61.08
Brent is forming a potential reversal structure after an extended downward cycle. The short-term pattern shows a breakout attempt from a descending channel, hinting at the possible start of a recovery phase.
🧩 Technical Overview
• After reaching the $60 area, the market found support near previous structural lows.
• Price is attempting to break above the descending wedge, suggesting that sellers are losing momentum.
• The structure now points to a possible mid-term rebound within the broader corrective context.
📈 Scenario
• As long as price holds above $60.00, a recovery move remains likely.
• Stop-loss: below $60.00, under the recent swing low.
• Upside focus:
– $63.00–$63.30 — first confirmation zone (initial reaction)
– $64.70–$66.50 — key resistance cluster and short-term target range
– $67.80+ — extended recovery objective aligned with Fibonacci projections
• A clear break above $63.00 would confirm the start of the rebound sequence.
⚙️ Market Context
• The sell-off from early October appears exhausted, with decreasing volatility and volume on declines.
• Energy markets show early stabilization as broader risk sentiment improves.
• The next move depends on whether Brent can hold above $60 and convert the breakout into sustained momentum.
🧭 Summary
Brent is attempting to shift from a corrective downtrend into a recovery phase.
Holding above $60.00 keeps the bullish recovery scenario active, with targets near $63.00, $64.70–$66.50, and an extended objective toward $67.80.
Failure to hold above $60.00 would invalidate the setup and reopen the path toward new lows.

OIL slowly rising.OIL has been moving in a range. Waiting for a BreakOut as it has been in one of the lowest points in history.

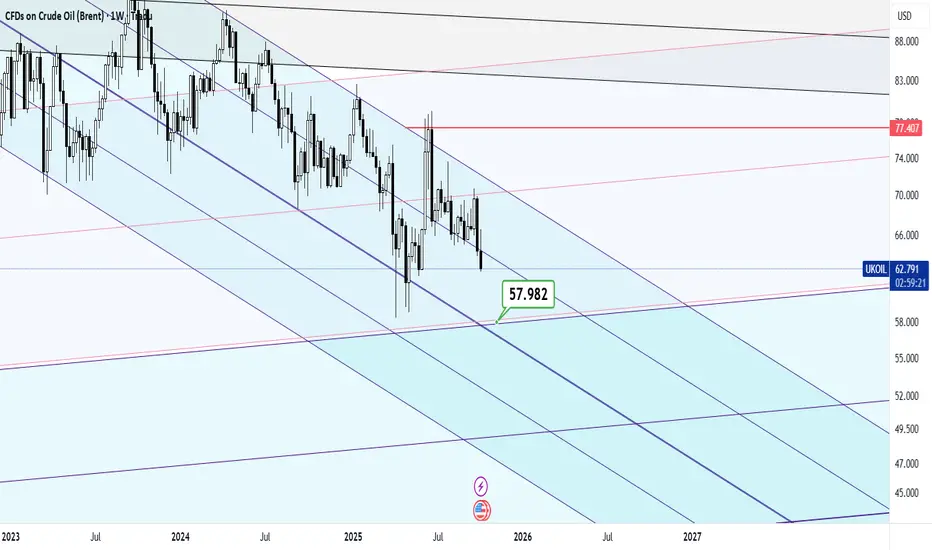
BRENT CRUDE OIL - Long-Term As we know, history tends to repeat itself.
Just by observing the current structure, I would dare to assume that another wave of turbulence might be ahead.
Some macro shocks could push oil down to retest the white support zone, or in the case of a “super dump,” even drive prices toward the blue accumulation area.
In any case volatility may increase sharply before the next long-term accumulation begins.

BRENT OIL BUYWe're looking to take a low probability, -B buy setup. We say low probability because it is a bearish market. But it has been respect lows and demand zones in the discount area of a 15 minute range. So, we like the demand zone that formed yesterday off of a previous successful demand done. We're targeting a Daily FVG.

Brent Crude Oil Long Setup: Breakout, Retest, and Bullish StructOn the 1-hour timeframe, price formed a tight range after a strong downtrend. Selling pressure weakened, and buyers started stepping in. A bullish engulfing candle broke the range with high volume, signaling accumulation.
Price then retested the breakout with a wick, confirming strength. Since then, we’ve seen higher highs and higher lows — a clear sign buyers are in control and price is ready to move higher.

Crude Oil BuysCrude Oil : The market has been consolidating in a clear range, showing accumulation. Equal lows were swept earlier, indicating liquidity grab and potential demand absorption. The recent price action shows higher lows forming into resistance, suggesting pressure building for a breakout.
Entry : 67.468
Stop Loss : 65.974
Take Profit : 71.803

Brent Crude oversold bounce backs capped at 6435 resistanceThe Brent Crude Oil is currently trading with a bearish bias, aligned with the broader downward trend. Recent price action shows a retest of the longer term support, suggesting a temporary relief rally within the downtrend.
Key resistance is located at 6435, a prior consolidation zone. This level will be critical in determining the next directional move.
A bearish rejection from 6435 could confirm the resumption of the downtrend, targeting the next support levels at 6160, followed by 6110 and 6023 over a longer timeframe.
Conversely, a decisive breakout and daily close above 6435 would invalidate the current bearish setup, shifting sentiment to bullish and potentially triggering a move towards 6500, then 6570.
Conclusion:
The short-term outlook remains bearish unless the Brent Crude price breaks and holds above 6435. Traders should watch for price action signals around this key level to confirm direction. A rejection favours fresh downside continuation, while a breakout signals a potential trend reversal or deeper correction.
This communication is for informational purposes only and should not be viewed as any form of recommendation as to a particular course of action or as investment advice. It is not intended as an offer or solicitation for the purchase or sale of any financial instrument or as an official confirmation of any transaction. Opinions, estimates and assumptions expressed herein are made as of the date of this communication and are subject to change without notice. This communication has been prepared based upon information, including market prices, data and other information, believed to be reliable; however, Trade Nation does not warrant its completeness or accuracy. All market prices and market data contained in or attached to this communication are indicative and subject to change without notice.

Going Up:BRENToilCrude has been anything but friendly however it has also been adamant on growing no matter the cost.
Crude Oil has aggressively passed every reason to decrease AND is still refusing to go further down. That is also the case with Crude Oil Bulls. They have substantial reasons to go long but are meet at an impasse because the economy has no report on direction. The information they do have isn’t promising and the US Government shutdown isn’t helping the matter of uncertainty either.
I mean it’s a roller coaster of emotions BUT you don’t play with your feelings you use your head and the logic is if it meets the criteria it will stand the test and this asset is signaling Long again.
Im relying on my usual supportive reasoning and insight from world news to assess this trade but with sentiment so finicky it’s never that cut and dry.
Regardless of what you gotta pay to play and since the market wants to take risks you might as well take risks too.
Just remember the market has nothing to lose but you do so be mindful how much play money you want to spend.
Now have a Prosperous Trade and God Bless

OIl rised.OIL moved as we had analyzed. Possibly could rise more before rhe markets closed this week.

Brent Downtrend continuation below 6435 resistanceThe Brent Crude Oil is currently trading with a bearish bias, aligned with the broader downward trend. Recent price action shows a retest of the longer term support, suggesting a temporary relief rally within the downtrend.
Key resistance is located at 6435, a prior consolidation zone. This level will be critical in determining the next directional move.
A bearish rejection from 6435 could confirm the resumption of the downtrend, targeting the next support levels at 6160, followed by 6110 and 6023 over a longer timeframe.
Conversely, a decisive breakout and daily close above 6435 would invalidate the current bearish setup, shifting sentiment to bullish and potentially triggering a move towards 6500, then 6570.
Conclusion:
The short-term outlook remains bearish unless the Brent Crude price breaks and holds above 6435. Traders should watch for price action signals around this key level to confirm direction. A rejection favours fresh downside continuation, while a breakout signals a potential trend reversal or deeper correction.
This communication is for informational purposes only and should not be viewed as any form of recommendation as to a particular course of action or as investment advice. It is not intended as an offer or solicitation for the purchase or sale of any financial instrument or as an official confirmation of any transaction. Opinions, estimates and assumptions expressed herein are made as of the date of this communication and are subject to change without notice. This communication has been prepared based upon information, including market prices, data and other information, believed to be reliable; however, Trade Nation does not warrant its completeness or accuracy. All market prices and market data contained in or attached to this communication are indicative and subject to change without notice.

Brent Crudee Oil sideways consolidation supported at 6140The Brent Crude Oil is currently trading with a bearish bias, aligned with the broader downward trend. Recent price action shows a retest of the longer term support, suggesting a temporary relief rally within the downtrend.
Key resistance is located at 6435, a prior consolidation zone. This level will be critical in determining the next directional move.
A bearish rejection from 6435 could confirm the resumption of the downtrend, targeting the next support levels at 6160, followed by 6110 and 6023 over a longer timeframe.
Conversely, a decisive breakout and daily close above 6435 would invalidate the current bearish setup, shifting sentiment to bullish and potentially triggering a move towards 6500, then 6570.
Conclusion:
The short-term outlook remains bearish unless the Brent Crude price breaks and holds above 6435. Traders should watch for price action signals around this key level to confirm direction. A rejection favours fresh downside continuation, while a breakout signals a potential trend reversal or deeper correction.
This communication is for informational purposes only and should not be viewed as any form of recommendation as to a particular course of action or as investment advice. It is not intended as an offer or solicitation for the purchase or sale of any financial instrument or as an official confirmation of any transaction. Opinions, estimates and assumptions expressed herein are made as of the date of this communication and are subject to change without notice. This communication has been prepared based upon information, including market prices, data and other information, believed to be reliable; however, Trade Nation does not warrant its completeness or accuracy. All market prices and market data contained in or attached to this communication are indicative and subject to change without notice.

Brent Crude - The BEAR still rules!Price just can’t catch a break.
We’ve got a broken uptrend, a clear inverse cup and handle, and price trading below both the 20MA and 200MA – the classic “sell the rallies” setup.
As long as we stay under that red downtrend line, the bias is simple: down.
Target sits around $54.68, with momentum showing weakness across the board.
And yeah… we’ll still pay high fuel prices 😒
💸 Fundamental Reasons for Downside
🪓 Demand Destruction:
Global growth is slowing — less demand for oil from major economies. Probably due to an increase in demand for EV or other alternative energy vehicles in the making?
🇨🇳 China Concerns:
China’s recovery keeps disappointing, cutting one of oil’s biggest demand sources.
🪙 Strong USD:
A stronger dollar makes oil more expensive globally, reducing demand.
🛢️ OPEC Uncertainty:
Mixed signals and production inconsistencies are shaking investor confidence.
🏦 Interest Rates Bite:
High rates are squeezing industrial output and travel – both oil consumers.
Disclosure: I am part of Trade Nation's Influencer program and receive a monthly fee for using their TradingView charts in my analysis.

M Gartley signals Trend ReversalOil downtrend channel has lasted a looooong time. Now a Gartley-M Harmonic Pattern is present which could signal a trend reversal... if it holds. Upside includes usual Gartley resistance levels and 1.618 resistance at USD 95.
Thank you for your attention to this matter!

UKOIL H4 | Falling Towards Fibonacci Confluence LevelUKOIL is falling towards the buy entry at 62.35, which lines up with the 161.8% Fibonacci extension and the 61.8% Fibonacci projection and could bounce from this level to the take profit.
Stop loss is at 61.32, which lines up with the 78.6% Fibonacci projection.
Take profit is at 64.20, which is a pullback resistance.
High Risk Investment Warning
Trading Forex/CFDs on margin carries a high level of risk and may not be suitable for all investors. Leverage can work against you.
Stratos Markets Limited (tradu.com ):
CFDs are complex instruments and come with a high risk of losing money rapidly due to leverage. 65% of retail investor accounts lose money when trading CFDs with this provider. You should consider whether you understand how CFDs work and whether you can afford to take the high risk of losing your money.
Stratos Europe Ltd (tradu.com ):
CFDs are complex instruments and come with a high risk of losing money rapidly due to leverage. 66% of retail investor accounts lose money when trading CFDs with this provider. You should consider whether you understand how CFDs work and whether you can afford to take the high risk of losing your money.
Stratos Global LLC (tradu.com ):
Losses can exceed deposits.
Please be advised that the information presented on TradingView is provided to Tradu (‘Company’, ‘we’) by a third-party provider (‘TFA Global Pte Ltd’). Please be reminded that you are solely responsible for the trading decisions on your account. There is a very high degree of risk involved in trading. Any information and/or content is intended entirely for research, educational and informational purposes only and does not constitute investment or consultation advice or investment strategy. The information is not tailored to the investment needs of any specific person and therefore does not involve a consideration of any of the investment objectives, financial situation or needs of any viewer that may receive it. Kindly also note that past performance is not a reliable indicator of future results. Actual results may differ materially from those anticipated in forward-looking or past performance statements. We assume no liability as to the accuracy or completeness of any of the information and/or content provided herein and the Company cannot be held responsible for any omission, mistake nor for any loss or damage including without limitation to any loss of profit which may arise from reliance on any information supplied by TFA Global Pte Ltd.
The speaker(s) is neither an employee, agent nor representative of Tradu and is therefore acting independently. The opinions given are their own, constitute general market commentary, and do not constitute the opinion or advice of Tradu or any form of personal or investment advice. Tradu neither endorses nor guarantees offerings of third-party speakers, nor is Tradu responsible for the content, veracity or opinions of third-party speakers, presenters or participants.

Gartley and math levels In this snapshot of price action on Brent crude we can see today would seem like an unqualified disaster for bulls. The pattern which has emerged from the chaos is an almost perfect gartley. If D anchor holds expect higher from here. Look for volume, rsi confluence.
The levels are precise mathematical and taken from highest volume not from high or low.

Zayed Al-Wasafi's excessive interest in targeting a price of $58Whatever we see from oil in the short term is considered a unique buying opportunity for astronomical and unprecedented goals in history, but for now we should think about the immediate goal!
Good luck
Brent Crude resistance at 6746The Brent Crude Oil is currently trading with a bearish bias, aligned with the broader downward trend. Recent price action shows a retest of the resistance, suggesting a further selling pressure within the downtrend.
Key resistance is located at 6746, a prior consolidation zone. This level will be critical in determining the next directional move.
A bearish rejection from 6746 could confirm the resumption of the downtrend, targeting the next support levels at 6550, followed by 6500 and 6424 over a longer timeframe.
Conversely, a decisive breakout and daily close above 6746 would invalidate the current bearish setup, shifting sentiment to bullish and potentially triggering a move towards 6800, then 6874.
Conclusion:
The short-term outlook remains bearish unless the Brent Crude Oil breaks and holds above 6746. Traders should watch for price action signals around this key level to confirm direction. A rejection favours fresh downside continuation, while a breakout signals a potential trend reversal or deeper correction.
This communication is for informational purposes only and should not be viewed as any form of recommendation as to a particular course of action or as investment advice. It is not intended as an offer or solicitation for the purchase or sale of any financial instrument or as an official confirmation of any transaction. Opinions, estimates and assumptions expressed herein are made as of the date of this communication and are subject to change without notice. This communication has been prepared based upon information, including market prices, data and other information, believed to be reliable; however, Trade Nation does not warrant its completeness or accuracy. All market prices and market data contained in or attached to this communication are indicative and subject to change without notice.
