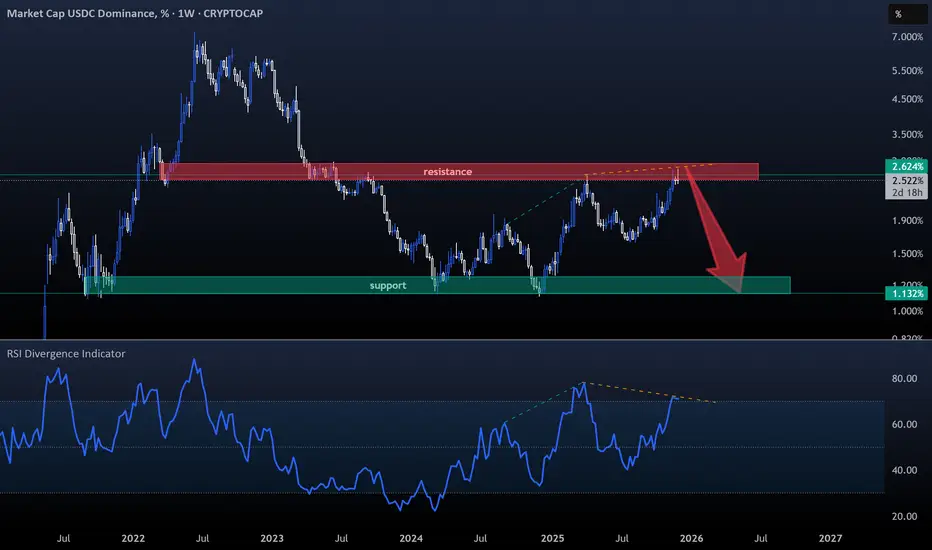
USDC DOM- I haven’t covered Circle’s stablecoin recently. Tether's USDT remains the clear leader at 6% Dom, but with USDC rising back to 2.5% Dom, it’s definitely worth watching again.
- The chart is simple, focus on the Weekly RSI and you’ll see a clear divergence developing on the weekly timeframe.
- So just keep an eye on USDC’s support around 1.1% (green zone) and it's resistance near 2.8% (red zone).
One Simple Rule : Stablecoins down = Bitcoin up.
Happy Tr4Ding !
Trade ideas
"Falling Knife" Stable Coins Dominance Analysis (1W)Hello everyone.
The entire crypto market is about to face a crucial decline.
There are many technical ways to show it.
I'm here today to show you one of them.
One of the best ways of examining the crypto market is checking the stablecoin dominance.
The most famous way to do it is simply looking at the USDT.D chart, which is extremely bullish right now.
The problem with that is, if stablecoin dominance is rising, it means the market is going down. Also vice versa.
We can also combine them to see more complex details to understand what is about to happen in the near future.
Right now, you're looking at the “USDT.D + USDC.D” chart, so they are combined.
The problem here is, this chart is extremely bullish on the weekly timeframe.
It means extremely bearish for the entire crypto market.
There is a very common pattern known as a “triple bottom,” which is about to break. Moreover, a broken trendline on the weekly timeframe simply means that the trend is not likely to end very soon.
We might be witnessing a very bearish market next year.
Be prepared.
Good luck.

More Clues Towards Bearish MovesCRYPTOCAP:USDC.D CRYPTOCAP:TOTAL2 CRYPTOCAP:OTHERS
USDC.D - Similar to USDT.D: Inverse Correlation to TOTAL. Mostly Inverted, there are sections where they take the same train. As USDC.D rises, capital rotates from assets to the stable coin, signaling "risk-off" behavior.
Candles are forming in the wedge and respecting the trend lines so far. But volume has been on the rise since the beginning of this year 2025 and could be preparing to break through the upper trend line.
There was a bounce off the bullish 0.5 ratio in July, this is bullish clue and suggests momentum to the upside, as volume shows the evidence.
There is a wonky ascending H&S pattern that generally leads to a bearish move, but only after the right shoulder formation is complete. Given, that the wave top of 2022 was at the 2.272 retracement, It's possible that the strong ratio could be the target this wave up once again: inside the 0.618 Golden Window.
Price was rejected by 1.272 late September and looks like a re-test is on. It could get rather choppy in this area, but it looks set to break through that ratio sometime soon. This looks like an LPS Wyckoff event where bullish moves traditionally follow. Bullish moves in this chart = Bearish moves in the market.
I will be on the sidelines watching as price action unfolds, If this turns out to be a MM trap to scare players out of the market before the rally up, I can always re-enter. I would rather preserve my capital then possibly watch it go red because of FOMO psychological behavior.
This is what I am personally doing, and do not recommend anyone to follow my strategy, this is what works for me and my skill level. With out a doubt, there are plenty of players out there making profit from sniper entry's and exit's.
Good Luck Traders!
-Not Financial Advice-


USDC.D + USDT.D updateTracing well!
Looks like a fib extension intercept on the lower rail at the very end of July 25/extremely early August 25 (= Estimated Altcoin top)
Will match what BTC.D is looking to do as well.
WE ARE ON THE PRECIPICE
Insanity will follow!
Not financial advice

Wen Crypto Rally?If we want #CryptoRally , then first of all #usdc dominance must break down daily EMA200 i highlighted in the chart. If this support plays out well, then mid term W bounce of #usdcd must continue. And also in BTCXAU chart, 33 must be broken to be bullish for BTC.

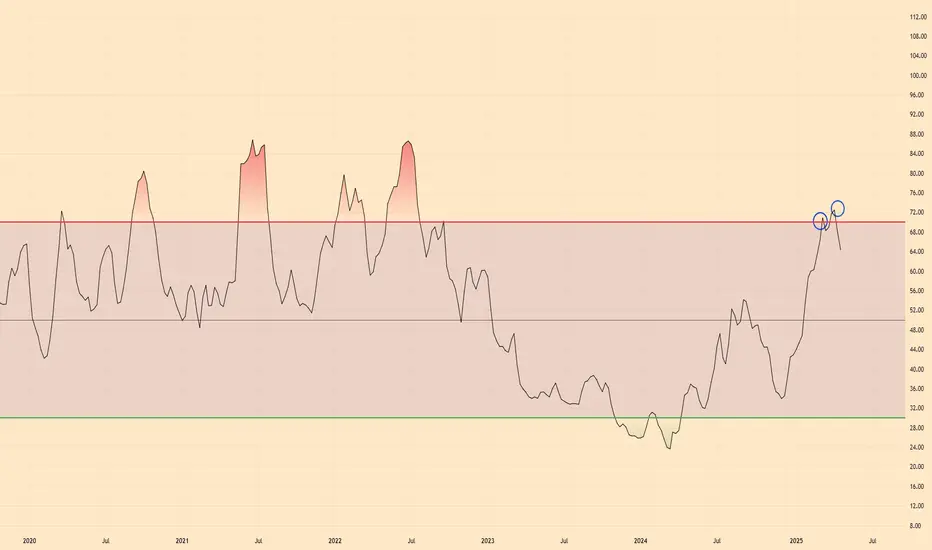
$USDC | Altseason Incoming.....FinallyCRYPTOCAP:USDC Dominance looks to be Double Topped on the RSI side and per historic movements, this looks promising for the market.
I say, BRING ON THE ALTCOINS.

Ding Dong altcoin bullrunC'MON ALREADY lol
Waiting for cash positions in crypto to reduce
Not financial advice

USDT USDC DOWNTIME? Come on, potential for bearish divergence on weekly with end of may ish target
GLA
Not financial advice

Failure is void.Given the volume movement near the resistance, this breakout seems to be invalid and will move the candles downwards, we are waiting for positive news.

USDC dominance is heating!#usdc CRYPTOCAP:USDC dominance chart has double bottomed in big picture and ready to move on. There will be 2 facts:
1- BTC and ALTCOINS will continue the correction.
2- (And + Or) #usdt dominance downfall with FUDs.

USDC.D + USDT.D to predict end of bull runBull run ends when the red support is touched?
Bull channel + price gravitates to volume node
Not financial advice

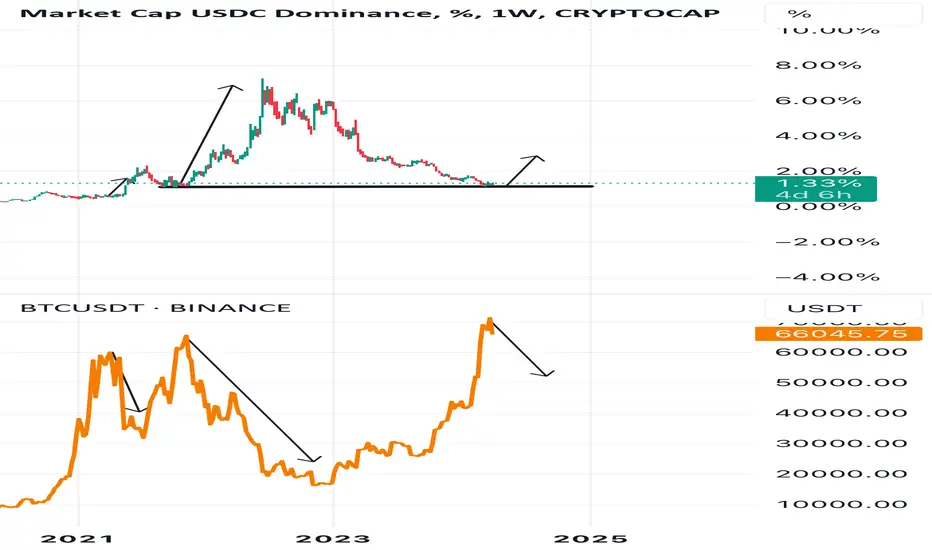
USDT vs USDC The Last Rush- Everything is in the chart.
- So my own deduction ( and only my own ) is : " Actually BTC not dipped so much "
- They pushed it hard, many peoples turned their BTC and Altcoins to USDT/USDC for safety.
- BTC is still not yet considered as a reserve like Gold in case of crises, peoples still scare and back really fast to the old paper money system when panic is around.
- i will link following this post a PAXG/BTC Chart to show what happened when BTC dipped.
- just look at indicators and you will clearly understand how much stables coins pushed high and Mooned/Marsed in the red " Overbought " Zone.
- Results : TheKing is still around 20k.
- that said, we can notice that USDC is gaining much more interests than USDT, just because USDC (Circle) is backed by cash and short-term U.S. government bonds as collateral.
- after the "LUNA-UST" Crash peoples started to fear and they are right, so they turned their Stables to USDC.
- in near future, USDC will gains more dominance on USDT and the next Dip could results in an Equal Dominance ( 3.80% - 3.20% )
i hope this post help to understand the situation, be H4ppy and St4y S4fe !
Happy Tr4Ding !

USDC.D In a Wyckoff Distribution range - Breakdown imminentUSDC.D Looking bearish as hell here in its Wyckoff distribution range. Compare it to USDT.D and see the similarities.
The difference being USDC.D is leading here and weaker, compared with USDT.D. Both still look great for the downside here and its only a matter of time before they roll over and the market runs to new highs!
USDC.D:
USDT.D:
Once this breaks down with USDT.D, we are in for the next bullish expansion in the market to new ATHs!

USDT.D UP !!Gauss channel on 3 day time we have a breakout and a retest. Do not expect the market to grow, but to drop. Bitcoin at least 40k will go!


When Will "Real" Bullish Run Is Starting?This parameters basically shows you the cash money investors holding in their pockets right now.
Currently, Total Blockchain market has 2.28 Trillions of dollars inside.
USDT and USDC are most commonly used stable coins if we don't include FUSD which is not going to be mentioned in this section.
Let's assume that all Bitcoin investors and traders holding their dollars and whatever currency they're using in stable coins.
According to this hypothesis, all USDT Dominance level (approximately) currently is; %4.81
Also approximately all USDC Dominance Level currently is; %1.45
When you check the major addresses on chain data that holding bitcoin right now, you'll notice that their breakeven levels is coming closer. So it's basically means that they are buying more and more whenever the price goes lower. Especially, Coinbase whales and major addresses helped us to recover on Bitcoin after the last crash. Historically, it's a good idea to follow this guys before invest. They are the ones who simply runs the market.
Let's go back to the chart and examine the Red Key Levels on the chart.
First Key Level that broke below through %8 gave us a minor bullish run. Not all coins that you trade all day maybe but Bitcoin consumed most of the money that comes with the benefits of ETF's. It will happen again, Bitcoin will dominate the entire market ones more. Bitcoin mostly will rise all alone and the other altcoins (especially top 100) will watch from behind. It's simply because of ETF's. EMA 100 is about the broke (Daily) while I'm writing this which is an important indicator that I'm using in parameters like this.
All short term price action basics and indicators simply telling me that Bitcoin may see another drop for a week or more but it won't matter if you can resist against it. Just hold on for a couple of more days and wait.
Hong Kong and London are about to start an ETF' run (London is a little bit different but doesn't matter).
Halving is about to come within a few hours which is the most bullish thing this market will ever see in its entire life.
When the Red Key Level is broken (Let's say closing a week below %3.74) you will see Bitcoin in a level which you probably never expected. I expect Bitcoin to reach at least 200.000 $ until this real bullish run ends. When the 3.74 broke, Bitcoin will rise but ALTs may not due to ETF's and Bitcoin Dominance. If you are a trader, just focus on the chart, if you are an investor read below carefully.
Basically, it doesn't matter if the price goes low or lower anymore. When you see the price is dropping, DO NOT be the ones who scare and run away. They are the ones we need to keep this market alive. Do not be market's liquidity, be the one who consumes it.
If you see the price low, you BUY.
If you see the price is going lower, you BUY AGAIN, and again, and again, and again.
This is where the real bullish run begins.
Good Luck to us all.

Usdc idea So we can compare the charts with btc. Every time Usdc goes up btc drops . And see it’s testing the support right now. Btc is looking bearish looks like bulls are losing momentum . I think we see a more pullback on btc before a recovery rally to 80k for know I would be cautious maybe set buy orders around 55k . I don’t know how low it can get . We all know how volatile btc is so if this idea gets invalidated don’t be surpriced.
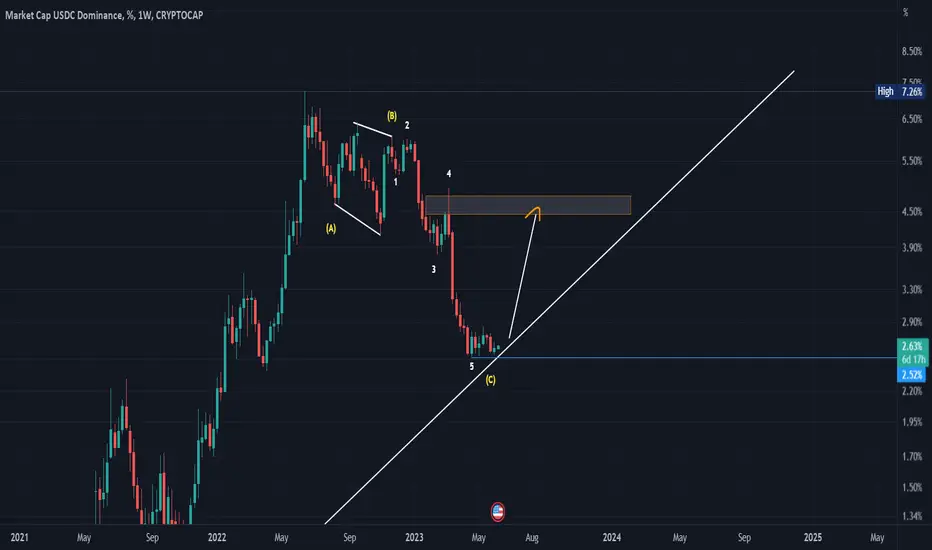
usdc.dA decline has been completed in three waves, and currently the assembly begins for a new upward wave, with the most important condition that it does not break the current bottom area and closes below it 2.52%
Bearish BTC,Bitcoin Hi There, dont be on fearful side , it is correct I am on bearish camp but I think Btc could bounce well from 25500-26500 and we see some big resistances on Stabelcoin charts ......eventually Btc is bearish but in time factor it needs to shake out more people and annoy Short side traders .
Please let me know your idea, comment below.
Stay cautious and accept responsibility of your decision ,,,,.

📈 USDC Dominance | Additional ConfirmationThis one is more revealing than the Tether Dominance chart.
Here we can see USDC.D trading below the 0.5 Fib. retracement level which is now a resistance and also 5-Nov-2022 low which worked as support last year and lead to a bullish wave.
Losing this support indicates that the bears are weak, have no hope of winning this battle and so Cryptocurrency, Bitcoin and the Altcoins, are set to continue growing.
Here instead of a bear flag what see is the candles digging lower and lower, slowly.
The inverse of a slow and steady growth, slow and steady decline which is a signal of bearish strength and bearish accumulation.
All positive news for our beloved Bitcoin and the Altcoins.
Oh wait, a reversal can surely happen but strong resistance lays ahead. So a bounce on the index would be temporary based on the current chart.
Namaste.

📈 USDC Dominance Reveals A Potential $30,000 BitcoinWhile Tether Dominance is still holding above EMA50 as support on the weekly timeframe, USDC Dominance has gone below... Revealing what's to come.
EMA50 is a very important level specially on the weekly timeframe, as it becomes 7x stronger than the daily.
Here we can see decisively that USDC.D closed below EMA50 last week. This weeks candle/session only work as confirmation as well as the RSI which continues trending lower, the index becoming weaker, hitting its lowest reading in almost three years.
Here is the interesting part, the next target is set to be hit around 3.43% which is the same level as in the week of 9-May 2022.
At that time Bitcoin was trading between a low of $25,000 to a high of $34,000. A wide range but the open of the week happened at $34,000 and the close at $31,000...
Telling us that within a month (days?), more or less, we can see Bitcoin around $30,000 by comparison.
Namaste.
