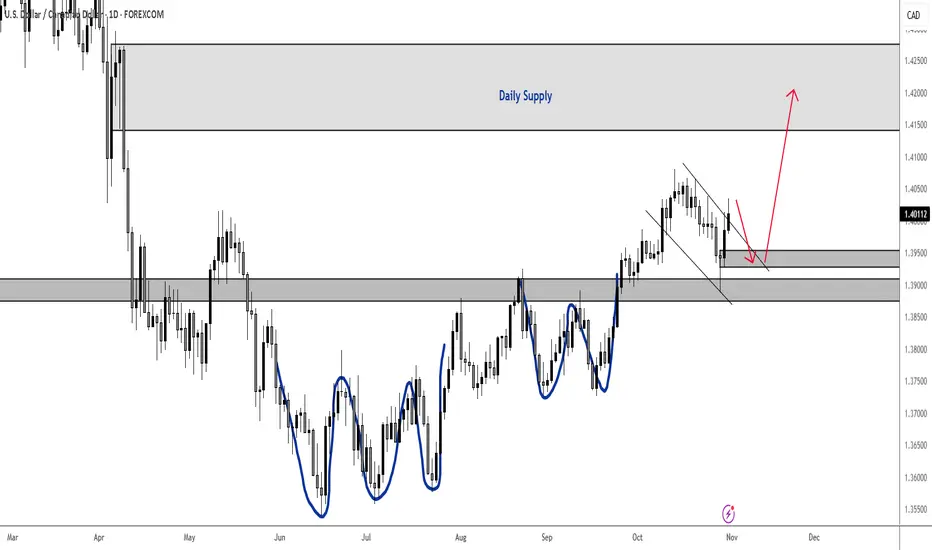
USDCAD Daily TF Bullish Continuation PatternsPrice has dipped into a high confluence zone on the daily TF and now I am expecting some kind of pullback on LTF to confirm long entries to daily supply.
Trade ideas
USDCAD-LONG IDEAUSDCAD is in bullish trend according to higher time frame it has retraced back to 0.5 fib level according to daily time frame now we can expect a further upside move as the internal structure on 1h is also broken and changed. DXY is also bullish this will take all the dollar pair with it. so mark your order using buy limit. do your own research before taking any trade.

USDCAD SELLSHere we see the same scenario as the USDXXX pairs discussed my previous analyses. I have two supply areas are am looking at to short at. I have explained DXY in depth so I won't have to go into too much detail on this. Please refer to my DXY analyses so understand this more.
Kindly manage risk. Best Of Luck!

USD Cad Buy last trade before All Saints DayWas looking at Eurusd and Usdcad for a potential trade and ended up with USDCAD for a buy. I can see that previous days market had alot of activities going on, couple of high impact news as catalyst to make price volatile. Was waiting for any move coming London that time and lo and behold we had a nice break from asia. The good thing about this trade is that the break was able to reach previous days high and ranged. Took a position on 1.4 price range. Expectation on this trade coming NY is that it would not run as much as there are no catalyst news events that will drive the price xrazy and that its coming to a holiday the following day. Targetted 2:1 RRR on this one to finish the day. The move was 25 pips when NY overlaps London. Had 2 positions for a total of 50 pips to finish the day.

USD/CAD: Short-Term Correction 🔹 COT (Commitment of Traders)
(Last update: September 23, 2025 – data not refreshed due to the U.S. government shutdown)
USD Index (ICE Futures)
Non-commercial longs: 14,032 (+1,541)
Non-commercial shorts: 24,376 (−1,009)
→ Institutional traders were closing shorts and adding longs, signaling early signs of bullish bias on the USD before the shutdown halted updates.
Canadian Dollar (CME Futures)
Non-commercial longs: 18,035 (−2,940)
Non-commercial shorts: 132,841 (+4,689)
→ Heavy short build-up on CAD alongside long reduction — a bearish institutional sentiment for the Canadian Dollar.
Even with outdated data, the COT positioning remains USD bullish / CAD bearish, supporting a medium-term upside bias on USD/CAD.
🔹 FX Sentiment (Retail Positioning)
56% short / 44% long
📌 Retail traders are slightly net short, providing a contrarian bullish signal for USD/CAD — aligning with institutional positioning.
🔹 Seasonality
Historically, October shows mild positive bias for USD/CAD on long-term averages (15–20 years), but the 5-year tendency is slightly negative.
Neutral-to-mildly bullish for late October, with stronger USD seasonality emerging in November–December.
🔹 Price Action
The pair remains within a rising parallel channel from July lows, recently rejecting the upper boundary near 1.4100 and showing early signs of structural fatigue.
Price is now consolidating between 1.4000–1.3900, with bearish momentum slowly building up.
Technical Levels:
Resistance: 1.4050–1.4100
Support zone 1: 1.3900
Support zone 2 (major): 1.3700
RSI: showing divergence with lower highs, signaling potential corrective leg ahead.
🎯 Main Scenario:
A short-term retracement toward 1.3850–1.3800 remains likely if 1.3900 breaks, while the broader bullish trend remains intact unless price closes below 1.3700.
Bias for now → Short-term corrective, medium-term bullish.
Invalidation: daily close below 1.3700 (trendline + demand break).

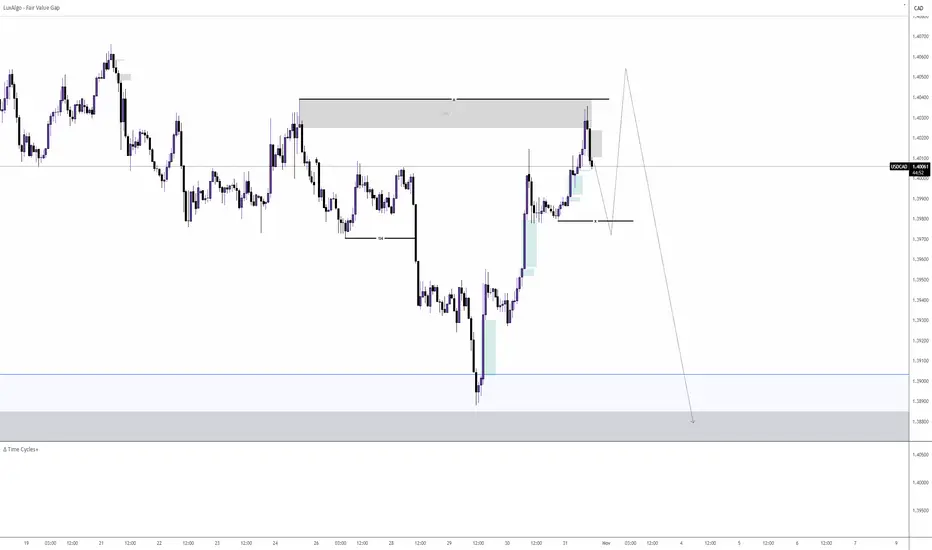
USDCAD: Seeking a bullish retest next week Daily chart supports buys with hidden bullish divergence acting a major confluence. After a recent rejection away from the Weekly FVG, I'll be monitoring how the latest Daily FVG holds-up for further support. Ideally, a BOS then retest (as indicated) would provide clearer confluence to a long position.
I like:
- Daily timeframe
- Hidden bullish divergence
- Clean air above (no significant resistance to the left of the chart)
- Recent fundamentals and easing trade war tensions
I don't like:
- The end of quantitative tightening for the USD.
- Uncertainty over further FED cuts
- Probability price maintains 1.4000 level

USDCAD: Expecting Bearish Continuation! Here is Why:
The price of USDCAD will most likely collapse soon enough, due to the supply beginning to exceed demand which we can see by looking at the chart of the pair.
Disclosure: I am part of Trade Nation's Influencer program and receive a monthly fee for using their TradingView charts in my analysis.
❤️ Please, support our work with like & comment! ❤️

USDCAD: Momentum Falters as Bears Eye Deeper CorrectionAfter a strong run higher, USDCAD is now showing signs of exhaustion. Price action has slipped below a short-term trendline, and with CAD fundamentals anchored by oil prices, the pair looks increasingly vulnerable to a pullback. The recent stalling near 1.4070 suggests buyers may be losing grip, opening the door for sellers to drive a corrective wave lower.
Current Bias
Bearish – momentum has shifted, with lower highs forming and trendline support already breached.
Key Fundamental Drivers
USD: Fed officials remain cautious on cutting rates too quickly, but sticky inflation risks could limit downside in the dollar.
CAD: Supported by oil market stability and resilient wage data, even as broader growth remains soft.
Relative Outlook: CAD gains the upper hand in commodity-driven environments, particularly when oil stays bid.
Macro Context
Interest Rates: Fed is on a slower path to easing compared to the BoC, but markets have priced in eventual US rate cuts.
Economic Growth: US growth is slowing but still outpacing Canada, though oil revenues balance the picture for CAD.
Commodity Flows: Oil prices remain the most critical support for CAD. Any extended rally in energy prices strengthens downside bias in USDCAD.
Geopolitical Themes: US trade tensions and global policy risks feed USD volatility, while CAD’s link to oil offers a clearer directional driver.
Primary Risk to the Trend
A sudden drop in oil prices or a hawkish Fed surprise could lift USD and break bearish momentum in USDCAD.
Most Critical Upcoming News/Event
US PCE inflation and labor market data.
Canada employment and CPI releases.
Weekly oil inventories and OPEC+ commentary.
Leader/Lagger Dynamics
USDCAD often trades as a lagger, following USD moves against majors like EURUSD or DXY. It also shadows oil fluctuations, making CAD more reactive than proactive.
Key Levels
Support Levels: 1.3910, 1.3818, 1.3738
Resistance Levels: 1.4029, 1.4079
Stop Loss (SL): 1.4079
Take Profit (TP): 1.3818 (first), 1.3738 (extended)
Summary: Bias and Watchpoints
USDCAD is leaning bearish after breaking below its short-term trendline, with price action suggesting a correction toward 1.3910 and potentially 1.3818. The trade setup favors shorts with SL above 1.4079 to protect against Fed-driven dollar spikes. CAD strength remains tied to oil, so energy headlines are crucial watchpoints. While USD remains fundamentally supported, the short-term flow favors sellers, making this a correction opportunity rather than a trend reversal.

USD/CAD sell ideaAfter USD/CAD dumped from the 1.40287 resistance zone on friday, October 24th, it has now retraced back to the same level a week later friday, October 31st. This zone is proving to be a key resistance area once again. We could potentially see another rejection or pullback from here.

USDCAD possible fall!USDCAD could be falling today getting into NY session. Waiting for confirmation aa it has been struggling passing the zone it is at.

possibility of uptrendConsidering the price behavior in the current resistance area, possible scenarios have been identified. The price is expected to break through the resistance area and the continuation of the upward trend will be formed.
USDCAD BULLISH MOVEMENTOur analysis is based on a multi-timeframe top-down approach and fundamental analysis.
Based on our assessment, the price is expected to return to the monthly level.
DISCLAIMER: This analysis may change at any time without notice and is solely intended to assist traders in making independent investment decisions. Please note that this is a prediction, and I have no obligation to act on it, nor should you.
Please support our analysis with a boost or comment!

USDCAD LONG HELLO
Mid term long position usdcad pair
dxy will up to next 2 weeks
Entry today
TP 1.41588

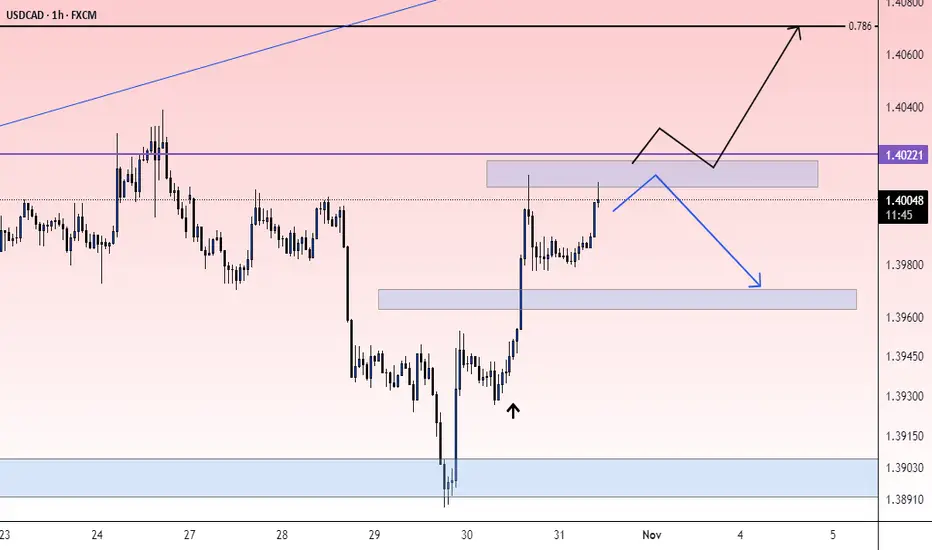
USDCAD — Fib Retracement Rejection & Bullish Continuation SetupUSDCAD is respecting the Fibonacci retracement structure after pulling back from the 1.4078 swing high. The pair retraced toward the 0.618–0.786 zone (1.3818–1.3729), showing strong buying interest near trendline support. This reaction suggests that bullish momentum may resume if price maintains above 1.3820.
Key Technical Levels:
Resistance: 1.4078 (recent high), 1.4250 (long-term target zone)
Support: 1.3818–1.3730 (Fib retracement + trendline confluence)
Extension Target: 1.4250–1.4300 (1.272–1.414 projection)
Outlook:
Price is forming a potential higher low structure aligned with the ascending channel. As long as the structure holds above 1.3800, the next wave higher could target 1.4078, followed by 1.4250.
A daily close below 1.3730 would invalidate the bullish setup and open room for deeper retracement toward 1.3630 (1.272 Fib extension).
Bias:
Bullish continuation favored while price remains above 1.3800, supported by USD resilience and weakening CAD due to softer oil sentiment.

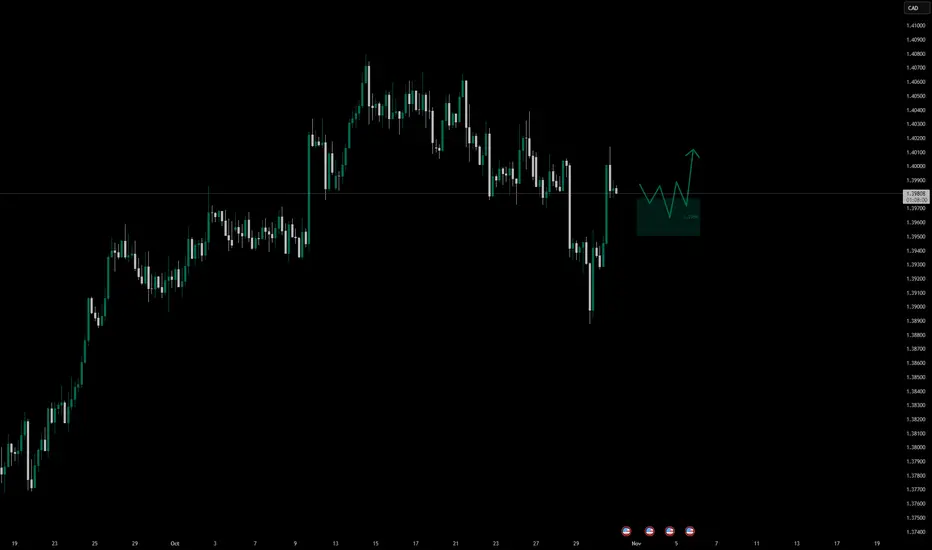
USDCADUSDCAD
Monitoring the 1.39640–1.39500 zone for a potential bullish continuation, provided the structure remains intact.
⚠️ Wait for price to reach this zone before considering any long positions — patience is key here.
Use your own entry model and apply strict risk management, ideally risking no more than 1% per setup.
Trade with confirmation; never chase a moving market.
Bearish reversal of major resistance?USD/CAD is reacting off the resistance level, which is an overlap resistance that is slightly above the 61.8% Fibonacci retracement and could drop from this level to our take profit.
Entry: 1.4022
Why we like it:
There is an overlap resistance that is slightly above the 61.8% Fibonacci retracement.
Stop loss: 1.4079
Why we like it:
There is a swing high resistance level.
Take profit: 1.3890
Why we like it:
There is an overlap support level.
Enjoying your TradingView experience? Review us!

SELL USDCAD RIGHT NOWIm only think about share idea like memo my trade setup
how im thinking about market
Weekly commercial is still bullish
Downtrend is dominance in daily chart
H12,H4 price is up by new release
After new
Sell drop base drop is good trend following set up

USD/CAD – 15M ChartPrice has made a huge steady move up over the last 6–7 hours and is now coming into medium resistance.
🔹 Momentum is extremely strong at 92 and beginning to hook down.
🔹 On watch for a possible reversal setup which would require:
Clear structure signal
Divergence on momentum
Volume > 80 (15M chart needs stronger-than-normal volume)
This one is firmly on the watchlist today — patience until the full setup aligns.

Long trade
📘 Trade Journal Entry
Pair: USDCAD
Direction: Buy-Side Trade
Date: Thu 30 Oct 25
Time: 3:45 am
Session: London Session AM
Timeframe: 15 Min
🔹 Trade Details
Metric Value
Entry 1.39432
Profit Level (TP) 1.40009 (+0.41%)
Stop Level (SL) 1.39294 (–0.10%)
Risk–Reward (RR) 3.76 R
🔸 Technical Context
Market Structure:
Price has been consolidating after a prolonged down-move, forming an accumulation range near the 1.3920 handle. During the London open, price swept liquidity below Asian lows, then produced a CHOCH (15m) and BOS, signalling reversal intent.
Key Zones:
Demand Zone: 1.3920–1.3930 (accumulation block, liquidity sweep)
Target Zone: 1.4000 psychological round number (prior London high)
Adaptive MA (KAMA): Now turning upward, supporting directional bias.
5min TF overview
Confluences:
Liquidity grab below 1.3930 confirmed with strong bullish candle.
Structure break with follow-through volume.
Session timing: London liquidity injection during transition from Tokyo.
USD strength theme across correlated pairs (EURUSD + GBPUSD).
🔹 Narrative & Bias
The setup plays into the USD strength narrative developing across the London session, with correlated weakness seen in EURUSD and GBPUSD.
After stop hunts beneath the Asian low, the 15-minute structure confirmed bullish reversal, creating a clean FVG and demand zone confluence for entry.
Projection:
Expect price to continue toward 1.4000–1.4020, with potential retrace at mid-range (1.3970). Should momentum sustain, continuation into New York could extend target levels.

USDCAD - Signal#USDCAD - Signal
H4 - Formation of the 3rd wave + breakout of the trend line. Stop at the low of the 2nd wave.
Entry: 1.39561
TP: 1.39834 - 1.40391 - 1.41187 - 1.41979
Stop: 1.39255

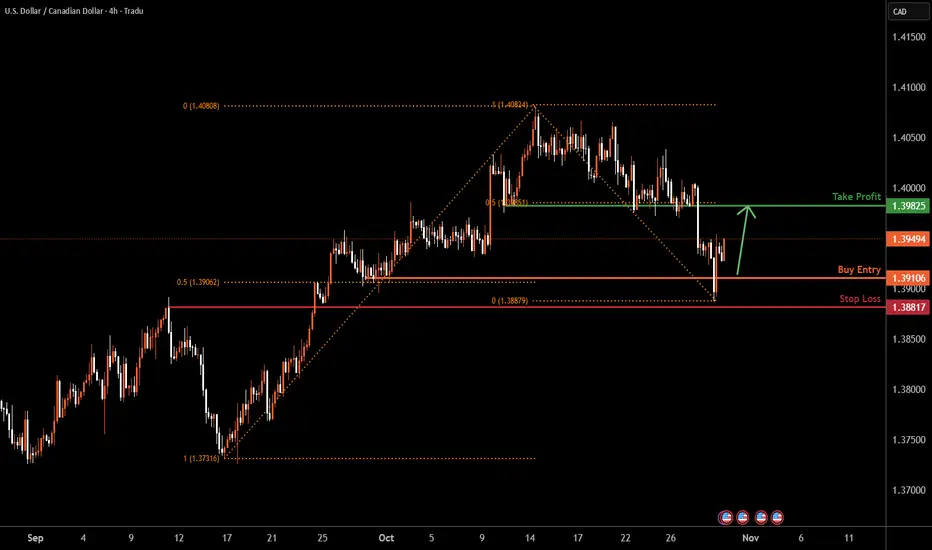
USDCAD H4 | Potential Bullish Bounce Off SupportBased on the H4 chart analysis, we can see that the price has bounced off the buy entry, which is a pullback support that lines up with the 50% Fibonacci retracemnt and could rise from this level to the take profit.
Buy entry is at 1.3910, whichis a pullback support that lines up with the 50% Fibonacci retracement.
Stop loss is at 1.3881, whichis a pullback support.
Take profit is at 1.3982, which s a pullback resistance that lines up with the 50% Fibonacci retracemnt.
Stratos Markets Limited (tradu.com ):
CFDs are complex instruments and come with a high risk of losing money rapidly due to leverage. 68% of retail investor accounts lose money when trading CFDs with this provider. You should consider whether you understand how CFDs work and whether you can afford to take the high risk of losing your money.
Stratos Europe Ltd (tradu.com ):
CFDs are complex instruments and come with a high risk of losing money rapidly due to leverage. 70% of retail investor accounts lose money when trading CFDs with this provider. You should consider whether you understand how CFDs work and whether you can afford to take the high risk of losing your money.
Potential bullish reversal?The Loonie (USD/CAD) has bounced off the pivot and could rise to the 1st resistance.
Pivot: 1.3913
1st Support: 1.3864
1st Resistance: 1.3981
Disclaimer:
The above opinions given constitute general market commentary, and do not constitute the opinion or advice of IC Markets or any form of personal or investment advice.
Any opinions, news, research, analyses, prices, other information, or links to third-party sites contained on this website are provided on an "as-is" basis, are intended only to be informative, is not an advice nor a recommendation, nor research, or a record of our trading prices, or an offer of, or solicitation for a transaction in any financial instrument and thus should not be treated as such. The information provided does not involve any specific investment objectives, financial situation and needs of any specific person who may receive it. Please be aware, that past performance is not a reliable indicator of future performance and/or results. Past Performance or Forward-looking scenarios based upon the reasonable beliefs of the third-party provider are not a guarantee of future performance. Actual results may differ materially from those anticipated in forward-looking or past performance statements. IC Markets makes no representation or warranty and assumes no liability as to the accuracy or completeness of the information provided, nor any loss arising from any investment based on a recommendation, forecast or any information supplied by any third-party.
