USDCAD | Bearish Reversal Forming at Overlap ResistanceBased on the M30, we can see that the price is reacting off the sell entry whic is an overlap resistance and could drop from this level to the downside.
Sell entry is at 1.4004, which is an overlap resistance.
Stop loss is at 1.4019, which is a pullback resistance that aligns with the 61.8% Fibonacci retracement.
Take profit is at 1.3978, which is a multi swing low support.
Stratos Markets Limited (tradu.com ):
CFDs are complex instruments and come with a high risk of losing money rapidly due to leverage. 68% of retail investor accounts lose money when trading CFDs with this provider. You should consider whether you understand how CFDs work and whether you can afford to take the high risk of losing your money.
Stratos Europe Ltd (tradu.com ):
CFDs are complex instruments and come with a high risk of losing money rapidly due to leverage. 70% of retail investor accounts lose money when trading CFDs with this provider. You should consider whether you understand how CFDs work and whether you can afford to take the high risk of losing your money.
Trade ideas

Bullish momentum expected?The Loonie (USD/CAD) is falling towards the pivot, which is a pullback support and could bounce to the 61.8% Fibonacci resistance.
Pivot: 1.3913
1st Support: 1.3753
1st Resistance: 1.4152
Disclaimer:
The above opinions given constitute general market commentary, and do not constitute the opinion or advice of IC Markets or any form of personal or investment advice.
Any opinions, news, research, analyses, prices, other information, or links to third-party sites contained on this website are provided on an "as-is" basis, are intended only to be informative, is not an advice nor a recommendation, nor research, or a record of our trading prices, or an offer of, or solicitation for a transaction in any financial instrument and thus should not be treated as such. The information provided does not involve any specific investment objectives, financial situation and needs of any specific person who may receive it. Please be aware, that past performance is not a reliable indicator of future performance and/or results. Past Performance or Forward-looking scenarios based upon the reasonable beliefs of the third-party provider are not a guarantee of future performance. Actual results may differ materially from those anticipated in forward-looking or past performance statements. IC Markets makes no representation or warranty and assumes no liability as to the accuracy or completeness of the information provided, nor any loss arising from any investment based on a recommendation, forecast or any information supplied by any third-party.

Bearish drop off for the Loonie?The price has reacted off the resistance level, which is a pullback resistance and could potentially drop from this level to our take profit.
Entry: 1.4003
Why we like it:
There is a pullback resistance level.
Stop loss: 1.4027
Why we like it:
There is a swing high resistance level.
Take profit: 1.3969
Why we like it:
There is a pullback support level.1
Enjoying your TradingView experience? Review us!
Please be advised that the information presented on TradingView is provided to Vantage (‘Vantage Global Limited’, ‘we’) by a third-party provider (‘Everest Fortune Group’). Please be reminded that you are solely responsible for the trading decisions on your account. There is a very high degree of risk involved in trading. Any information and/or content is intended entirely for research, educational and informational purposes only and does not constitute investment or consultation advice or investment strategy. The information is not tailored to the investment needs of any specific person and therefore does not involve a consideration of any of the investment objectives, financial situation or needs of any viewer that may receive it. Kindly also note that past performance is not a reliable indicator of future results. Actual results may differ materially from those anticipated in forward-looking or past performance statements. We assume no liability as to the accuracy or completeness of any of the information and/or content provided herein and the Company cannot be held responsible for any omission, mistake nor for any loss or damage including without limitation to any loss of profit which may arise from reliance on any information supplied by Everest Fortune Group.

USDCAD TRADE SETUPWait for break and retest the entry level then take a trade for Sell otherwise skip this setup

Trading Secrets #1-USDCAD – Bullish Setup Forming Above Key EMAs📈 USDCAD – Bullish Setup Forming Above Key EMAs
USDCAD is showing a clean bullish structure:
Price is trading above the 20 EMA, 50 EMA, and 200 EMA – confirming an overall uptrend.
The latest candlestick formed a spinning top / long upper shadow while touching the 20 EMA support zone.
This indicates fear and hesitation from buyers, but at the same time, sellers failed to push price below the 20 EMA.
🟢 Bullish Bias:
As long as price holds above the 20 EMA, I expect buyers to step back in and push USDCAD higher.
A breakout above the recent candle’s high could confirm bullish continuation.
⚠️ Invalidation Level:
A clean break and close below the 20 EMA could weaken this setup and shift momentum.
Key Levels to Watch:
Support: 20 EMA / dynamic zone
Resistance: Recent swing high
Trend: Bullish above 50 EMA and 200 EMA
💬 This is not financial advice. For educational purposes only.
Downtrend in USDCADSince the price has penetrated the important MPL range, we expect the price to decline and we have two scenarios in mind. First, we can enter the trade by correcting to the specified range. Second, we can take the TB from here by stabilizing and accepting the risk.

Trading Map for USD/CAD — Bullish Layered Entry Strategy🦒 The Loonie Heist: USD/CAD Swing & Day Trade Wealth Map 🚀
Asset: USD/CAD ("The Loonie")
Outlook: Bullish 📈
Vibe: Thief-Style Layering Strategy — Sneaky, Smart, and Stylish 😎
Welcome, Ladies and Gentlemen, to the Loonie Heist! This USD/CAD trading plan is designed for the crafty traders out there — our Thief OG's — ready to layer up entries and snatch profits like pros. Let’s break down this stylish, rule-compliant TradingView idea that’s ready to steal the spotlight! ✨
📜 The Plan: Bullish Breakout with a Thief’s Precision 🕵️♂️
Strategy: Thief Layering — A multi-limit order approach for smooth, calculated entries.
Entry Levels: Deploy your buy limit orders like a mastermind at:
1.39300
1.39400
1.39500
1.39600
Pro Tip: Feel free to add more layers based on your risk appetite — scale it up, Thief OG style!
Stop Loss (SL): Set a sneaky SL at 1.39000 to guard your loot.
Note: This is my suggested SL, but you’re the boss of your trades — adjust to your risk tolerance! ⚠️
Take Profit (TP): Aim for 1.40500, just shy of the 1.40600 police barricade (a strong resistance zone with overbought signals and potential traps). Lock in profits and escape like a pro! 🏃♂️ Note: TP is your call — take the money when it feels right!
🔍 Why USD/CAD? Key Market Insights 🧠
Market Context: USD/CAD is riding a bullish wave, driven by USD strength and CAD’s sensitivity to oil prices. Keep an eye on macroeconomic data like US Non-Farm Payrolls and Canadian employment reports, as they can sway the Loonie! 📊
Technical Setup: The pair is testing key support levels around 1.39300–1.39600, making it a prime spot for layered entries. The 1.40600 resistance is a historical hurdle, so watch for price action there! 🚨
Thief’s Edge: By layering buy limits, you’re stacking the odds in your favor, catching dips and riding the trend with finesse.
💰 Related Pairs to Watch 👀
Keep these correlated pairs on your radar to spot opportunities and confirm trends:
OANDA:USDCHF ($): Positive correlation with USD/CAD due to USD strength. If USD/CHF is climbing, it could signal more upside for USD/CAD.
OANDA:AUDUSD ($): Negative correlation with USD/CAD. A falling AUD/USD (stronger USD) often aligns with USD/CAD bullish moves.
OANDA:NZDUSD ($): Similar to AUD/USD, this pair’s weakness can support USD/CAD’s bullish case.
Key Point: Watch oil prices (WTI, Brent) since CAD is a commodity currency. If oil weakens, USD/CAD may push higher! 🛢️
⚠️ Risk Management (Thief’s Code) 🛡️
Risk Disclaimer: Trading is a high-stakes game, and this Thief-Style Strategy is for fun and educational purposes. Always manage your risk, set your own SL/TP, and trade responsibly. Don’t chase the market — let it come to you!
Position Sizing: Adjust your lot sizes based on your account and risk tolerance. The Thief OG never risks the whole vault! 💸
✨ “If you find value in my analysis, a 👍 and 🚀 boost is much appreciated — it helps me share more setups with the community!”
Disclaimer: This is a Thief-Style Trading Strategy crafted for fun and educational purposes. Trade at your own risk, and always conduct your own analysis.
#Hashtags: #USDCAD #Forex #SwingTrading #DayTrading #ThiefStrategy #LoonieHeist #Bullish #TradingView
technical analysis of your chart for USD/CAD (15-minute timeframThe pair is moving within an ascending channel, indicating short-term bullish momentum.
Higher highs and higher lows confirm the ongoing uptrend structure.
🟦 Key Zone
Support Level: 1.3985 – 1.3990
This shaded zone represents a demand area where price previously found strong buying interest.
As long as this level holds, the short-term bullish bias remains valid.
🔹 Price Action Outlook
Price is currently testing the lower trendline of the channel and near the support zone.
A bullish reaction from this level could trigger a bounce toward the mid-channel and potentially the upper resistance.
🎯 Target
Upside Target: 1.4039
This corresponds to the upper boundary of the channel and a previous swing high area.
⚠️ Invalidation / Risk Level
A break below 1.3980 would invalidate the bullish setup and could lead to a bearish correction toward 1.3965 or lower.
📈 Trading Signal (Summary)
Bias: Bullish (short-term)
Entry Zone: 1.3985 – 1.3995 (support area)
Target: 1.4039
Stop-Loss: Below 1.3980 ICMARKETS:EURUSD ICMARKETS:GBPUSD ICMARKETS:USDJPY ICMARKETS:GBPJPY ICMARKETS:AUDUSD ICMARKETS:USDCAD ICMARKETS:USDCHF ICMARKETS:NZDUSD ICMARKETS:EURJPY ICMARKETS:EURJPY ICMARKETS:AUDJPY ICMARKETS:EURGBP ICMARKETS:GBPAUD ICMARKETS:USDZAR ICMARKETS:USDDKK

USDCAD H1 | Quick takePrice rejected the 1.4040 1.4050 supply and is pulling back toward the 1.3960 1.3975 demand zone (blue base of the prior breakout).
As long as buyers defend that zone, a bounce toward 1.4025 then 1.4050 is likely.
A clean close below 1.3960 shifts bias to downside and exposes 1.3925.

#036: USD/CAD Long Investment Opportunity
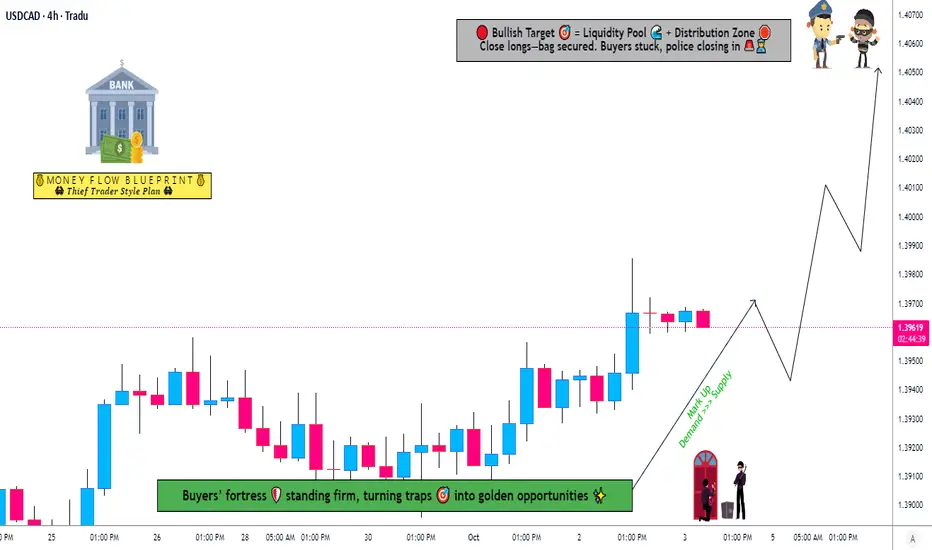
In recent days, the USD/CAD cross has shown a consolidation phase within a medium-term structure characterized by progressively higher lows and a gradual absorption of supply in the lower part of the range. Hello, I'm Forex Trader Andrea Russo, an independent trader and prop trader with $200,000 in capital under management. Thank you in advance for your time.
Observing the price behavior in the last 8-hour candles, we see how buyers have resolutely defended the support zone, repelling any attempts to decline with increasing volume and clear wicks below key levels.
This type of price action, typical of accumulation environments, suggests that strong hands are gradually building long positions in anticipation of a new bullish leg.
On a technical level, the break of intermediate micro-resistance, accompanied by growing momentum on the US dollar and a weakening Canadian dollar, increases the likelihood of an extension into higher liquidity areas.
This movement would be consistent with the rebalancing dynamic of order flow, which in recent sessions has shown a marked reduction in short-term pressure.
At the intermarket level, the weakening energy market continues to be a drag on the Canadian currency, historically correlated with oil prices.
At the same time, the stability of US yields and still-tight interest rate expectations keep the greenback in a position of relative strength.
In summary, the overall picture shows a favorable environment for a continuation of the bullish movement, provided the price maintains its current support structure and confirms solid closes above minor resistance levels.

USDCAD SellAs long as there is no 4-hour candle close above the supply zone, I anticipate the price will move to mitigate the demand zone, targeting approximately $1.394.

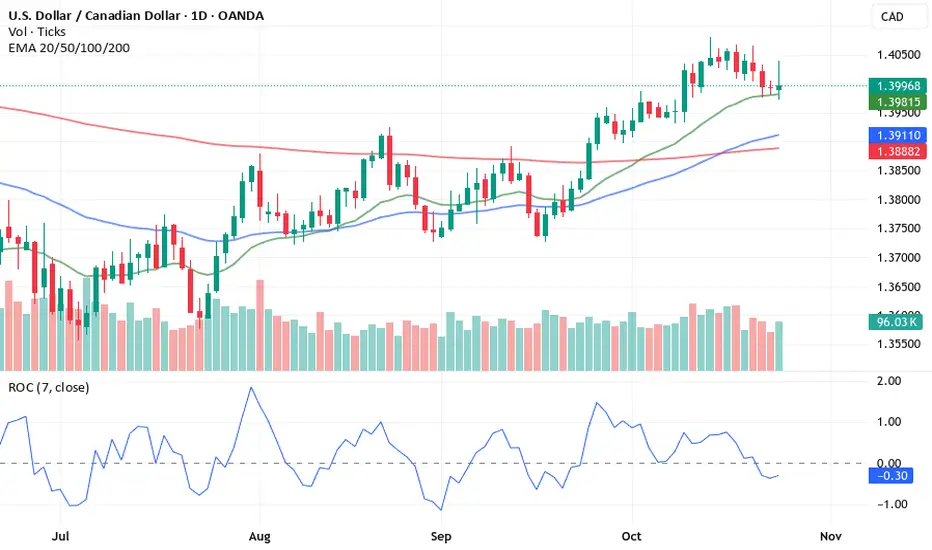
USDCADOn the daily timeframe, the market shows a clear bullish structure, characterized by a consistent sequence of higher highs and higher lows, confirming that bullish momentum remains dominant. The overall price action reflects strong buying pressure and structural integrity, suggesting a continuation of the upward trend.
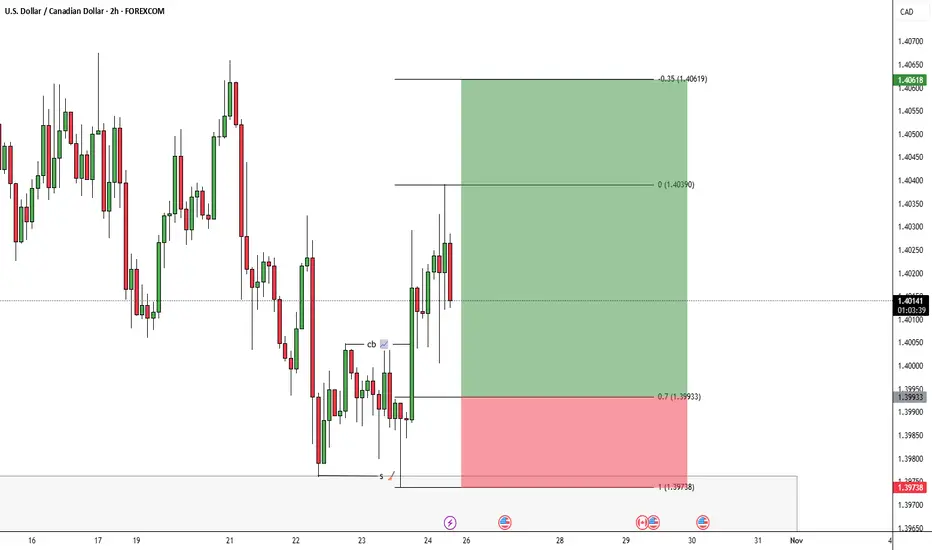
After identifying this directional bias, I scaled down to the 2-hour timeframe (H2) to look for a precise entry confirmation aligned with the main bullish structure. On this lower timeframe, a clear confirmation setup appeared — including a minor structure break, mitigation of the last point of interest, and signs of bullish volume entering the market. These confluences validated the continuation of the move in favor of the higher-timeframe trend.
The trade was planned with a 1:3 risk-to-reward ratio, ensuring efficient risk management while maximizing potential profit if the bullish impulse continues. The Take Profit (TP) was set at the projected extension of the impulsive leg, while the Stop Loss (SL) was placed just below the last relevant swing low to maintain structural consistency and protect the position.
In summary, this trade idea combines a higher-timeframe bullish structure, a lower-timeframe confirmation entry, and solid risk management, aiming to capitalize on the continuation of institutional order flow in the bullish direction.
USD/CADIt is very amazing chart 1h frame
Entry point 1.3600
stop loss below 1.39450 (93.4 point)
T1 1.39232 (325 Point)
T2 1.40417 (443 Point)
T3 141600 (558 Point)

USDCAD Will Fall! Short!
Please, check our technical outlook for USDCAD.
Time Frame: 4h
Current Trend: Bearish
Sentiment: Overbought (based on 7-period RSI)
Forecast: Bearish
The market is approaching a significant resistance area 1.402.
Due to the fact that we see a positive bearish reaction from the underlined area, I strongly believe that sellers will manage to push the price all the way down to 1.398 level.
P.S
Please, note that an oversold/overbought condition can last for a long time, and therefore being oversold/overbought doesn't mean a price rally will come soon, or at all.
Like and subscribe and comment my ideas if you enjoy them!

USDCAD H1 | Bearish Reversal in PlayLoonie (USD/CAD) has rejected off the sell entry which is a pullback resistance that aligns with he 50% Fibonacci retracement and could drop from this level to the downside.
sell entry is at 1.4020, which is a pullback resistance that lines up with the 50% Fibonacci retracement.
Stop loss is at 1.4043, which is a pullback resistance that lines up with he 78.6% Fibonacci retracement.
Take profit is at 1.3975, whic is a multi swing low support.
Stratos Markets Limited (tradu.com ):
CFDs are complex instruments and come with a high risk of losing money rapidly due to leverage. 68% of retail investor accounts lose money when trading CFDs with this provider. You should consider whether you understand how CFDs work and whether you can afford to take the high risk of losing your money.
Stratos Europe Ltd (tradu.com ):
CFDs are complex instruments and come with a high risk of losing money rapidly due to leverage. 70% of retail investor accounts lose money when trading CFDs with this provider. You should consider whether you understand how CFDs work and whether you can afford to take the high risk of losing your money.

USD/CAD showing scope for further outperformanceThe technical picture for USD/CAD remains optimistic. Since bottoming out in June/July, the pair has forged a series of higher highs and higher lows. This month witnessed a break of resistance between CA$1.3989 (1M) and CA$1.3948 (1Y), with price now seen retesting the area as support.
The lack of overhead resistance until the 3M level at CA$1.4197 suggests this could remain a market for buyers, and the test of CA$1.3948-CA$1.3989 could prove a base for dip-buyers. You may also note that this support area is positioned just under CA$1.4000, therefore potentially serving as an area to enter long from following the whipsaw of the big figure.
Written by the FP Markets Research Team

usdcad long Fundamental and candle stick , market structure
up to 1.39750
possible moving
swing long idea for 2 months

What kind of engine is driving the Canadian dollar to growth!!!The long-term trends of the Canadian dollar show a path to achieve the goals mentioned in the chart!
Of course, these figures are not without repetition and have been repeated in the past and will be available in the future. With patience, we will also reach this price target!
Good luck...

USDCAD Breaks Out After CPI – The Bullish Wave Is Rising!Hello traders!
USDCAD is showing strong bullish momentum after tonight’s U.S. economic data release. The annual CPI rose to 3.1% , higher than the forecast of 2.9% , signaling persistent inflation pressure and suggesting that the Fed may delay rate cuts . This has boosted the U.S. dollar, providing solid support for USDCAD to move higher.
On the H1 chart, price has broken above both the EMA34 and EMA89 resistance zones while holding firm above the key psychological level of 1.4000. This indicates a shift from consolidation to a short-term bullish phase. The current price structure is forming a W-pattern, with the next target around 1.4030.
If price continues to stay above 1.4000, buying pressure could drive USDCAD to break the upper boundary of the descending channel, opening the way toward 1.4050–1.4100. The overall short-term trend remains mildly bullish , supported by stronger-than-expected U.S. CPI data and the renewed strength of the USD.

USDCAD-LONG IDEAUSDCAD is at its major support level and its bullish on higher timeframe. Retracement on daily timeframe is almost done. Showing a bullish divergence on 30 min. most probably this will lead to break of structure on lower timeframe. So mark your buy stop orders at the given point and also do your own analysis before taking this trade.

Heading into major resistance?USD/CAD is rising towards the resistance level which is an overlap resistance that aligns with the 50% Fibonacci retracement and could reverse from this level to our take profit.
Entry: 1.4024
Why we like it:
There is an overlap resistance that aligns with the 50% Fibonacci retracement.
Stop loss: 1.4061
Why we like it:
There is a swing high resistance level.
Take profit: 1.3969
Why we like it:
There is a pullback support level.
Enjoying your TradingView experience? Review us!
Please be advised that the information presented on TradingView is provided to Vantage (‘Vantage Global Limited’, ‘we’) by a third-party provider (‘Everest Fortune Group’). Please be reminded that you are solely responsible for the trading decisions on your account. There is a very high degree of risk involved in trading. Any information and/or content is intended entirely for research, educational and informational purposes only and does not constitute investment or consultation advice or investment strategy. The information is not tailored to the investment needs of any specific person and therefore does not involve a consideration of any of the investment objectives, financial situation or needs of any viewer that may receive it. Kindly also note that past performance is not a reliable indicator of future results. Actual results may differ materially from those anticipated in forward-looking or past performance statements. We assume no liability as to the accuracy or completeness of any of the information and/or content provided herein and the Company cannot be held responsible for any omission, mistake nor for any loss or damage including without limitation to any loss of profit which may arise from reliance on any information supplied by Everest Fortune Group.

USD-CAD Free Signal! Buy!
Hello,Traders!
USDCAD Price is reacting from a well-defined horizontal demand area where previous sell-side liquidity was swept. Smart money may now be accumulating long positions for a bullish push toward the next liquidity pool.
-------------------
Stop Loss: 1.3975
Take Profit: 1.4020
Entry: 1.3995
Time Frame: 3H
-------------------
Buy!
Comment and subscribe to help us grow!
Check out other forecasts below too!
Disclosure: I am part of Trade Nation's Influencer program and receive a monthly fee for using their TradingView charts in my analysis.

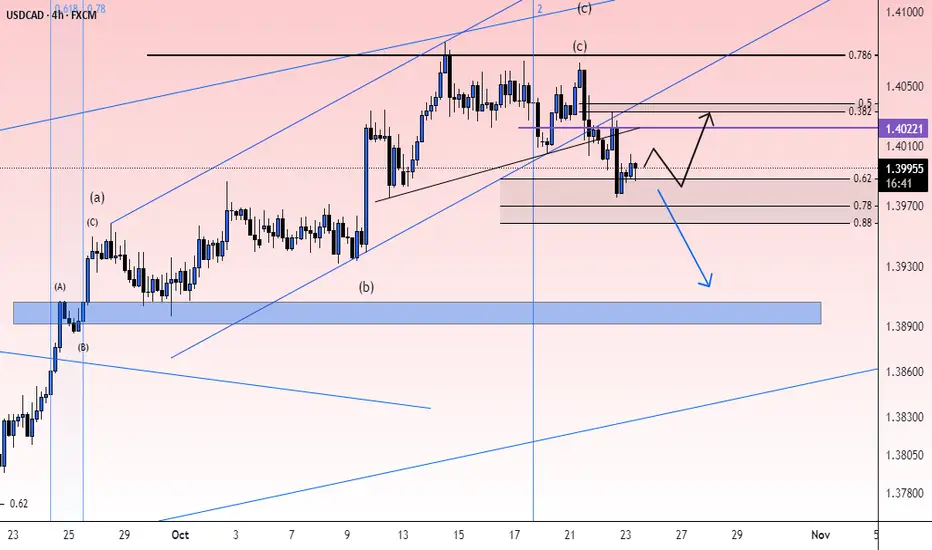
check the trendIt is expected that the upward wave has ended and the downward trend will continue.
The specified support levels can be suitable areas for the end of the downward wave.