USD/CAD Support breakdown bearish strong📉 USDCAD Update (1H Timeframe)
The pair has broken down from key support and consolidation zone around 1.40100, confirming strong selling pressure 🔥
🎯 Technical Targets:
1️⃣ 1.39800
2️⃣ 1.39600
3️⃣ 1.39300
Momentum remains bearish with sellers in control — watch for continued downside pressure as long as price stays below 1.4010 🚨
#USDCAD #Forex #PriceAction #TechnicalAnalysis #TradingSetup #FXUpdates 💹
Trade ideas

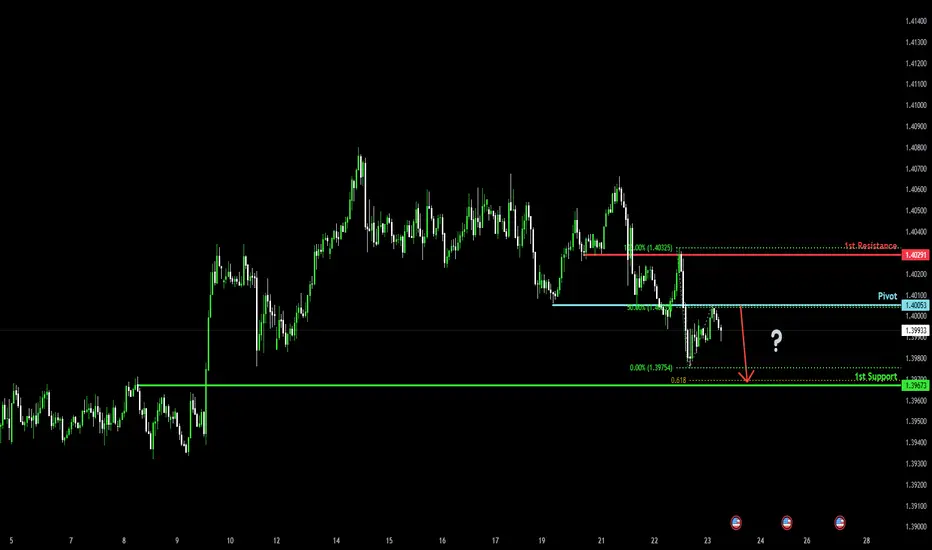
Bearish reversal off 50% Fibonacci resistance?The Loonie (USD/CAD) has rejected off the pivot, which acts as a pullback resistance that aligns with the 50% Fibonacci retracement and could drop to the 1st support.
Pivot: 1.4005
1st Support: 1.3967
1st Resistance: 1.4029
Disclaimer:
The above opinions given constitute general market commentary, and do not constitute the opinion or advice of IC Markets or any form of personal or investment advice.
Any opinions, news, research, analyses, prices, other information, or links to third-party sites contained on this website are provided on an "as-is" basis, are intended only to be informative, is not an advice nor a recommendation, nor research, or a record of our trading prices, or an offer of, or solicitation for a transaction in any financial instrument and thus should not be treated as such. The information provided does not involve any specific investment objectives, financial situation and needs of any specific person who may receive it. Please be aware, that past performance is not a reliable indicator of future performance and/or results. Past Performance or Forward-looking scenarios based upon the reasonable beliefs of the third-party provider are not a guarantee of future performance. Actual results may differ materially from those anticipated in forward-looking or past performance statements. IC Markets makes no representation or warranty and assumes no liability as to the accuracy or completeness of the information provided, nor any loss arising from any investment based on a recommendation, forecast or any information supplied by any third-party.
Stop!Loss|Market View: USDCAD🙌 Stop!Loss team welcomes you❗️
In this post, we're going to talk about the near-term outlook for the USDCAD currency pair☝️
Potential trade setup:
🔔Entry level: 1.40312
💰TP: 1.41455
⛔️SL: 1.39707
"Market View" - a brief analysis of trading instruments, covering the most important aspects of the FOREX market.
👇 In the comments 👇 you can type the trading instrument you'd like to analyze, and we'll talk about it in our next posts.
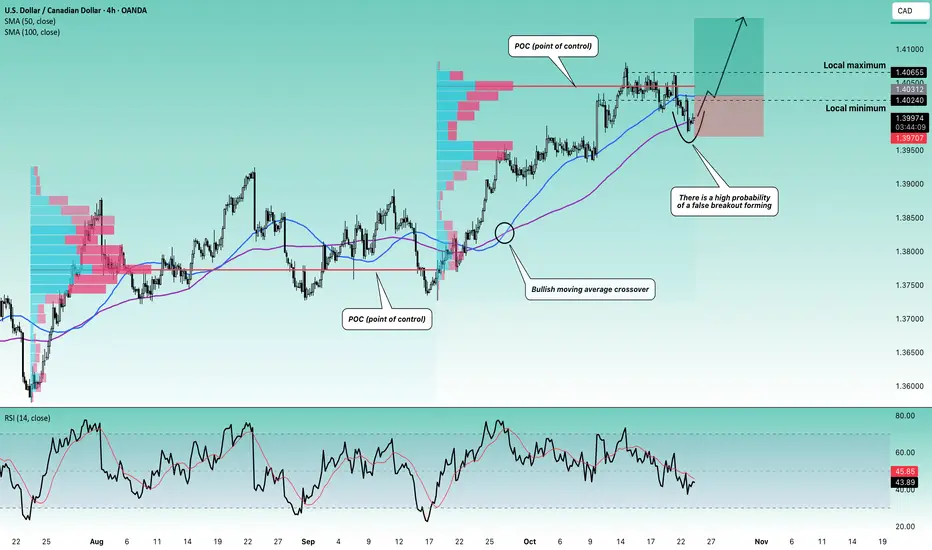
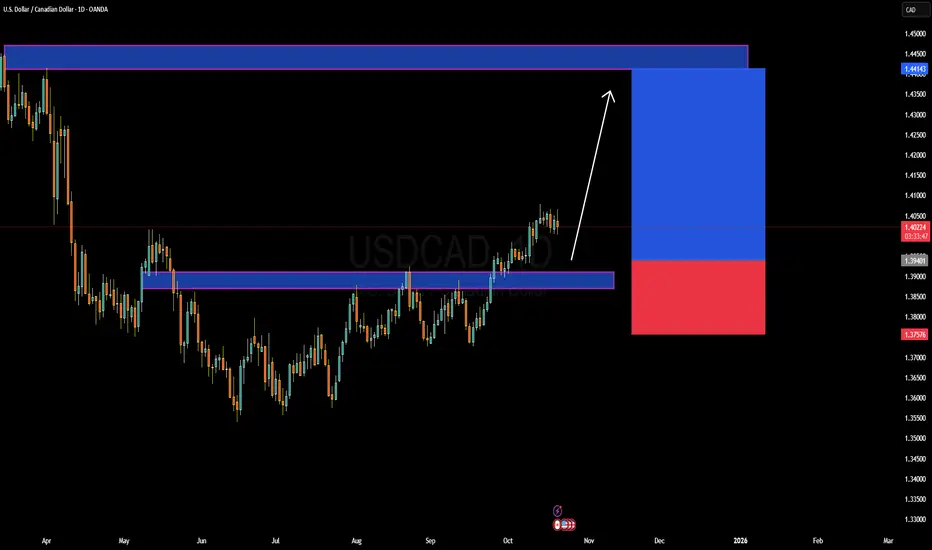
💬 Description: The focus on the accumulation area of 1.40240 - 1.40655 remains despite the breakout of its lower border. We are currently most likely observing the formation of a false breakout. The main scenario is the price closing above 1.40240 again, thereby forming a false breakout. Buy trades towards 1.41000 and 1.42000 can be actively looked for in this case. A more conservative option is to look for a buy trade via a breakout of the upper border of 1.40655.
Thanks for your support 🚀
Profits for all ✅
❗️ Updates on this idea can be found below 👇
USDCAD SHORT-TERM BUY AND LONG TERM SELL As we can see price was in an uptrend in USDCAD, but Price has broken out thereby creating a change of character to the downside for a sell and also respecting both the supply zone and demand zone


USDCAD FREE SIGNAL|LONG|
✅USDCAD Price has reacted from a clean demand zone where buy-side liquidity was accumulated, showing signs of bullish displacement. A continuation toward the next imbalance is expected.
—————————
Entry: 1.3986
Stop Loss: 1.3975
Take Profit: 1.3999
Time Frame: 2H
Setup Risk: High
—————————
LONG🚀
✅Like and subscribe to never miss a new idea!✅


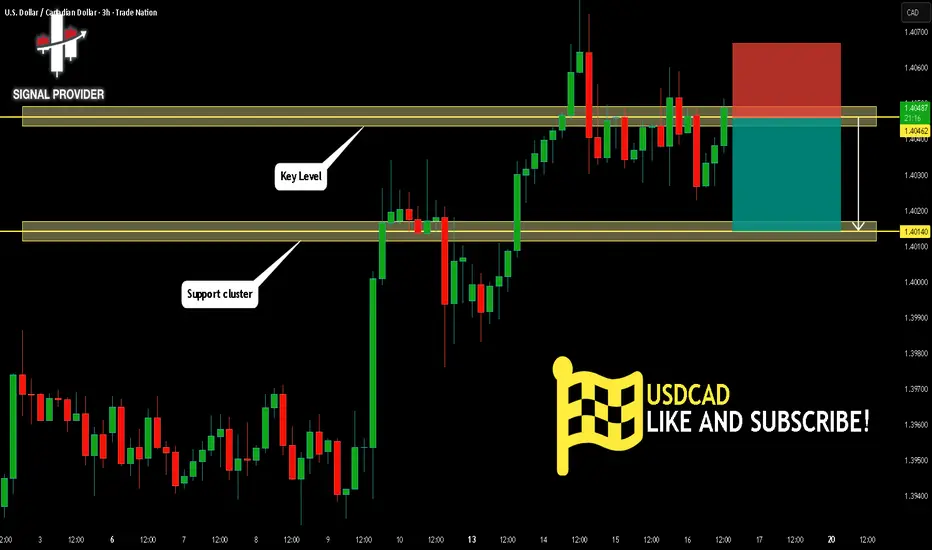
USDCAD sideways consolidation support at 1.4013The USDCAD remains in a bullish trend, with recent price action indicating a potential breakout rally within the broader uptrend.
Support Zone: 1.4013 – a key level from previous consolidation. Price is currently testing or approaching this level.
A bullish rebound from 1.4013 would confirm ongoing upside momentum, with potential targets at:
1.4093 – initial resistance
1.4122 – psychological and structural level
1.4150 – extended resistance on the longer-term chart
Bearish Scenario:
A confirmed break and daily close below 1.4013 would weaken the bullish outlook and suggest deeper downside risk toward:
1.3990 – minor support
1.3970 – stronger support and potential demand zone
Outlook:
Bullish bias remains intact while the USDCAD holds above 1.4013. A sustained break below this level could shift momentum to the downside in the short term.
This communication is for informational purposes only and should not be viewed as any form of recommendation as to a particular course of action or as investment advice. It is not intended as an offer or solicitation for the purchase or sale of any financial instrument or as an official confirmation of any transaction. Opinions, estimates and assumptions expressed herein are made as of the date of this communication and are subject to change without notice. This communication has been prepared based upon information, including market prices, data and other information, believed to be reliable; however, Trade Nation does not warrant its completeness or accuracy. All market prices and market data contained in or attached to this communication are indicative and subject to change without notice.

USDCAD My Opinion! SELL!
My dear friends,
My technical analysis for USDCAD is below:
The market is trading on 1.4027 pivot level.
Bias - Bearish
Technical Indicators: Both Super Trend & Pivot HL indicate a highly probable Bearish continuation.
Target - 1.4012
Recommended Stop Loss - 1.4037
About Used Indicators:
A pivot point is a technical analysis indicator, or calculations, used to determine the overall trend of the market over different time frames.
Disclosure: I am part of Trade Nation's Influencer program and receive a monthly fee for using their TradingView charts in my analysis.
———————————
WISH YOU ALL LUCK

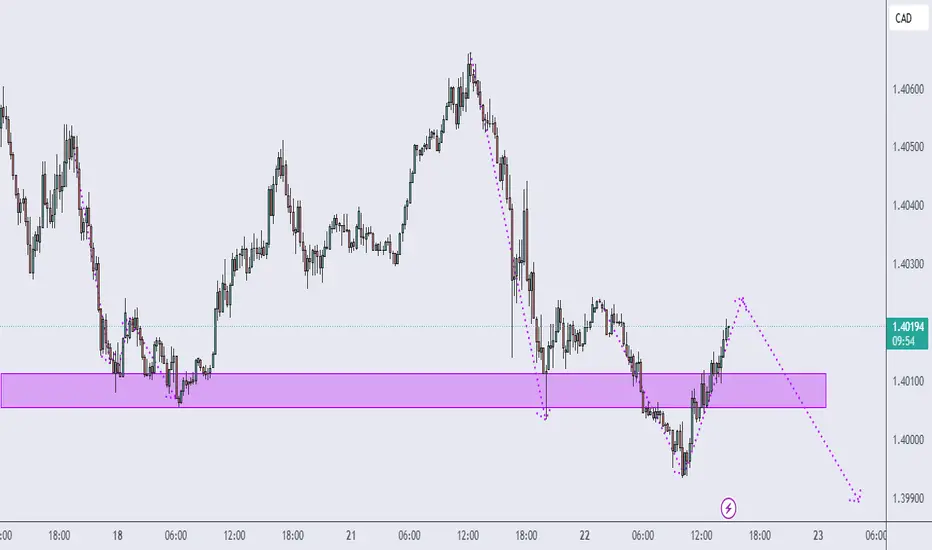
USDCAD – Potential Short Setup After Retest of Supply ZoneAfter a strong bearish impulse, the price has retraced back toward a previously broken structure that now aligns with a supply zone (highlighted in purple).
This area has acted as a strong support in the past and could now serve as resistance after the recent breakdown.
Currently, the market is showing a corrective move to the upside, likely to mitigate orders before the next bearish leg.
If price shows rejection signs such as bearish engulfing or lower-timeframe structure shift within this purple zone, I’ll be looking for short opportunities.
Trade Plan:
🔹 Entry: After confirmation of rejection within the purple zone
🔹 Stop Loss: Above the zone’s upper boundary or recent swing high
🔹 Take Profit 1: near 1.3986
🔹 Take Profit 2: Extension toward 1.3964
Bias:
📉 Bearish continuation after corrective pullback to the supply zone.
Market Logic:
The bearish momentum remains dominant, and the corrective structure suggests distribution before continuation. I’ll wait for confirmation before executing the short position.
USDCAD H1 | Bullish Bounce Off SupportBased on the H1 chart analysis, we can see that the price has bounced off the buy entry which is a pullback support and could rise from this level to the upside.
Buy entry is at 1.3998, whichis a pullback support.
Stop loss is at 1.3983, whichis a pullback support that aligns with the 138.2% Fibonacci extension.
Take profit is at 1.4028, whichis a pullback resistance that aligns with the 50% Fibonacci retracement.
Stratos Markets Limited (tradu.com ):
CFDs are complex instruments and come with a high risk of losing money rapidly due to leverage. 68% of retail investor accounts lose money when trading CFDs with this provider. You should consider whether you understand how CFDs work and whether you can afford to take the high risk of losing your money.
Stratos Europe Ltd (tradu.com ):
CFDs are complex instruments and come with a high risk of losing money rapidly due to leverage. 70% of retail investor accounts lose money when trading CFDs with this provider. You should consider whether you understand how CFDs work and whether you can afford to take the high risk of losing your money.

USDCAD Forecast USD/CAD highlighting a potential short-term bearish setup. Price has recently broken below a rising channel and is now retesting the 1.4025–1.4035 resistance zone (previous support turned resistance). The projection suggests a possible rejection from this zone, followed by a decline toward the 1.3980 demand area. Overall, the chart indicates a sell-on-retest scenario aligning with bearish momentum after a channel breakdown.
"Thank you for your support! If you found this idea valuable or learned something new, please consider liking and leaving a comment. I’d really appreciate hearing your feedback and thoughts."

USDCAD Remains sustain its bullish trajectoryThe USDCAD pair is attempting to break above its recent consolidation resistance, continuing its broader uptrend. Strength in the U.S. Dollar Index (DXY) provides additional support for the bullish momentum.
Currently, the pair is challenging the 1.4020 resistance level. A confirmed breakout above this zone could open the way for further upside movement, targeting the next key resistance at 1.4110.
From a fundamental perspective, if the current positive sentiment around the USD remains unchanged, and risk appetite continues to favour the dollar, the pair may sustain its bullish trajectory. The consolidation seen earlier could act as a base for further growth, reinforcing the upward momentum.
You may find more details in the chart.
Trade wisely best of Luck.
Ps; Support with like and comments for better analysis Thanks for Supporting.

BUY USDCADUSDCAD Bullish Idea. We may see strong bullish moves from AUDUSD today, totally against the run of play. There are missing pieces before the highly anticipated USD drop. A falling channel confirms this bullish move

USD/CAD(20251022)Today's AnalysisMarket News:
Citigroup has turned bearish on gold prices, predicting a drop to $4,000 within the next three months.
Technical Analysis:
Today's Buy/Sell Levels:
1.4029
Support and Resistance Levels:
1.4091
1.4068
1.4053
1.4006
1.3991
1.3967
Trading Strategy:
If the price breaks above 1.4029, consider a buy entry, with the first target at 1.4053.
If the price breaks below 1.4006, consider a sell entry, with the first target at 1.3991

Trade Analysis (USD/CAD – 15m CAP Wave)The broader market trend for USD/CAD remains bullish, with higher timeframes confirming an overall upward direction. However, on the 15-minute timeframe, price action reveals a strong session low zone that has already been tested in a previous session, suggesting potential short-term exhaustion at this level.
The current 15m CAP wave indicates a downward move towards the lower boundary of the zone, implying short-term bearish momentum. Given the confluence of previous tests and current CAP direction, a temporary bounce from this support area is possible before any sustained continuation in the broader uptrend.
This setup therefore highlights a short-term bearish opportunity within a long-term bullish context.

USDCADNot financial advice. The essence of investing & trading is the intelligent and patient preying on the greed, fear, impatience, addiction and ignorance of the majority. It's definitionally Darwinian.

USDCAD Forming Bullish StructureUSDCAD on the daily chart is maintaining a strong bullish structure after breaking above the previous resistance zone around 1.3940. The market has been forming higher highs and higher lows, showing solid buying pressure as the pair heads toward the 1.4140–1.4200 resistance range. The current price action suggests a potential continuation setup where a minor pullback toward the breakout zone could invite more buyers before the next bullish impulse. The upward momentum is supported by clear technical strength, making this a favorable setup for long positions if price sustains above 1.3940.
From a fundamental standpoint, the US dollar remains dominant amid the ongoing strength in the US economy and persistent inflation pressures, which keep expectations of prolonged higher interest rates from the Federal Reserve alive. In contrast, the Canadian dollar faces pressure due to weaker growth prospects and declining oil prices, which reduce demand for the CAD as a commodity-linked currency. Additionally, global risk sentiment has leaned defensive, favoring the USD as a safe-haven asset.
If the bullish momentum continues and the market holds above the current support region, USDCAD could likely retest the 1.4140–1.4200 zone in the near term. Traders will closely monitor US inflation data and crude oil performance as key drivers for this pair’s next move. Overall, the setup aligns with both technical and fundamental bullish conditions, offering a clear profit potential on continuation of the trend.
USDCAD⬇️ Sell Range: 1.40340 - 1.40550
⏹️ Stop Loss: 1.41000
*️⃣ Take Profit: 1.39720 - 1.39400
🔠 One view suggests a decline in prices to local support levels, with the possibility of wider market fluctuations influenced by various factors, including trade tensions and oil price dynamics, which typically affect the Canadian dollar.

19-10-2025 _ Short Term Bullish Idea _ USDCAD H41- Price is moving in an Up Tend.
2- Price is retesting 200 EMA.
3- Regular Flact as corrective structure to the last move UP.
4- Bullish Flag Pattern.
5- Therefore, expect pullback and further continuation to the Up Side.

USDCAD short it created a double top pattern
came back to retest
now is breaking out to the downside again.

USDCAD Will Go Lower! Short!
Here is our detailed technical review for USDCAD.
Time Frame: 3h
Current Trend: Bearish
Sentiment: Overbought (based on 7-period RSI)
Forecast: Bearish
The market is on a crucial zone of supply 1.404.
The above-mentioned technicals clearly indicate the dominance of sellers on the market. I recommend shorting the instrument, aiming at 1.401 level.
P.S
Overbought describes a period of time where there has been a significant and consistent upward move in price over a period of time without much pullback.
Like and subscribe and comment my ideas if you enjoy them!
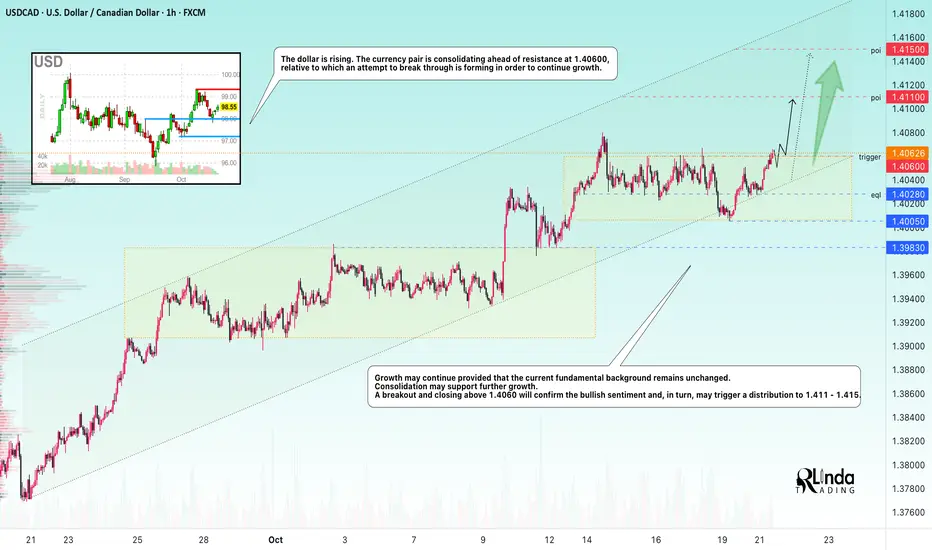
USDCAD → Attempt to break through resistance to continue growth FX:USDCAD is attempting to break through consolidation resistance within an uptrend. Growth in the dollar index may support the current trend.
The dollar is rising. The currency pair is consolidating ahead of resistance at 1.40600, against which it is attempting to break through in order to continue growing.
The growth may continue if the current fundamental background remains unchanged. Consolidation may support further growth. A breakout and closing above 1.4060 will confirm the bullish sentiment and, in turn, may trigger a distribution to 1.411 - 1.415.
Resistance levels: 1.4060
Support levels: 1.4028, 1.4005
The trend is bullish, with virtually no pullback after the growth, only consolidation, which is technically a positive sign. A breakout of the specified consolidation resistance could trigger distribution to areas of interest.
Best regards, R. Linda!