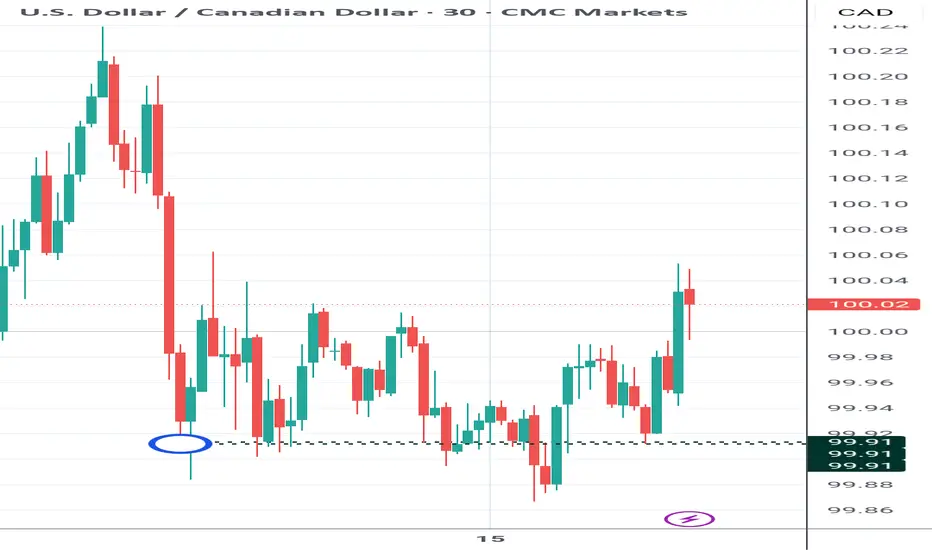
Price action 30 min structure changed everything price swept liquidity about and started making this structure showing the involvement of smart money planning to push price up
Trade ideas
USD/CAD: Bearish Loonie SlideUSD/CAD: Bearish Loonie Slide Amid #Fed Cut Hype and #Forex Volatility Buzz? 1.39 Breakout Target in Sight?
USD/CAD is trading at 1.3795 today, up 0.17% amid a rebound from 1.3728 lows as markets eye the Fed's rate decision later, with 65% odds of a 50bps cut to 4.00-4.25% pressuring the dollar but offset by BoC's own easing signals.
This follows a 0.25% CAD gain earlier in the week on CPI data, but the pair remains range-bound with analysts forecasting a bearish tilt to 1.35 by year-end if Fed cuts deepen.
Just as #Fed surges with 15K mentions on X amid rate speculation, and #Forex trends spotlight policy divergence (e.g., BoC vs. Fed easing), USD/CAD's sensitivity to oil and CAD vulnerability position it for choppy action in the $1.8T daily forex market.
But with volatility at 3.88%, is USD/CAD undervalued for a bull run to 1.39, or will dovish Fed trigger a CAD rebound? Let's break down the fundamentals, SWOT, charts, and setups for September 18, 2025.
Fundamental Analysis
USD/CAD's trajectory hinges on diverging central bank paths, with the BoC's recent cuts weakening the loonie while Fed easing caps USD upside—yet oil prices above $70/bbl support CAD via Canada's export reliance.
Analysts project a 2025 average of 1.35, bearish on CAD amid #Fed cuts, but short-term resistance at 1.3800 could hold if US data softens. With #Forex volatility buzzing, the pair's undervaluation shines in a risk-on environment if Fed delivers 50bps, but sticky US inflation (2.6% core) risks a hawkish pivot.
- **Positive:**
- BoC easing and CAD vulnerability amid #Forex hype project USD strength to 1.3863 if Fed holds steady.
- Oil tailwinds and EM inflows (e.g., SA bonds) bolster CAD floors, undervaluing the pair at current levels vs. 1.40 peaks.
- Broader #Fed trends favor USD if dot plot signals fewer cuts, eyeing 0.5% monthly gains.
- **Negative:**
- Dovish Fed expectations weaken USD, clashing with #Fed optimism if 50bps cut confirms CAD rebound.
- Canada CPI resilience (2.0% YoY) could strengthen CAD if BoC pauses, pressuring the pair lower.
SWOT Analysis
**Strengths:** Policy divergence favors USD with Fed's relative hawkishness vs. BoC, amplified by #Fed relevance in dollar sentiment.
**Weaknesses:** High oil correlation exposes CAD upside; overbought momentum vulnerable in #Forex-shifting markets post-Fed.
**Opportunities:** Fed cut confirmation narrows spreads, with undervalued bull potential to 1.3891 amid #Fed boom.
**Threats:** Hawkish BoC surprises eroding gains; competition from AUD/CAD if commodity trends capitalize on #Forex volatility.
Technical Analysis
On the daily chart, USD/CAD rebounds in an ascending channel from 1.3728 support, with a pivot at 1.3800 mirroring #Fed volatility spikes. The weekly shows neutral bias with 1.3889 as key breakout. Current price: 1.3795, with VWAP at 1.3770 as intraday balance.
Key indicators:
- **RSI (14-day):** At 55, neutral—potential bull signal amid #Fed surge. 📈
- **MACD:** Histogram positive, crossover holding for upside.
- **Moving Averages:** Price above 21-day EMA (1.3750) but testing 50-day SMA (1.3820)—bullish if holds.
Support/Resistance: Support at 1.3728 (recent low), resistance at 1.3863 and 1.3891. Patterns/Momentum: Channel bounce targets 1.3863; fueled by #Forex momentum. 🟢 Bullish signals: Higher lows on volume. 🔴 Bearish risks: Failure at 1.3800 eyes 1.36.
Scenarios and Risk Management
- **Bullish Scenario:** Break above 1.3863 on hawkish Fed targets 1.3891; long on pullbacks to 1.3728, especially if #Fed signals fewer cuts.
- **Bearish Scenario:** Drop below 1.3728 eyes 1.3538; watch for CAD cross amid #Forex fade on dovish pivot.
- **Neutral/Goldilocks:** Range-bound 1.3728–1.3863 if dot plot mixed and #Fed cools.
Risk Tips: Use stops at 1.3700. Risk 1-2% per trade. Diversify to avoid correlation traps with #Fed-linked pairs like EUR/USD.
Conclusion/Outlook
Overall, a bullish bias if USD/CAD holds 1.3728, supercharged by today's #Fed and #Forex trends, with 0.7% upside to 1.39 on policy divergence. But watch the Fed outcome for confirmation—this fits September's rate volatility theme amid easing hype.
What’s your take? Bullish on USD/CAD amid #Fed cuts or fading the loonie? Share in the comments!

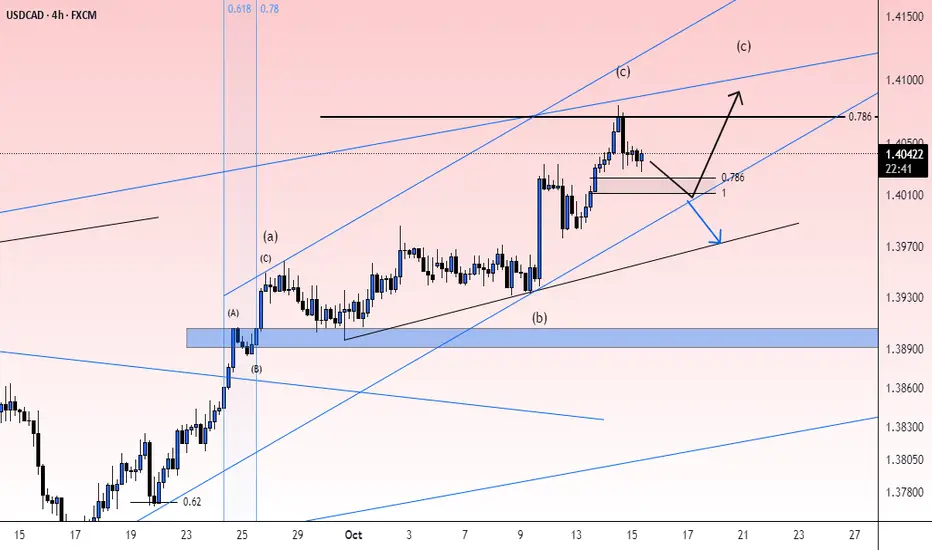
possibility of uptrendThe correction trend can progress to the specified support levels. Then there is a possibility of a trend change and the start of the upward trend will be likely. The break of the previous ceiling range will be a confirmation of the upward trend.
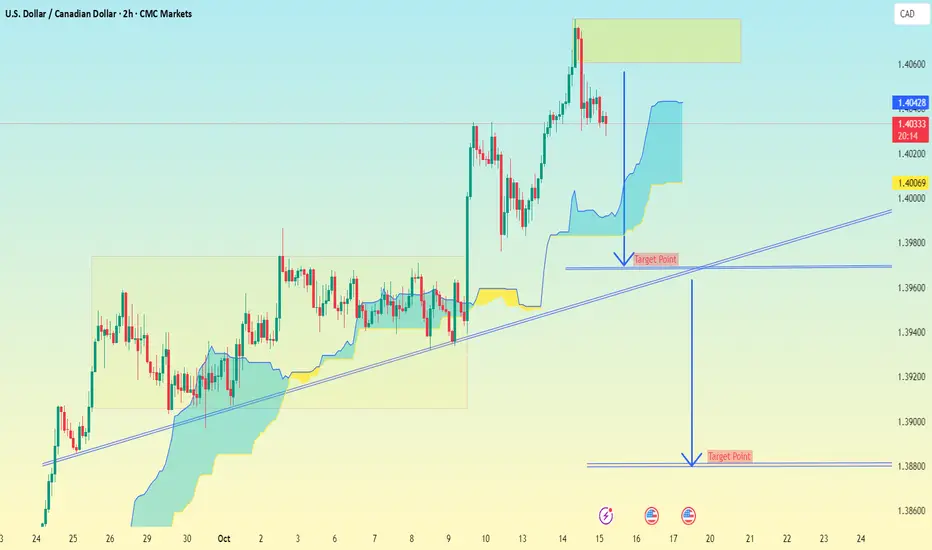
USDCAD 2-hour chart Pattern..USDCAD 2-hour chart, here’s what can be observed and inferred technically:
🔍 Chart Analysis Summary:
Pair: USD/CAD
Timeframe: 2H (2-hour)
Current price: ~1.4033
Trendline: Upward sloping (acting as dynamic support)
Recent action: Price broke out from consolidation, reached resistance near 1.4060–1.4080 zone, and started to pull back.
Cloud (Ichimoku): Currently price is above the Kumo cloud, but appears to be testing or potentially dipping into it.
---
🎯 Target Areas (based on your annotations and market structure)
1. Short-term target:
First Target Point: Around 1.4000–1.4009
This matches my chart annotation just above the ascending trendline.
Likely corresponds to minor support and a retest of the trendline area.
2. Extended / Swing Target:
Second Target Point: Around 1.3880–1.3890
This is marked as the lower "Target Point" on my chart.
It aligns with a deeper correction scenario if the trendline breaks cleanly and the bearish momentum extends.
That would fill the “measured move” drawn on my chart (projected from the previous range height).
---
⚠ Key Levels to Watch
Level Type Note
1.4080 Resistance Previous high / Supply zone
1.4000 Support / Target 1 Trendline + psychological round number
1.3880 Target 2 Full measured move projection
1.4060–1.4080 Sell Zone Potential retest area if price bounces
---
📉 Bias:
If the price breaks below 1.4000 (trendline support) and holds under the Kumo cloud, a move toward 1.3880 looks likely.
If it holds above 1.4000 and rebounds, the short-term correction could end there.
My view for USDCADThis is the my next prediction target for USDCAD.. Please comment below about your idea... Thanks.
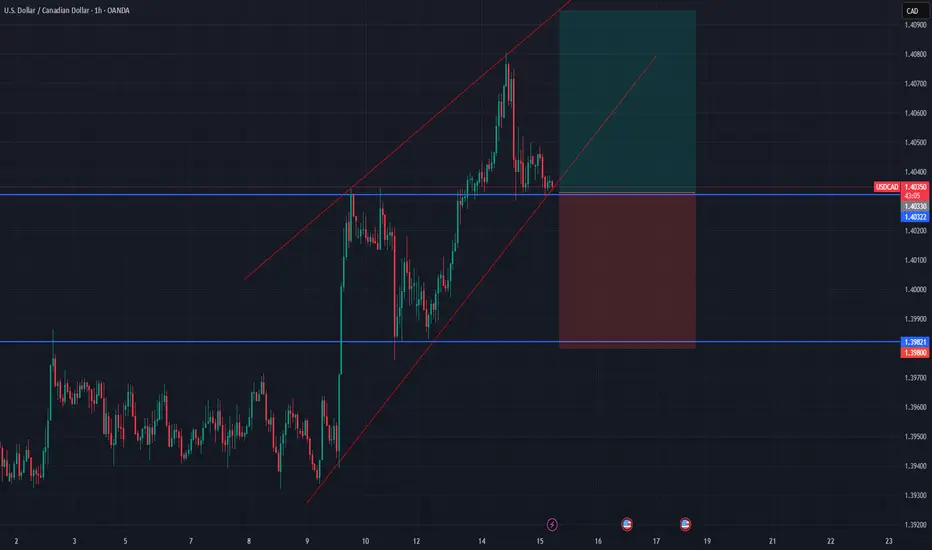
USD/CAD - Wedge Breakout (15.10.2025)📊 Setup Overview: OANDA:USDCAD
USD/CAD has completed a rising wedge formation and broken below the support trendline — a classic sign of bearish reversal pressure. The price is now rejecting from the resistance zone, supported by weakening momentum within the Ichimoku cloud. This setup indicates a potential move toward the next major support levels.
📈 Trade Plan:
Bias: Bearish
Sell Entry Zone: Near 1.4040 – 1.4060 (resistance retest area)
1st Target: 1.3992 ✅
2nd Target: 1.3954 🎯
Invalidation: Above 1.4075 resistance zone
🧩 Supporting Factors:
Clear wedge breakout below trendline
Resistance zone rejection after sharp upward push
Price trading below Ichimoku cloud, signaling bearish control
Volume and structure aligning for a potential downside continuation
#USDCAD #Forex #PriceAction #TechnicalAnalysis #TradingView #ChartPattern #WedgeBreakout #ForexSignals #BearishSetup #FXTrading #Ichimoku #ChartsDontLie
⚠️ Disclaimer:
This analysis is for educational purposes only and not financial advice. Always conduct your own analysis and use proper risk management before taking any trade.
💬 Support the Analysis:
If you found this helpful — Like 👍, Comment 💬, and Follow ✅ for more high-quality chart setups and pattern-based analyses!

USDCAD H1 | Bullish Bounce ConfirmedBased on the H1 chart analysis, we can see that the price has bounced off the buy entry, which serves as a pullback support that aligns with the 50% Fibonacci retracement. This level could potentially rise to the upside from here.
Buy entry is at 1.4032, whichis an overlap support that lines up with the 50% Fibonacci retracement.
Stop loss is at 1.4008, whichis a pullback support that aligns with the 50% Fibonacci retracement.
Take profit is at 1.4093, whichis a pullback resistance.
High Risk Investment Warning
Trading Forex/CFDs on margin carries a high level of risk and may not be suitable for all investors. Leverage can work against you.
Stratos Markets Limited (tradu.com ):
CFDs are complex instruments and come with a high risk of losing money rapidly due to leverage. 65% of retail investor accounts lose money when trading CFDs with this provider. You should consider whether you understand how CFDs work and whether you can afford to take the high risk of losing your money.
Stratos Europe Ltd (tradu.com ):
CFDs are complex instruments and come with a high risk of losing money rapidly due to leverage. 66% of retail investor accounts lose money when trading CFDs with this provider. You should consider whether you understand how CFDs work and whether you can afford to take the high risk of losing your money.
Stratos Global LLC (tradu.com ):
Losses can exceed deposits.
Please be advised that the information presented on TradingView is provided to Tradu (‘Company’, ‘we’) by a third-party provider (‘TFA Global Pte Ltd’). Please be reminded that you are solely responsible for the trading decisions on your account. There is a very high degree of risk involved in trading. Any information and/or content is intended entirely for research, educational and informational purposes only and does not constitute investment or consultation advice or investment strategy. The information is not tailored to the investment needs of any specific person and therefore does not involve a consideration of any of the investment objectives, financial situation or needs of any viewer that may receive it. Kindly also note that past performance is not a reliable indicator of future results. Actual results may differ materially from those anticipated in forward-looking or past performance statements. We assume no liability as to the accuracy or completeness of any of the information and/or content provided herein and the Company cannot be held responsible for any omission, mistake nor for any loss or damage including without limitation to any loss of profit which may arise from reliance on any information supplied by TFA Global Pte Ltd.
The speaker(s) is neither an employee, agent nor representative of Tradu and is therefore acting independently. The opinions given are their own, constitute general market commentary, and do not constitute the opinion or advice of Tradu or any form of personal or investment advice. Tradu neither endorses nor guarantees offerings of third-party speakers, nor is Tradu responsible for the content, veracity or opinions of third-party speakers, presenters or participants.

USDCAD LONG Market structure bullish o HTFs 3
Entry at both Weekly and Daily AOi
Weekly rejection at AOi
Daily Rejection at AOi
Previous Structure point Daily
Around Psychological Level 1.39500
Touching EMA H4
H4 Candlestick rejection
Rejection from Previous structure
Levels
Entry 110%
REMEMBER : Trading is a Game Of Probability
: Manage Your Risk
: Be Patient
: Every Moment Is Unique
: Rinse, Wash, Repeat!
: Christ is King.

Bearish drop off?USD/CAD has rejected off the resistance level, which is a pullback resistance that aligns with the 50% Fibonacci retracement, and could drop from this level to our take profit.
Entry: 1.4054
Why we like it:
There is a pullback resistance level that aligns with the 50% Fibonacci retracement.
Stop loss: 1.4076
Why we like it:
There is a swing high resistance level.
Take profit: 1.4013
Why we like it:
There is a pullback support level.
Enjoying your TradingView experience? Review us!
Please be advised that the information presented on TradingView is provided to Vantage (‘Vantage Global Limited’, ‘we’) by a third-party provider (‘Everest Fortune Group’). Please be reminded that you are solely responsible for the trading decisions on your account. There is a very high degree of risk involved in trading. Any information and/or content is intended entirely for research, educational and informational purposes only and does not constitute investment or consultation advice or investment strategy. The information is not tailored to the investment needs of any specific person and therefore does not involve a consideration of any of the investment objectives, financial situation or needs of any viewer that may receive it. Kindly also note that past performance is not a reliable indicator of future results. Actual results may differ materially from those anticipated in forward-looking or past performance statements. We assume no liability as to the accuracy or completeness of any of the information and/or content provided herein and the Company cannot be held responsible for any omission, mistake nor for any loss or damage including without limitation to any loss of profit which may arise from reliance on any information supplied by Everest Fortune Group.

BULLISH SETUP ON USDCADFrom Higher Time Frame we can spot an inside pin bar on the bullish daily chart, with today pullback into a support level at 1.40342 with a closed of a bullish candle on the 1H time frame we can see the price rally with trend up to 1.40932.

USD/CAD Breaks Above 200-Day SMA as Momentum BuildsUSD/CAD has pushed through the 200-day simple moving average (SMA) near 1.3970, marking a notable shift in momentum after several months of consolidation. The breakout also coincides with price action moving decisively above the 1.4025 horizontal resistance zone, which previously capped multiple upside attempts.
The 50-day SMA (around 1.3850) has been trending upward and is now positioned below the 200-day SMA, suggesting a potential continuation of short-term bullish momentum if follow-through buying sustains.
Momentum indicators support the recent strength:
The MACD histogram remains positive, with the signal line crossover indicating ongoing upward momentum.
The RSI is hovering just below the overbought threshold (~70), reflecting strong bullish sentiment while cautioning that short-term consolidation could emerge if conditions become overextended.
Overall, the pair appears to be transitioning from a medium-term range phase to a potential bullish structure, though confirmation through sustained closes above the 1.4025–1.4050 area would strengthen that view.
-MW

USDCAD - Important Breakout!Hello traders!
Previously, the USDCAD price formed a bullish triple bottom pattern.
Currently, the resistance level (1.39829 - 1.40234) is broken!
So, I expect a bullish move🚀
_____________
TARGET: 1.41500🎯

USD/CAD Extends Breakout as US Yields Stay Firm; BoC Speakers EyPrice Action: USD/CAD is trading around 1.4057, extending its breakout through 1.4034 and eyeing Fib extensions toward 1.4091. The pair has rallied steadily through early October as US rates remain firm and Canadian data soften.
Technical Bias: Bullish continuation within a clean uptrend channel, confirmed by a breakout above short-term resistance and strengthening momentum signals.
Macro Drivers: A firm US yield curve and hawkish Fed speak contrast with weaker Canadian building permits and expectations for a dovish BoC into Q4. Key watch: Powell’s speech, BoC’s Rogers, and risk tone.
Strategic Stance: Bullish while above 1.4012/1.4034, targeting 1.4069–1.4091. Pullbacks are likely to find dip buyers unless Powell delivers a dovish surprise.

USDCAD Flow Map | Bullish PotentialHi there,
USDCAD is bearish on the H1 timeframe, with a potential pullback to 1.39960 and a bias toward 1.40569. The price will drop to near the demand area or reach the extreme level of 1.38930. A break of the high at 1.39565 to a higher high of 1.39871 has occurred and remains intact.
Happy Trading,
K.
_
Not trading advice

USDCAD 1H – Bullish Structure Playing Out from Monthly DemandPrice continues to respect bullish structure after reacting strongly from the monthly demand zone around the 1.3940–1.3960 region. We’ve seen consecutive Breaks of Structure (BOS) to the upside, confirming a clear shift in momentum.
The most recent Short-Term Low (SSL) sweep provided liquidity for buyers, followed by an aggressive impulsive push that reclaimed prior highs , a classic demand-driven continuation pattern in line with Smart Money Concepts (SMC).
As long as price remains above the last BOS level and continues printing higher-highs and higher-lows, bullish sentiment remains valid. Any corrective pullback into the 1.4000–1.3980 range could offer a potential re-entry opportunity for continuation longs.
Macro and Fundamental Drivers Supporting the Long Bias
Several fundamental tailwinds support this upside scenario:
U.S. Dollar Strength – The greenback continues to gain traction on expectations that the Federal Reserve will maintain higher interest rates for longer, given persistent inflationary pressures and resilient labour data.
Crude Oil Weakness – Canada’s currency often moves inversely to oil. With recent softness in crude prices driven by global demand concerns and higher U.S. stockpiles, the CAD tends to underperform, giving USDCAD a natural lift.
Yield Differentials – U.S. Treasury yields remain elevated compared to Canadian bond yields, encouraging capital flow toward the USD.
Market Sentiment – Broader risk-off conditions are pushing investors toward safe-haven assets like the U.S. dollar, further reinforcing the bullish tone.
Technical Outlook
Bias: Bullish
Key Demand: 1.3940 – 1.3960 (Monthly Zone)
Near-Term Targets: 1.4100 → 1.4150
Invalidation: Break below 1.3940
This structure suggests continuation toward upper liquidity zones as long as price maintains bullish order flow. A retracement into lower-timeframe demand would present a healthy correction, not a reversal.

CAN USDCAD GO HIGHERAfter a recent accumulation and breakout of this box, we can see USCAD go higher of deep into the annual lows. This is a technical look from my perspective and not a signla

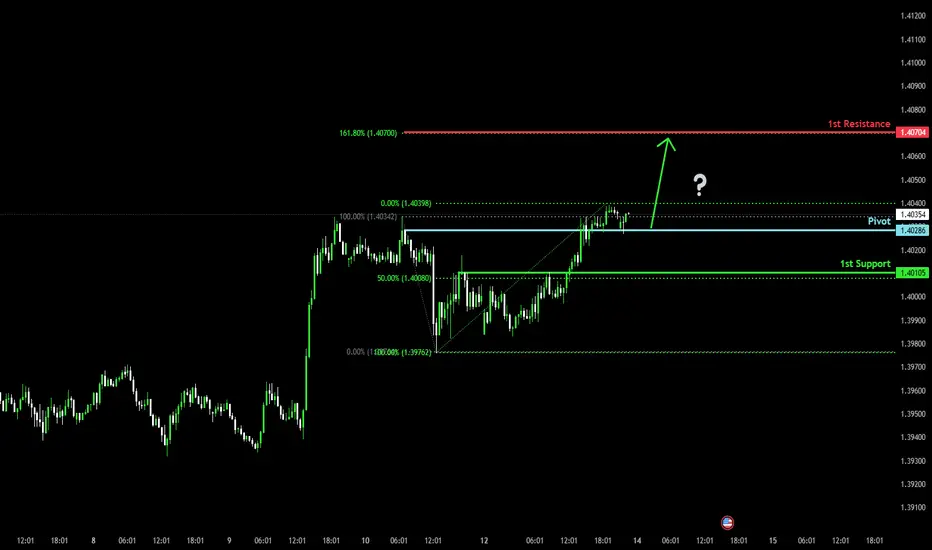
Bullish momentum to extend?The Loonie (USD/CAD) has bounced off the pivot which is a pullback support, and could rise to the 1st resistance.
Pivot: 1.3028
1st Support: 1.4010
1st Resistance: 1.4070
Disclaimer:
The above opinions given constitute general market commentary, and do not constitute the opinion or advice of IC Markets or any form of personal or investment advice.
Any opinions, news, research, analyses, prices, other information, or links to third-party sites contained on this website are provided on an "as-is" basis, are intended only to be informative, is not an advice nor a recommendation, nor research, or a record of our trading prices, or an offer of, or solicitation for a transaction in any financial instrument and thus should not be treated as such. The information provided does not involve any specific investment objectives, financial situation and needs of any specific person who may receive it. Please be aware, that past performance is not a reliable indicator of future performance and/or results. Past Performance or Forward-looking scenarios based upon the reasonable beliefs of the third-party provider are not a guarantee of future performance. Actual results may differ materially from those anticipated in forward-looking or past performance statements. IC Markets makes no representation or warranty and assumes no liability as to the accuracy or completeness of the information provided, nor any loss arising from any investment based on a recommendation, forecast or any information supplied by any third-party.
USDUSD BULLISH BIAS|LONG|
✅USDCAD shows clear bullish intent as price expands through a key level, confirming a breakout and potential continuation phase. Liquidity above 1.4050 acts as magnet for Smart Money rebalancing. Time Frame 12H.
LONG🚀
✅Like and subscribe to never miss a new idea!✅

USD/CAD) Bullish trend analysis Read The captionSMC Trading point update
Technical analysis of USD/CAD Bullish Continuation Setup (4H Chart)
Technical Overview:
Instrument: U.S. Dollar / Canadian Dollar (USD/CAD)
Timeframe: 4-Hour
Current Price: ~1.4028
Bias: Bullish
---
Chart Breakdown:
1. Fair Value Gap (FVG) Zone – Demand Area (Yellow Box):
Price recently filled the FVG and respected the 1.3970–1.3990 support zone.
This zone acted as a bullish mitigation area, showing institutional buying interest.
2. Structure Shift:
After consolidating, USD/CAD broke above short-term highs, confirming a bullish market structure shift (MSS).
The ongoing pullback into the FVG area could serve as a retest entry point.
3. Target Point:
Projected target is around 1.4124, aligning with previous liquidity highs.
This move suggests a potential +100 pips upside from current levels.
4. Trade Plan:
Entry Zone: 1.3980 – 1.4000 (on FVG retest)
Target: 1.4124
Invalidation: Below 1.3950 (if structure fails and price re-enters deeper range)
Mr SMC Trading point
---
Trading Insight:
This setup reflects a Smart Money Concepts (SMC) bullish continuation pattern.
The market has broken structure to the upside and is likely to continue higher after a brief retracement into the fair value gap zone — targeting liquidity resting above 1.4124.
---
Please support boost 🚀 this analysis

USDCADUSDCAD
Bias Bullish
Daily time frame Bulish
4H Bulish
Trade Plan.
Buy Stop
EP: 1.40489
SL: 1.39609
TP:1.41370
RRR 1:1

Usdcad Usdcad form a change of character in 4 hrs chart without collecting liquidity creating a selling narrative

USD/CAD – Weekly POC Support at 1.3952 with Bullish FVGOn USD/CAD 30M chart, buyers built strong positions at 1.3952 — the Weekly Point of Control and origin of a bullish move. This area also aligns with a Fair Value Gap, making it a key support for a long entry on pullback.

USDCAD can test highs again!After the Bullish Breakout in USDCAD we see a sell retest move, still the main Resistance that becomes support haven't been tested yet and it is now accumulating above the Support that suggest us it could first give a fake move testing the support and then proper breakout above, even though if don't test it's support it is still bullish and can also break last high, so keep looking for the buys from support or wait for break of current range the go long.
