USDCAD H1 Technical Analysis
Price remains in a bullish structure following consecutive breaks of structure and a clean displacement to the upside. The market is currently consolidating above the FVG, indicating that short-term order flow is still favoring buyers.
A corrective move toward the FVG/previous structure support around 1.4040–1.4030 would be consistent with healthy retracement behavior before any continuation. As long as price maintains support above this zone, the bullish narrative remains intact with potential for expansion toward the upper target area.
Invalidation occurs on a decisive break below the FVG and the 1.4030 zone, which would signal a deeper corrective phase.
Trade ideas

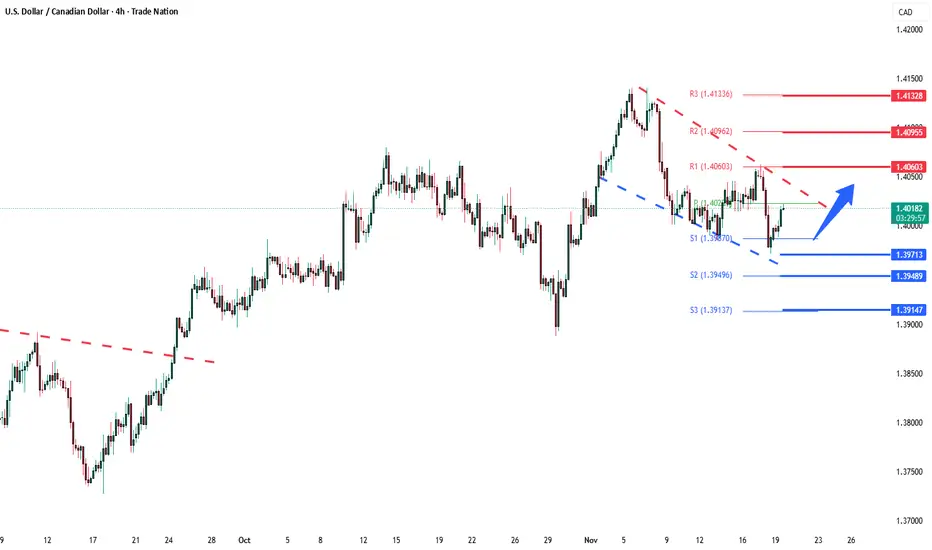
Bullish bounce off key support?Loonie (USD/CAD) is falling towards the pivot which has been identified as an overlap support and could bounce to the 1st resistance.
Pivot: 1.3920
1st Support: 1.3752
1st Resistance: 1.4138
Disclaimer:
The opinions given above constitute general market commentary and do not constitute the opinion or advice of IC Markets or any form of personal or investment advice.
Any opinions, news, research, analyses, prices, other information, or links to third-party sites contained on this website are provided on an "as-is" basis, are intended to be informative only, and are not advice, a recommendation, research, a record of our trading prices, an offer of, or solicitation for, a transaction in any financial instrument and thus should not be treated as such. The information provided does not involve any specific investment objectives, financial situation, or needs of any specific person who may receive it. Please be aware that past performance is not a reliable indicator of future performance and/or results. Past performance or forward-looking scenarios based upon the reasonable beliefs of the third-party provider are not a guarantee of future performance. Actual results may differ materially from those anticipated in forward-looking or past performance statements. IC Markets makes no representation or warranty and assumes no liability as to the accuracy or completeness of the information provided, nor any loss arising from any investment based on a recommendation, forecast, or any information supplied by any third party.

USDCAD 4HPrice broke out of the falling channel bullish reversal pattern after making a bullish reaction off the 4 hour order block (orange zone), breaking the lower timeframe structure to the upside forming a higher high. Price has now made a pullback for a higher low, where I will be anticipating for a bullish continuation to resume the higher timeframe trend aiming for the zones above.

Long trade 📌 Pair: USDCAD
Direction: Buyside
Date: Wed 19th Nov 25
Time: 10.00 am
Entry: 1.40172
Profit Level: 1.42724 (+0.75%)
Stop Level: 1.40118 (-0.03%)
RR: 19.48R
📘 USD/CAD — 1H Breakdown (Buyside Expansion)
Model: Sweep → Displacement → Accumulation -Breaker
1️⃣ Market Structure Overview
Recent Key Events
✔️ Sweep of highs – 14th Oct (1.40801)
Price took the previous swing high → engineered liquidity → redistributed lower.
✔️ Sweep of lows – 8th Oct (8:00am)
Liquidity is taken below the 1.387 area, forming a major swing low.
✔️ Strong bullish leg follows → up into 0.618 retracement (1.41237)
2️⃣ Displacement Leg & Fibonacci Confluence
After sweeping the lows, the price created a strong bullish displacement into:
0.618 retracement — 1.41237
NY High (above)
Range High 1.41407
1.000 extension target 1.42170
Current Structure
After the swing low sweep, the market expanded bullish, retraced, and is now moving inside a tight accumulation range. Multiple session markers (Tokyo → London → NY) show Equal highs/ equal lows, as well as repeated rejections from a micro-breaker zone.
Market Narrative
USDCAD swept major lows early November, engineered liquidity for a bullish leg, then delivered strong displacement up into the mid-range. The pair has since been accumulating in a tight range, repeatedly defending the 1.3980–1.4000 zone (discount), while leaving a large unmitigated breakaway gap resting above.
15min TF overview

USDCAD uptrend still holdingUSDCAD uptrend still looks strong, I am looking for long entries in 2 different scenarios. If the current November low holds at 1.39854 and that is the low for the month, I would put my risk there. If it doesn't hold and creates a new November low but the low of October hold at 1.38877 would need to hold. In both those scenarios I remain bullish
looking for entires to the upside. Only if the October low breaks will I think reevaluate my bullish view. OANDA:USDCAD

Weekly FOREX Forecast: USDCAD, USDCHF & USDJPY Are Bullish!Welcome to Part 2 of The Weekly FOREX FORECAST!
Part 1 covered USD, EU, GU, AU, NU in the previous video.
In this video, we will analyze the following FX markets:
USD Index, USDCAD, USDCHF, and USDJPY.
Enjoy!
May profits be upon you.
Leave any questions or comments in the comment section.
I appreciate any feedback from my viewers!
Like and/or subscribe if you want more accurate analysis.
Thank you so much!
Disclaimer:
I do not provide personal investment advice and I am not a qualified licensed investment advisor.
All information found here, including any ideas, opinions, views, predictions, forecasts, commentaries, suggestions, expressed or implied herein, are for informational, entertainment or educational purposes only and should not be construed as personal investment advice. While the information provided is believed to be accurate, it may include errors or inaccuracies.
I will not and cannot be held liable for any actions you take as a result of anything you read here.
Conduct your own due diligence, or consult a licensed financial advisor or broker before making any and all investment decisions. Any investments, trades, speculations, or decisions made on the basis of any information found on this channel, expressed or implied herein, are committed at your own risk, financial or otherwise.

USDCAD Will Go Higher! Long!
Please, check our technical outlook for USDCAD.
Time Frame: 5h
Current Trend: Bullish
Sentiment: Oversold (based on 7-period RSI)
Forecast: Bullish
The market is trading around a solid horizontal structure 1.401.
The above observations make me that the market will inevitably achieve 1.407 level.
P.S
Overbought describes a period of time where there has been a significant and consistent upward move in price over a period of time without much pullback.
Like and subscribe and comment my ideas if you enjoy them!

USDCAD3-30M TF - Major Trend Changed SELL TP 1.4028330Min Trading - Improve 70% Winning Rate.
USDCAD : Major Trend changed to SELL in M30
Multiple MA - 26 and 50 in M30
SL : 1.40283
TP : 1.39600
Good Luck.
USD/CAD 4H Bullish Channel Continuation From Key Demand ZoneUSD/CAD continues to respect its ascending channel on the 4H timeframe, with price recently rebounding from a well-defined demand zone that aligns with structural support. This reaction confirms continued bullish interest and maintains the overall upward market structure. As long as price holds above this zone, the probability favors a continuation toward the upper boundary of the channel. This setup highlights a strong trend-following opportunity supported by momentum, structure, and confluence.

Bullish bounce off?Loonie (USD/CAD) has bounced off the pivot, which is a pullback support and could rise to the 1st resistance which has been identified as a pullback resitance that aligns witht he 78.6% FIbonacci retracement.
Pivot: 1.4019
1st Support: 1.3981
1st Resistance: 1.4092
Disclaimer:
The opinions given above constitute general market commentary and do not constitute the opinion or advice of IC Markets or any form of personal or investment advice.
Any opinions, news, research, analyses, prices, other information, or links to third-party sites contained on this website are provided on an "as-is" basis, are intended to be informative only, and are not advice, a recommendation, research, a record of our trading prices, an offer of, or solicitation for, a transaction in any financial instrument and thus should not be treated as such. The information provided does not involve any specific investment objectives, financial situation, or needs of any specific person who may receive it. Please be aware that past performance is not a reliable indicator of future performance and/or results. Past performance or forward-looking scenarios based upon the reasonable beliefs of the third-party provider are not a guarantee of future performance. Actual results may differ materially from those anticipated in forward-looking or past performance statements. IC Markets makes no representation or warranty and assumes no liability as to the accuracy or completeness of the information provided, nor any loss arising from any investment based on a recommendation, forecast, or any information supplied by any third party.

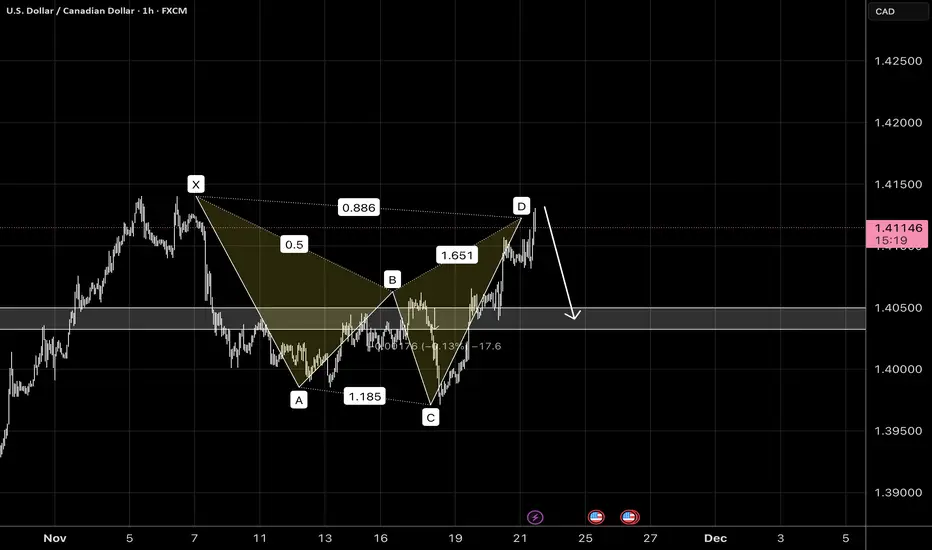
shark into the 5-0 ? nice setup in the Canadian dollar and the shark pattern has counted complete with a possible reversal targeting the 50% retrace @ 14030-50.
USDCAD H1 | Bearish Reaction off Key ResistanceMomentum: Bearish
Price is currently below the ichimoku cloud.
Sell entry: 1.4018
- Strong pullback resistance
- 50% Fib retracement
- 100% Fib projection
Stop Loss: 1.40557
- Multi-swing high resistance
Take Profit: 1.39770
- Swing low support
High Risk Investment Warning
Stratos Markets Limited (tradu.com/uk ), Stratos Europe Ltd (tradu.com/eu ):
CFDs are complex instruments and come with a high risk of losing money rapidly due to leverage. 70% of retail investor accounts lose money when trading CFDs with this provider. You should consider whether you understand how CFDs work and whether you can afford to take the high risk of losing your money.
Stratos Global LLC (tradu.com/en ): Losses can exceed deposits.
Please be advised that the information presented on TradingView is provided to Tradu (‘Company’, ‘we’) by a third-party provider (‘TFA Global Pte Ltd’). Please be reminded that you are solely responsible for the trading decisions on your account. Any information and/or content is intended entirely for research, educational and informational purposes only and does not constitute investment or consultation advice or investment strategy. The information is not tailored to the investment needs of any specific person and therefore does not involve a consideration of any of the investment objectives, financial situation or needs of any viewer that may receive it. Past performance is not a reliable indicator of future results. Actual results may differ materially from those anticipated in forward-looking or past performance statements. We assume no liability as to the accuracy or completeness of any of the information and/or content provided herein and the Company cannot be held responsible for any omission, mistake nor for any loss or damage including without limitation to any loss of profit which may arise from reliance on any information supplied by TFA Global Pte Ltd.

USDCAD H4 | Heading Into 50% Fibonacci ResistanceMomentum: Bearish
Price is currently moving toward the sell entry level, positioned slightly above the 50% Fibonacci retracement.
Sell Entry: 1.4037
Pullback resistance
Aligned just above the 50% Fibonacci retracement
Stop Loss: 1.4096
Swing high resistance
Positioned slightly below the 78.6% Fibonacci retracement
Take Profit: 1.3982
Strong overlap support
Aligned with the 50% Fibonacci retracement
High Risk Investment Warning
Stratos Markets Limited (tradu.com ), Stratos Europe Ltd (tradu.com ):
CFDs are complex instruments and come with a high risk of losing money rapidly due to leverage. 70% of retail investor accounts lose money when trading CFDs with this provider. You should consider whether you understand how CFDs work and whether you can afford to take the high risk of losing your money.
Stratos Global LLC (tradu.com ): Losses can exceed deposits.
Please be advised that the information presented on TradingView is provided to Tradu (‘Company’, ‘we’) by a third-party provider (‘TFA Global Pte Ltd’). Please be reminded that you are solely responsible for the trading decisions on your account. Any information and/or content is intended entirely for research, educational and informational purposes only and does not constitute investment or consultation advice or investment strategy. The information is not tailored to the investment needs of any specific person and therefore does not involve a consideration of any of the investment objectives, financial situation or needs of any viewer that may receive it. Past performance is not a reliable indicator of future results. Actual results may differ materially from those anticipated in forward-looking or past performance statements. We assume no liability as to the accuracy or completeness of any of the information and/or content provided herein and the Company cannot be held responsible for any omission, mistake nor for any loss or damage including without limitation to any loss of profit which may arise from reliance on any information supplied by TFA Global Pte Ltd.

Bullish bounce off?Loonie (USD/CAD) has bounced off the pivot and could potentially rise to the 78.6% Fibonacci resistance.
Pivot: 1.3976
1st Support: 1.3865
1st Resistance: 1.4308
Disclaimer:
The opinions given above constitute general market commentary and do not constitute the opinion or advice of IC Markets or any form of personal or investment advice.
Any opinions, news, research, analyses, prices, other information, or links to third-party sites contained on this website are provided on an "as-is" basis, are intended to be informative only, and are not advice, a recommendation, research, a record of our trading prices, an offer of, or solicitation for, a transaction in any financial instrument and thus should not be treated as such. The information provided does not involve any specific investment objectives, financial situation, or needs of any specific person who may receive it. Please be aware that past performance is not a reliable indicator of future performance and/or results. Past performance or forward-looking scenarios based upon the reasonable beliefs of the third-party provider are not a guarantee of future performance. Actual results may differ materially from those anticipated in forward-looking or past performance statements. IC Markets makes no representation or warranty and assumes no liability as to the accuracy or completeness of the information provided, nor any loss arising from any investment based on a recommendation, forecast, or any information supplied by any third party.

USDCAD LongMarket structure bullish on HTFs 3
Entry at Daily AOi
Weekly Rejection at AOi
Previous Weekly Structure Point
Daily Rejection at AOi
Around Psychological Level 1.40500
Touching EMA H4
H4 Candlestick rejection
TP: WHO KNOWS!
Entry 100%
REMEMBER : Trading is a Game Of Probability
: Manage Your Risk
: Be Patient
: Every Moment Is Unique
: Rinse, Wash, Repeat!
: Christ is King.

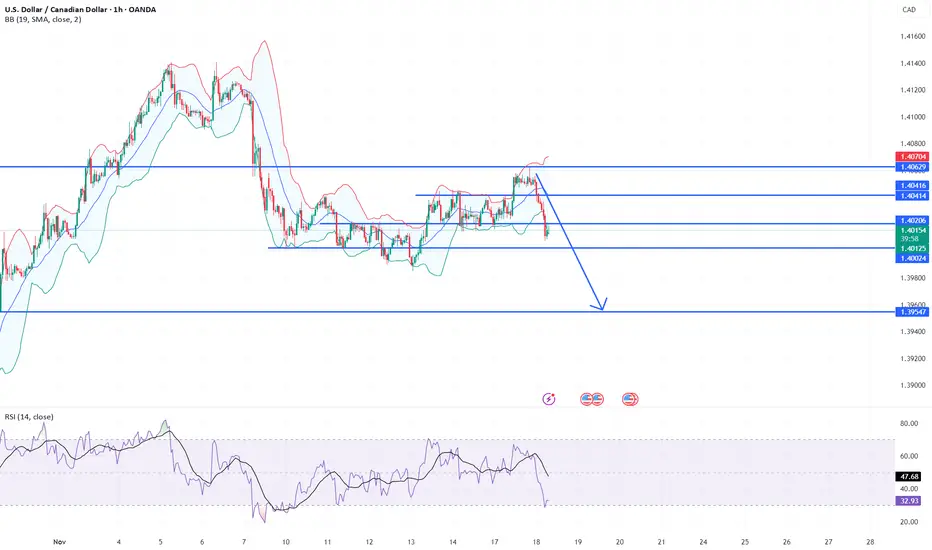
USD/CAD SENDS CLEAR BEARISH SIGNALS|SHORT
Hello, Friends!
Previous week’s green candle means that for us the USD/CAD pair is in the uptrend. And the current movement leg was also up but the resistance line will be hit soon and upper BB band proximity will signal an overbought condition so we will go for a counter-trend short trade with the target being at 1.403.
Disclosure: I am part of Trade Nation's Influencer program and receive a monthly fee for using their TradingView charts in my analysis.
✅LIKE AND COMMENT MY IDEAS✅

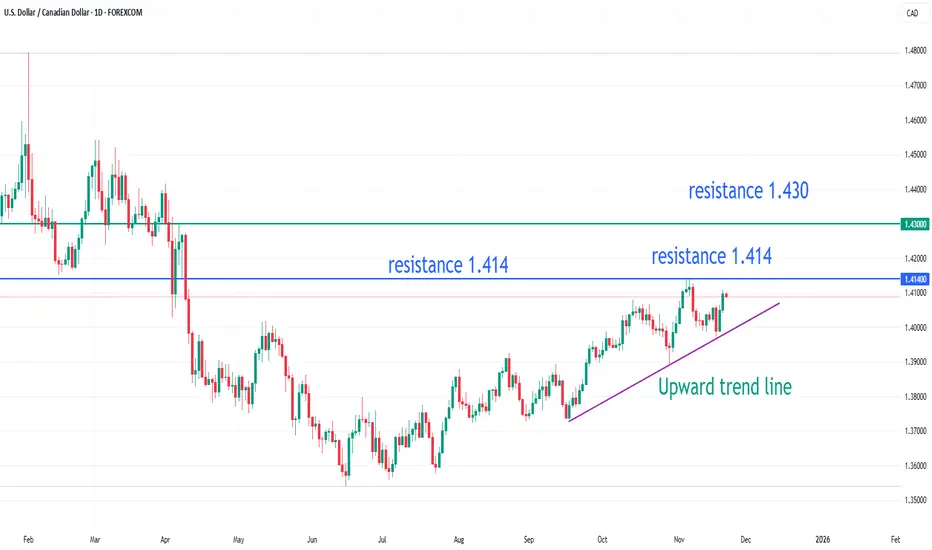
USDCAD is expected to break through 1.414.On the daily chart, USDCAD rebounded and stabilized after testing the upward trend line, indicating a short-term bullish trend. Currently, watch for support around 1.406; a pullback and stabilization above this level could present buying opportunities. Resistance is seen around 1.414, with further resistance around 1.430 after a break above this level.
USDCAD bullish continuation pattern developing
The USDCAD remains in a bullish trend, with recent price action showing signs of a corrective pullback within the broader uptrend.
Support Zone: 1.3970 – a key level from previous consolidation. Price is currently testing or approaching this level.
A bullish rebound from 9490 would confirm ongoing upside momentum, with potential targets at:
1.4060 – initial resistance
1.4100 – psychological and structural level
1.4130 – extended resistance on the longer-term chart
Bearish Scenario:
A confirmed break and daily close below 1.3970 would weaken the bullish outlook and suggest deeper downside risk toward:
1.3950 – minor support
1.3915 – stronger support and potential demand zone
Outlook:
Bullish bias remains intact while the USDCAD holds above 1.3970. A sustained break below this level could shift momentum to the downside in the short term.
This communication is for informational purposes only and should not be viewed as any form of recommendation as to a particular course of action or as investment advice. It is not intended as an offer or solicitation for the purchase or sale of any financial instrument or as an official confirmation of any transaction. Opinions, estimates and assumptions expressed herein are made as of the date of this communication and are subject to change without notice. This communication has been prepared based upon information, including market prices, data and other information, believed to be reliable; however, Trade Nation does not warrant its completeness or accuracy. All market prices and market data contained in or attached to this communication are indicative and subject to change without notice.
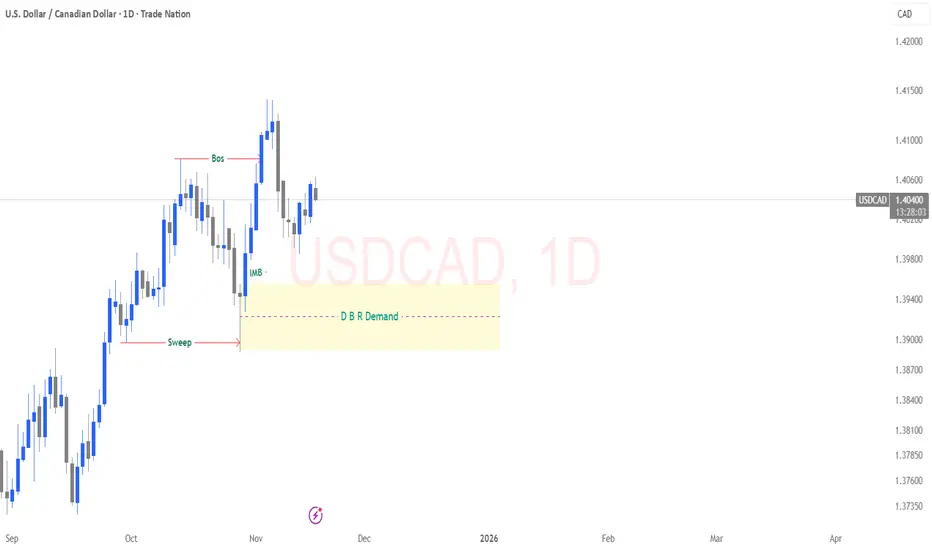
USDCAD – Clean Daily Buy Scenario Price has already established a bullish Break of Structure (BOS), confirming upside order flow on the daily timeframe. After that BOS, the market dipped back down to sweep the previous low, clearing out sell-side liquidity and creating the fuel required for a bullish continuation.
From there, price impulsively rallied, leaving behind a clear imbalance (IMB) and an unmitigated Daily DBR Demand zone the origin of the bullish displacement.
As price pulls back, the expectation is for a corrective move into this DBR demand. This zone represents discounted pricing aligned with the dominant trend and offers high-probability buy setups once lower-timeframe confirmations show up (reaction, BOS, or displacement).
If this demand holds, the next bullish leg should target the highs created above the imbalance, continuing the overall upward structure.
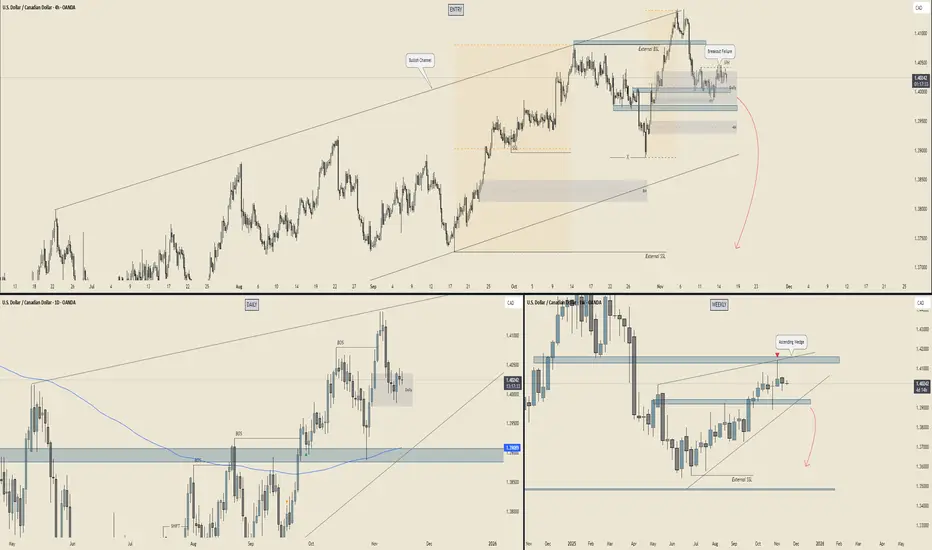
USD/CAD - Multi Timeframe Analysis🧱 WEEKLY – The Big Dog View
Bias: 🐻 Bearish pressure building
Why:
Price is pushing into that massive weekly supply while sitting inside an ascending wedge — textbook distribution energy.
The wedge resistance + supply block is basically a double whammy ceiling.
Reaction wicks show buyers getting tired… sellers warming up.
Beneath current price? A HUGE vacuum of clean, unmitigated price action → easy liquidity to the downside.
🎯 Weekly Target Zones:
1.3900–1.3850 = first stop (mid-range demand)
1.3650–1.3550 = main deep target
External SSL much lower = long-term magnet
👉 Weekly says: “Yo… down only unless we get a breakout above supply.”
📆 DAILY – Internal Structure Rolling Over
Bias : 🐻 Turning bearish
Why : Daily BOS formed on the drop → clear bearish intent.
Price pulled back into a fresh daily supply, reacted cleanly, and is now stalling.
Daily is coiling under resistance = distribution micro-pattern.
As long as the daily mitigation block holds, rallies are just liquidity grabs.
🔥 Daily Key Levels:
Hold below 1.4070 = bearish continuation
Break below 1.3950 = flush into 1.3900
Lose 1.3900 = full send toward 1.38 → 1.37
👉 Daily is setting up the breakdown leg.
⏳ 4H – The Execution Chart (The Juice)
Bias : 🐻 Bearish retest + roll
Why : The 4H bullish channel got broken → structure shift.
We even have a breakout failure at the top = classic “trap the buyers then nuke it.”
4H supply stacking beautifully (Daily + 4H combo).
Price trapped sideways waiting for a trigger → likely a fake-out pop then drop, or a straight collapse.
📌 4H Key Areas:
4H supply: 1.4030–1.4060 = Sell zone
4H support: 1.3950 = Break this → waterfall
Next demand: 1.3880 then the huge imbalance to 1.3800
🎯 4H Targets:
Short-term: 1.3950
Medium: 1.3880
Main: 1.3800
🚀 SUMMARY – USD/CAD Forecast
🔥 Overall Bias: BEARISH (Weekly + Daily + 4H aligned)
🔽 Direction: Expect downside continuation
🎯 Main Target: 1.3800
🧯 Invalidation: Clean daily close above 1.4070 (rare unless oil nukes or USD goes parabolic)
✨ The Likely Path:
Small 4H pullback into supply
Break of 1.3950 internal floor
Fast slide into 1.3880
Larger drop toward 1.3800–1.3750
USD/CAD 1h **rising wedge** pattern **inside a higher-timeframe.The market is currently forming a **rising wedge** pattern **inside a higher-timeframe resistance zone** (the yellow area).
### **What this structure usually indicates**
A **rising wedge** inside resistance is typically a **bearish reversal pattern**, meaning:
* Price is moving upward but with **weak momentum**.
* Buyers are losing strength.
* Sellers may soon take control.
### **Most likely scenario**
✔ **High probability:** A **breakdown below the lower wedge trendline**, leading price back toward
**1.3990 → 1.3950** levels.
### **Why?**
* Price is repeatedly rejecting the same resistance zone (yellow box).
* The wedge is narrowing → indicates exhaustion.
* The EMA cluster shows **sideways / weak bullish pressure**.
### **Confirmation to watch for**
1. Candle close **below wedge support**
2. Retest of the broken trendline
3. Bearish continuation
### **Invalidation**
If price **breaks above the wedge top** and closes above **1.4050**, structure becomes bullish.
---

1:2.5 rrr USDCAD Long (70 pips)price bounce on support
price break wedge pattern and a minor resistance
price retest minor resistance

USD/CAD - Fundamental Drives (13.11.2025)🧠 Setup Overview OANDA:USDCAD
USD/CAD continues to face strong rejection from the resistance zone, with price failing multiple times to break above the 1.4020–1.4045 supply area.
The market structure remains bearish as the pair forms lower highs and struggles to sustain upside momentum.
With fundamentals also favoring CAD strength, the downside scenario remains more probable.
📊 Trading Plan🔻 Sell Bias
Look for bearish confirmation near or below the resistance zone
Continuation to the downside expected toward key support levels
🎯 Targets:
1st Support: 1.3969
2nd Support: 1.3950
🔰 Resistance Zone: 1.4020 – 1.4045
⚡ Fundamental Updates (Today – 13 Nov 2025)
1️⃣ Bank of Canada (BoC) signaled no further interest rate cuts, which strengthened the CAD.
• A stable or moderately hawkish BoC typically supports CAD appreciation.
2️⃣ US Treasury yields continue to fall as markets increase bets on the Federal Reserve easing policy in the coming months.
• Lower yields = weaker USD, helping push USD/CAD lower.
📌 High Impact Event Today:
USD - CPI (Inflation Rate) → A softer CPI reading could accelerate USD weakness.
#USDCAD #Forex #TechnicalAnalysis #PriceAction #ResistanceZone #FXMarket #FundamentalAnalysis #ChartPatterns #KABHI_TA_TRADING #ChartsDontLieTradersDontQuit #USD #CAD #TradingView #ForexSignals #BearishSetup #IntradayTrading
⚠️ Disclaimer
This analysis is for education only. It is not financial advice.
Always apply proper risk management and trade based on your own confirmation.
💬 Support My Work ❤️
If this analysis helps you —👉 LIKE 👍 👉 COMMENT 💬 👉 FOLLOW 🔔
Your support motivates more daily chart breakdowns and setups!
