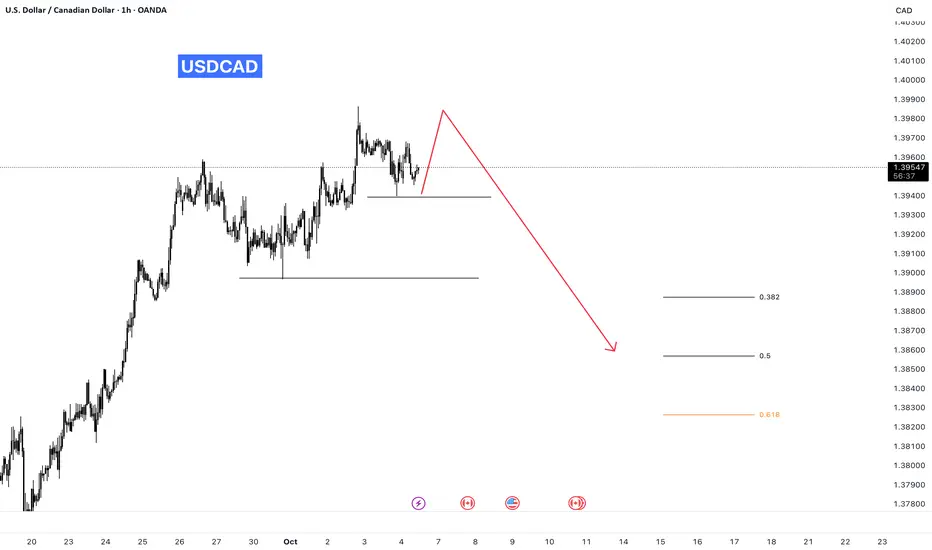
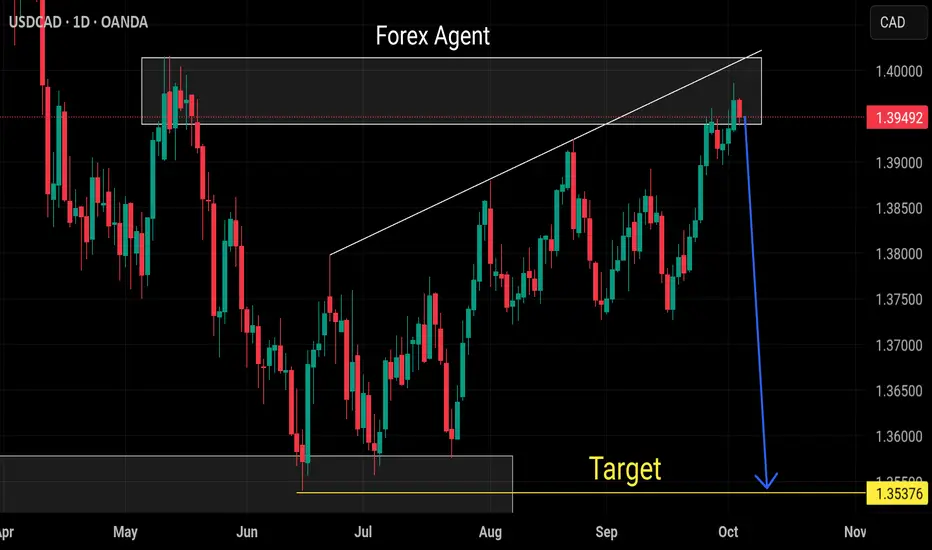
usdcad bearish swing setupRSI Divergence
Wait for a double top formation.
Enter on the last higher low (HL).
Maintain a risk-to-reward ratio (RRR) of 1:2.
The bullish trend on the higher timeframe should ideally correct to the 50–60% Fibonacci retracement level.
Trade ideas
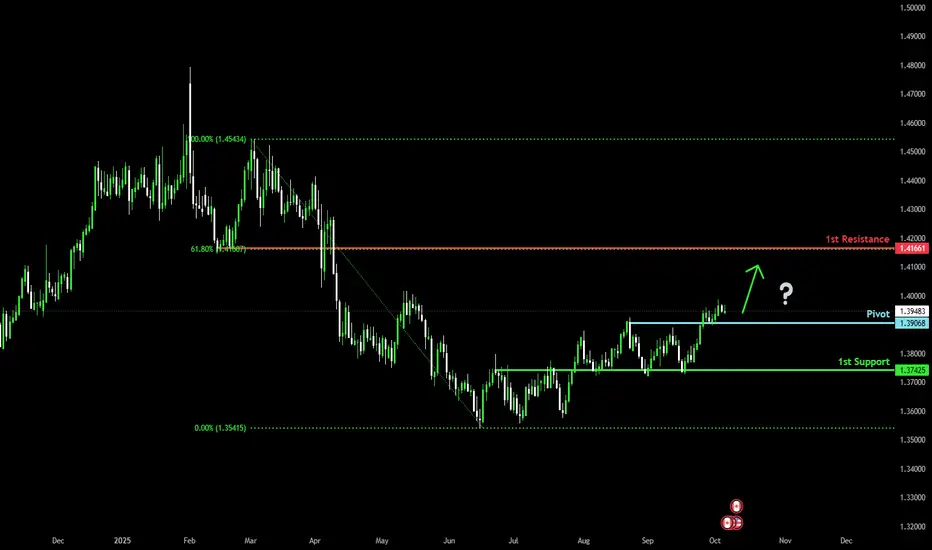
Bullish momentum set to continue?The loonie (USD/CAD) is falling towards the pivot and could bounce to the 61.8% Fibonacci resistance.
Pivot: 1.3906
1st Support: 1.3742
1st Resistance: 1.4166
Disclaimer:
The above opinions given constitute general market commentary, and do not constitute the opinion or advice of IC Markets or any form of personal or investment advice.
Any opinions, news, research, analyses, prices, other information, or links to third-party sites contained on this website are provided on an "as-is" basis, are intended only to be informative, is not an advice nor a recommendation, nor research, or a record of our trading prices, or an offer of, or solicitation for a transaction in any financial instrument and thus should not be treated as such. The information provided does not involve any specific investment objectives, financial situation and needs of any specific person who may receive it. Please be aware, that past performance is not a reliable indicator of future performance and/or results. Past Performance or Forward-looking scenarios based upon the reasonable beliefs of the third-party provider are not a guarantee of future performance. Actual results may differ materially from those anticipated in forward-looking or past performance statements. IC Markets makes no representation or warranty and assumes no liability as to the accuracy or completeness of the information provided, nor any loss arising from any investment based on a recommendation, forecast or any information supplied by any third-party.
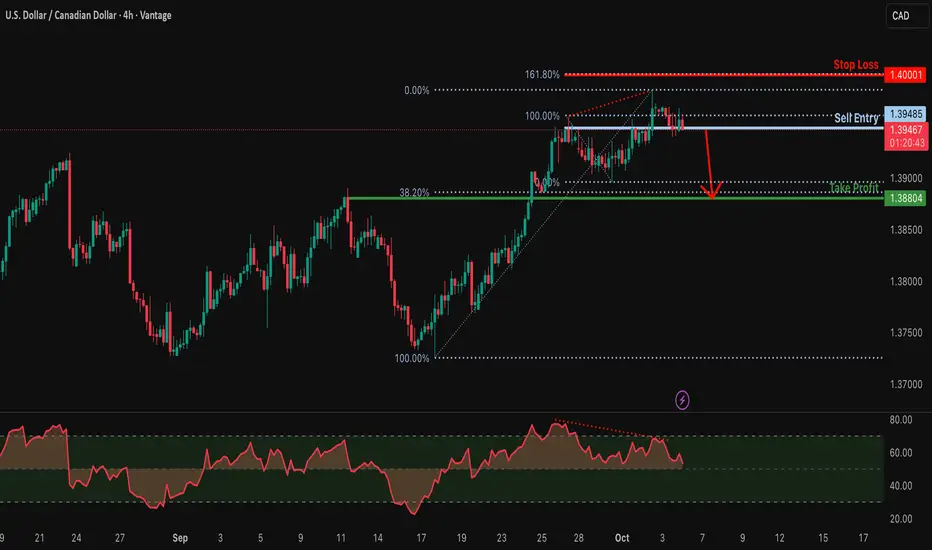
Potential bearish reversal for the Loonie?The price is reacting off the resistance level which is a pullback resistance, and could drop from this level to our take profit.
Entry: 1.3948
Why we like it:
There is a pullback resistance.
Stop loss: 1.4000
Why we like it:
There is a resistance level which aligns with the 161.8% Fibonacci extension.
Take profit: 1.3880
Why we like it:
There is a pullback support level which lines up with the 38.2% Fibonacci retracement.
Enjoying your TradingView experience? Review us!
Please be advised that the information presented on TradingView is provided to Vantage (‘Vantage Global Limited’, ‘we’) by a third-party provider (‘Everest Fortune Group’). Please be reminded that you are solely responsible for the trading decisions on your account. There is a very high degree of risk involved in trading. Any information and/or content is intended entirely for research, educational and informational purposes only and does not constitute investment or consultation advice or investment strategy. The information is not tailored to the investment needs of any specific person and therefore does not involve a consideration of any of the investment objectives, financial situation or needs of any viewer that may receive it. Kindly also note that past performance is not a reliable indicator of future results. Actual results may differ materially from those anticipated in forward-looking or past performance statements. We assume no liability as to the accuracy or completeness of any of the information and/or content provided herein and the Company cannot be held responsible for any omission, mistake nor for any loss or damage including without limitation to any loss of profit which may arise from reliance on any information supplied by Everest Fortune Group.
USDCAD | Possible Reaction From Supply ZoneAs we kick off the new week, price action on USDCAD is currently reacting around a higher timeframe Supply Zone after an extended bullish leg from the recent equal lows (EQL). The pair has pushed into a premium pricing area, which often aligns with potential distribution zones where institutions may seek to offload positions.
We can observe a clean Break of Structure (BOS) to the upside, followed by a mitigation of imbalance (IMB). However, the recent rejection wicks within the supply zone may hint at early signs of exhaustion.
If price respects this supply area, we could see a move back toward the Hidden Base or Discount Zone, where fresh demand might step in. The area between 1.3690 – 1.3600 marks an interesting Major Demand Zone, which could serve as a re-accumulation point if bearish order flow takes over.
At this stage, it’s important to remain patient and observe how price behaves — whether the supply holds or if buyers manage to break through and continue the uptrend.
This is not a trade idea, just a possible outlook based on structure, liquidity, and supply-demand dynamics.

USDCAD – Short Opportunity at Daily Resistance (1.3945 – 1.3965)The USDCAD pair is currently testing a critical daily resistance zone between 1.3945 and 1.3965. This area has historically acted as a strong supply zone where sellers stepped in and pushed the price lower.
From a technical perspective, the recent bullish rally brought the price directly into this resistance block, while momentum indicators (RSI / Stochastic) are showing overbought conditions on both H4 and H1 timeframes. This combination suggests that a potential correction could occur from the current levels.
🔎 Technical Outlook
Resistance Zone: 1.3945 – 1.3965 (red area)
TP1: 1.3900 → first short-term support, potential initial profit-taking area
TP2: 1.3868 → key Fibonacci retracement level, stronger support zone
Stop Loss: Above 1.3965 → a confirmed breakout here may open the path toward 1.4000–1.4020
⚖️ Risk/Reward
Risk/Reward ratio ≈ 1:2.5, providing a favorable setup for swing traders.
Entry near resistance offers limited downside risk compared to the potential reward toward Fibonacci levels.
📌 Trading Idea
Sell Entries: 1.3945 – 1.3960
Targets:
TP1: 1.3900
TP2: 1.3868
Stop Loss: Daily close above 1.3965
If the pair breaks and sustains above 1.3965 on a daily closing basis, bullish momentum could extend toward the psychological 1.4000 level, invalidating the short setup.
💡 Conclusion
USDCAD is offering a potential short setup from a well-defined daily resistance zone. As long as the 1.3965 level holds, the pair may correct toward 1.3900 and even deeper to 1.3868. A break above 1.3965, however, would signal bullish continuation.
#USDCAD #Forex #FX #CurrencyTrading #TechnicalAnalysis #PriceAction #ChartAnalysis #TradingView #MarketOutlook #ForexTrading #SwingTrade #DayTrading #RiskReward #PriceLevels #ForexSetups

USDCAD LONGWe are awaiting for the Retest of the bullish order block. if it does not get violated we enter at that point. Let see how it goes

Strong sell usdcadStrong sell level reached
Upward resistance trend reached
Waiting to sweep high then sell with confirmation
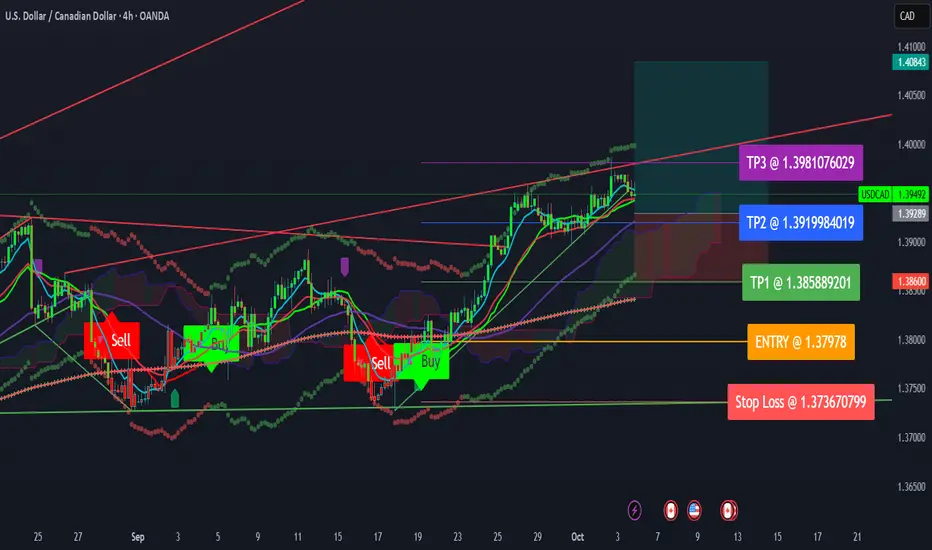
USDCADCOT Positioning: USD long 36.53%, short 63.47%; CAD long 11.95%, short 88.05%.
Bias: Very Bullish for USD/CAD — institutions remain heavily net short CAD and moderately long USD.
Seasonality: +0.61% (historically supportive for USD strength).
Economic Score: CAD weaker across employment (-0.12%) and inflation, while USD maintains relative stability.
Price trades around 1.3949, showing a breakout structure from the 1.3900 resistance zone — now turned support. The trend remains upward with higher highs and higher lows. Momentum suggests continuation toward next resistance levels.
USDCAD
Primary Setup (Bullish)
Direction: BUY USDCAD
Entry Zone: 1.3920 – 1.3950 (on minor pullback or retest of breakout zone)
Stop-Loss: 1.3860
Take-Profit Targets:
TP1: 1.4020
TP2: 1.4100
Alternative Setup (If Primary Fails)
Direction: SELL USDCAD
Entry: Below 1.3860 (break of support + retest confirmation)
Stop-Loss: 1.3920
Take-Profit Targets:
TP1: 1.3780
TP2: 1.3700
USD/CAD Bullish Heist Plan – Will You Join the Crew?💼💸 USD/CAD "The Loonie" – Bullish Vault Heist Plan 🕶️📈
"Layer the Entry. Stack the Cash. Escape Clean."
🧠 Mastermind Setup (Thief Trader Blueprint)
🔍 Asset: USD/CAD – The Loonie (Forex Market)
📜 Plan: Bullish — Thief is moving in with precision layering strategy.
📈 Entry Plan:
Thief’s not kicking the door once—he’s picking multiple locks!
Layer those buy limits for stealth entries:
(1.37700) 🏦 | (1.37500) 💰 | (1.37300) 🔑 | (1.37000) 🚪
💡 Add more layers if the vault’s deeper than expected.
🛑 Stop Loss (SL):
🎯 Official Thief SL parked @ 1.37000.
But remember—OG thieves adjust SL to match their risk appetite & personal strategy.
🎯 Target: 1.38680 – Grab the loot and vanish!
📢 Heist Intel (Market Context)
USD/CAD is eyeing upside momentum, powered by USD strength + oil price plays.
Expect pullbacks before the real breakout—perfect for layered infiltration.
⚠️ Thief’s Street Rules:
Don’t enter during high-impact news — guards will be on alert.
Use trailing stops to protect the loot once in profit.
Layer patiently—don’t rush the vault door.
💣 Final Words from the Crew:
Every pip is a coin in the bag. Stay disciplined, stay layered, and leave no trace. 🐱👤💎
💖 Boost the plan, share with the crew, and let’s make this Loonie Heist legendary. 🚀💼

USDCAD Rejected on its 1D MA200. Sell signal.Last time we looked at the USDCAD pair (August 21, see chart below), the Channel Up gave us an excellent sell signal right on its top, which easily hit our 1.37715 Target:
The market is currently giving us a strong signal yet again as the price not only hit the top of its Channel Up but also the 1D MA200 (orange trend-line) for the first time since May 13 2025.
That was the time it suffered a brutal rejection to multi-month lows and again upon testing it yesterday, it is being rejected.
With the 1D RSI also hitting its own Resistance Zone, we expect the price to pull-back to at least its 0.5 Fibonacci retracement level, similar to August 07. As a result, our short-term Target is 1.8570.
-------------------------------------------------------------------------------
** Please LIKE 👍, FOLLOW ✅, SHARE 🙌 and COMMENT ✍ if you enjoy this idea! Also share your ideas and charts in the comments section below! This is best way to keep it relevant, support us, keep the content here free and allow the idea to reach as many people as possible. **
-------------------------------------------------------------------------------
💸💸💸💸💸💸
👇 👇 👇 👇 👇 👇

USDCAD flag pattern Long Usdcad has formed a bullish flag pattern breakout could lead to target of 1.4 , SL 1.389. Let us see how it plays out..

UsdCadafter a big breakout we see a good retracement till to our fibo zone 61.8 or 78.60 but we might see it during hours or day and till to see a good bearish candle from our sell point...
lets see
Bullish momentum A clear play accumulation manipulation and then distribution, we shall be targeting buyside liquidity. We shall be taking our longs from the m30 bisi just below the accumulation.

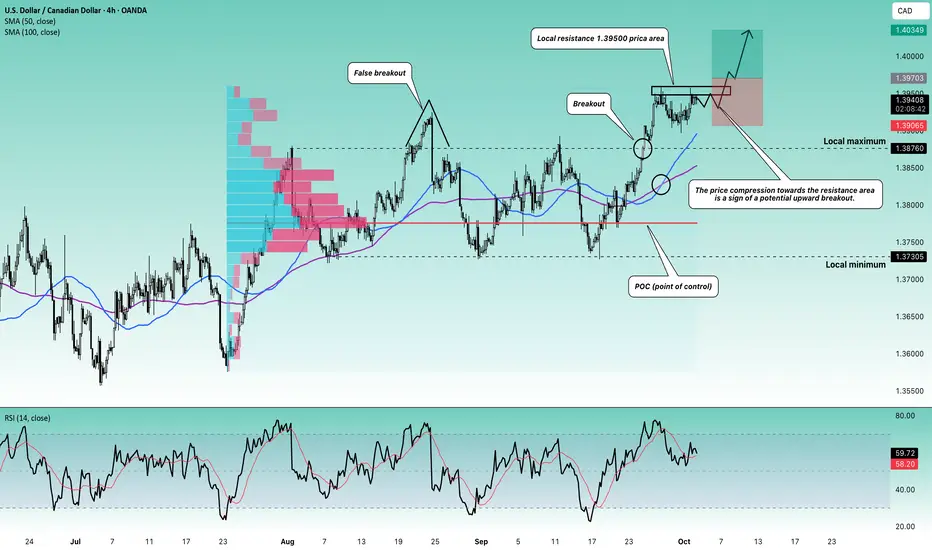
Stop!Loss|Market View: USDCAD🙌 Stop!Loss team welcomes you❗️
In this post, we're going to talk about the near-term outlook for the USDCAD currency pair☝️
Potential trade setup:
🔔Entry level: 1.39703
💰TP: 1.40349
⛔️SL: 1.39065
"Market View" - a brief analysis of trading instruments, covering the most important aspects of the FOREX market.
👇 In the comments 👇 you can type the trading instrument you'd like to analyze, and we'll talk about it in our next posts.
💬 Description: The price compression toward the 1.39500 resistance area indicates a potential upside breakout. Given the recent breakout of the 1.37305 - 1.38760 accumulation, a more significant upward movement to 1.4, 1.41, and then 1.43 is also expected. A conservative entry would be best looked for after the price immediately closes above 1.39500.
Thanks for your support 🚀
Profits for all ✅
❗️ Updates on this idea can be found below 👇
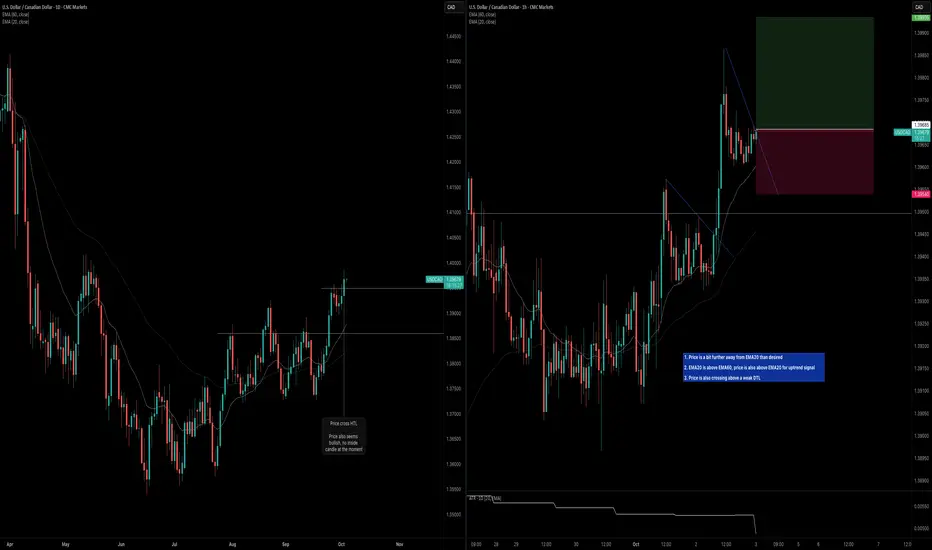
USDCAD: Uptrend ContinuationDaily Timeframe:
Price crosses above HTL and is holding
No inside bar formed yet so unlikely to see loss of momentum over the next day
H1 Timeframe:
Not idea that price is a bit further away from EMA20
Uptrend is indicated by EMA20 being above EMA60 and price being above EMA20
The DTL is also not a strong plot so reducing size
Price Alert: USD/CAD Extends into Key ResistanceThe USD/CAD advance exhausted into the median-line of an ascending pitchfork extending off the July low and the immediate focus is on a reaction off this mark.
The resistance zone in focus is at the 2022 high / 200-day moving average / 2020 March weekly reversal close at 1.3978/90. A topside breach / close above this threshold is needed to fuel the next major leg of the June advance at 1.4019 and the 1.41-handle.
Initial support rests at 1.3881/99 with near-term bullish invalidation now raised to the 61.38% retracement of the September rally / September 11 outside reversal close at 1.3826/32.
Bottom line: USD/CAD is testing major resistance here and the immediate advance may be vulnerable while below this threshold near-term. From a trading standpoint, losses should be limited to the lower parallel / 1.3826 IF price is heading for a breakout on this stretch with a breach / close above the 200-day moving average needed to mark uptrend resumption.
Keep in mind that NFPs will be delayed amid the U.S. government shutdown but we do get key Canada employment data next week. Stay nimble into the October open and watch the weekly closes here for guidance.
-MB

USDCAD UPSIDE MOMENTUM OPPORTUNITYTECHNICALLY:
USDCAD remains very bullish due to US dollar strenght. From now price tested a interesting H4 ORDERBLOCK zone. Price is quite over extended but it's worth to give a try. As we can see price manage to manipulate MONDAY LOW. if dollar continue bullish then this pair will move up Otherwise the trade idea will be invalidated and that's okay because we manage the risk properly.
FUNDAMENTALLY
US DOLLAR CONTINUE TO BE BULLISH. A SMALL RETRACEMENT BUT A CLEAR BULLISH CONTINUATION BY POSITIVE CORRELATION INDICATES BULLISH MOMENTUM FOR USDCAD. all eyes on the upcoming HIGHER TIME FRAME CANDLE CLOSURES ON US DOLLAR INDEX!
You may find more details in the chart!
Thank you and Good Luck! MAKE SURE TO STAY STRICT WITH YOUR RISK MANAGEMENT!
PS: Please support with a like or comment if you find this analysis useful for your trading day.

USDCAD BUY !!Structure , Liquidity & POI has been spotted expecting price to rally to my orderblock before price pushes to the upside

USD/CAD SHORT FROM RESISTANCE
USD/CAD SIGNAL
Trade Direction: short
Entry Level: 1.395
Target Level: 1.387
Stop Loss: 1.400
RISK PROFILE
Risk level: medium
Suggested risk: 1%
Timeframe: 6h
Disclosure: I am part of Trade Nation's Influencer program and receive a monthly fee for using their TradingView charts in my analysis.
✅LIKE AND COMMENT MY IDEAS✅

USDCAD is BearishPrice was in an uptrend, however the bulls seem to be exhausted as a double top formation is printed coupled with bearish divergence. If previous higher low is broken with good volume then we can expect a bearish reversal as per Dow theory. Targets are mentioned on the chart.

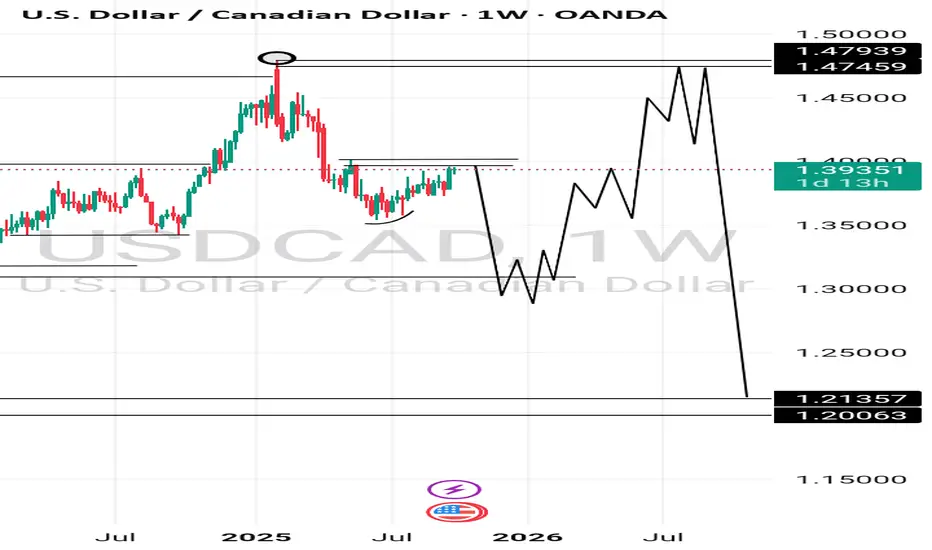
USDCADA long term Bearish Move is expected to take place @ Major resistance area@(WTF:1.39646)unti the demand zone@(WTF:1.30930) Is swept and changed to become CHOCH pattern as a sign for bears to fold hands while it is returning back to the Actual POI(WTF:1.47049) While snapping SL's of those who will be holding .
Happi Trading
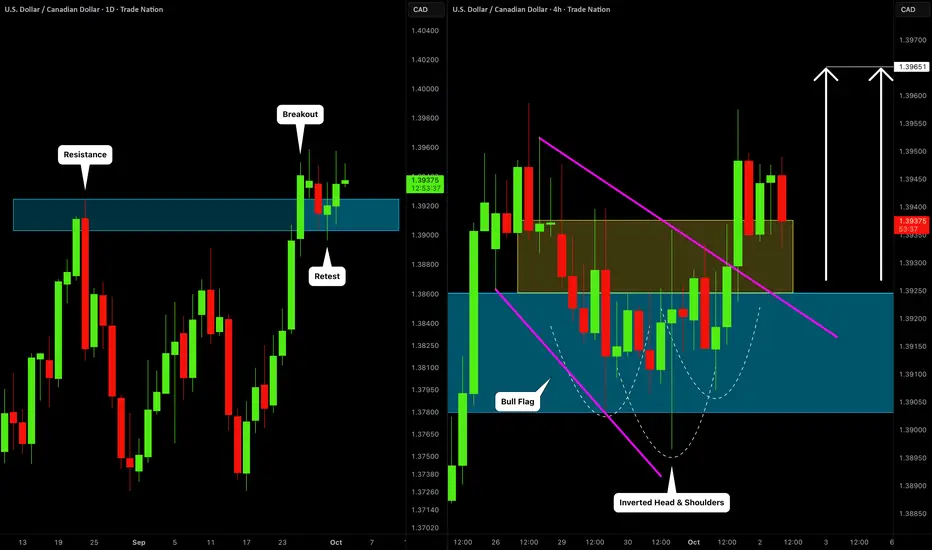
USDCAD: Correction is Over?! 🇺🇸🇨🇦
USDCAD may complete a correctional movement after a confirmed
breakout of a major daily resistance.
A bullish violation of a trend line of a bullish flag pattern and a neckline
of an inverted head & shoulders pattern provides a strong confirmation.
Next goal - 1.3965
❤️Please, support my work with like, thank you!❤️
I am part of Trade Nation's Influencer program and receive a monthly fee for using their TradingView charts in my analysis.