USDCAD H4 | Bullish momentum to extendUSD/CAD is falling towards the buy entry which is a pullback support that is slightly above the 38.2% Fibonacci retracement and could bounce from this levle to the upside.
Buy entry is at 1.3876, which is a pullback support that is slightly above the 38.2% Fibonacci retracement.
Stop loss is at 1.3830, which is a pullback support that is slightly below the 50% Fibonacci retracement.
Take profit is at 1.3948, which is a swing high resistance.
High Risk Investment Warning
Trading Forex/CFDs on margin carries a high level of risk and may not be suitable for all investors. Leverage can work against you.
Stratos Markets Limited (tradu.com ):
CFDs are complex instruments and come with a high risk of losing money rapidly due to leverage. 65% of retail investor accounts lose money when trading CFDs with this provider. You should consider whether you understand how CFDs work and whether you can afford to take the high risk of losing your money.
Stratos Europe Ltd (tradu.com ):
CFDs are complex instruments and come with a high risk of losing money rapidly due to leverage. 66% of retail investor accounts lose money when trading CFDs with this provider. You should consider whether you understand how CFDs work and whether you can afford to take the high risk of losing your money.
Stratos Global LLC (tradu.com ):
Losses can exceed deposits.
Please be advised that the information presented on TradingView is provided to Tradu (‘Company’, ‘we’) by a third-party provider (‘TFA Global Pte Ltd’). Please be reminded that you are solely responsible for the trading decisions on your account. There is a very high degree of risk involved in trading. Any information and/or content is intended entirely for research, educational and informational purposes only and does not constitute investment or consultation advice or investment strategy. The information is not tailored to the investment needs of any specific person and therefore does not involve a consideration of any of the investment objectives, financial situation or needs of any viewer that may receive it. Kindly also note that past performance is not a reliable indicator of future results. Actual results may differ materially from those anticipated in forward-looking or past performance statements. We assume no liability as to the accuracy or completeness of any of the information and/or content provided herein and the Company cannot be held responsible for any omission, mistake nor for any loss or damage including without limitation to any loss of profit which may arise from reliance on any information supplied by TFA Global Pte Ltd.
The speaker(s) is neither an employee, agent nor representative of Tradu and is therefore acting independently. The opinions given are their own, constitute general market commentary, and do not constitute the opinion or advice of Tradu or any form of personal or investment advice. Tradu neither endorses nor guarantees offerings of third-party speakers, nor is Tradu responsible for the content, veracity or opinions of third-party speakers, presenters or participants.
Trade ideas

USDCAD short to longUSDCAD has shown a new high in the market on the Daily. On lower TF, we see consolidation, expansion up before strong selling causing a break of market structure. Today, I am expecting price to sell at the midpoint or value of that consolidation (Entries are at 1.39364). Should be a nice snipe of 97 pips targeting 1.38357. After target is met, I'll enter buys at the sell's TP targeting 1.39583.

Bullish continuation?USD/CAD is falling towards the support level which is a pullback support that aligns with the 38.2% Fibonacci retracement and could bounce from this level to our take profit.
Entry: 1.3875
Why we like it:
There is a pullback support that aligns with the 38.2% Fibonacci retracement.
Stop loss: 1.3828
Why we like it:
There is a pullback support that is slightly above the 61.8% Fibonacci retracement.
Take profit: 1.3957
Why we like it:
There is a swing high resistance.
Enjoying your TradingView experience? Review us!
Please be advised that the information presented on TradingView is provided to Vantage (‘Vantage Global Limited’, ‘we’) by a third-party provider (‘Everest Fortune Group’). Please be reminded that you are solely responsible for the trading decisions on your account. There is a very high degree of risk involved in trading. Any information and/or content is intended entirely for research, educational and informational purposes only and does not constitute investment or consultation advice or investment strategy. The information is not tailored to the investment needs of any specific person and therefore does not involve a consideration of any of the investment objectives, financial situation or needs of any viewer that may receive it. Kindly also note that past performance is not a reliable indicator of future results. Actual results may differ materially from those anticipated in forward-looking or past performance statements. We assume no liability as to the accuracy or completeness of any of the information and/or content provided herein and the Company cannot be held responsible for any omission, mistake nor for any loss or damage including without limitation to any loss of profit which may arise from reliance on any information supplied by Everest Fortune Group.

USDCAD 1H BearishBreak of trendline
Bearish engulfing candles
Liquidity sweep Aug 22, new high
RSI = 44
Bearish Divergence on RSI
R/R 3:1
Multiple confluences
Beware buyers around 1.39000

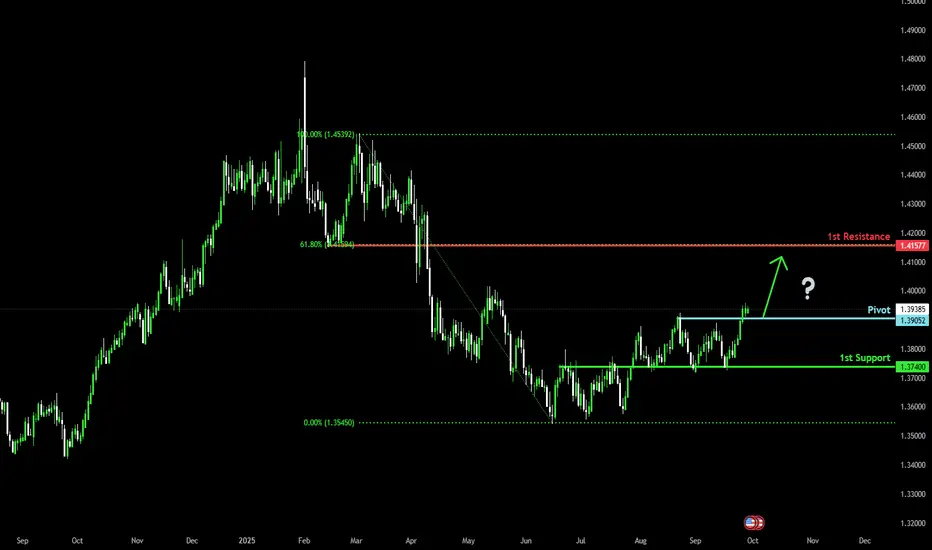
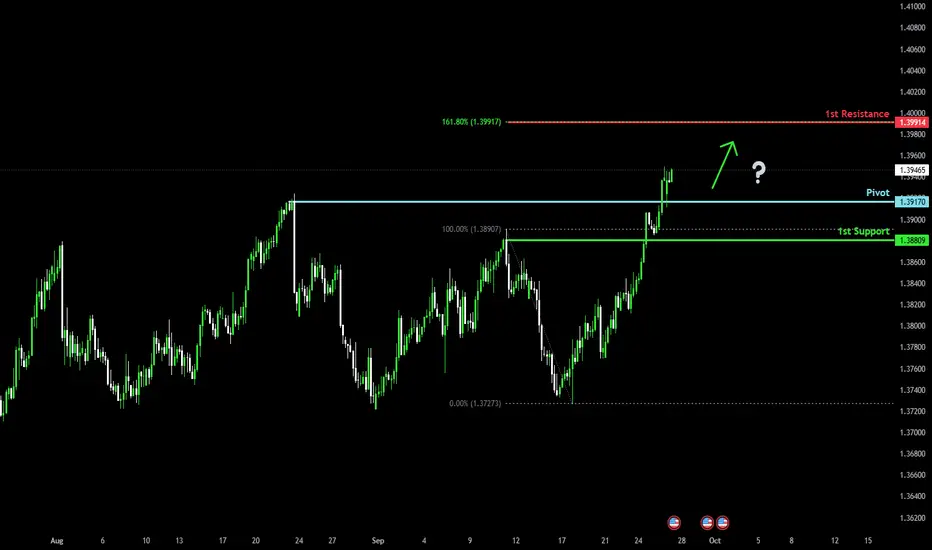
Bullish momentum to extend?The Loonie (USD/CAD) is reacting off the pivot which is a pullback support and could rise to the 1st resistance which aligns with the 61.8% Fibonacci retracement.
Pivot: 1.3905
1st Support: 1.3740
1st Resistance: 1.4157
Disclaimer:
The above opinions given constitute general market commentary, and do not constitute the opinion or advice of IC Markets or any form of personal or investment advice.
Any opinions, news, research, analyses, prices, other information, or links to third-party sites contained on this website are provided on an "as-is" basis, are intended only to be informative, is not an advice nor a recommendation, nor research, or a record of our trading prices, or an offer of, or solicitation for a transaction in any financial instrument and thus should not be treated as such. The information provided does not involve any specific investment objectives, financial situation and needs of any specific person who may receive it. Please be aware, that past performance is not a reliable indicator of future performance and/or results. Past Performance or Forward-looking scenarios based upon the reasonable beliefs of the third-party provider are not a guarantee of future performance. Actual results may differ materially from those anticipated in forward-looking or past performance statements. IC Markets makes no representation or warranty and assumes no liability as to the accuracy or completeness of the information provided, nor any loss arising from any investment based on a recommendation, forecast or any information supplied by any third-party.
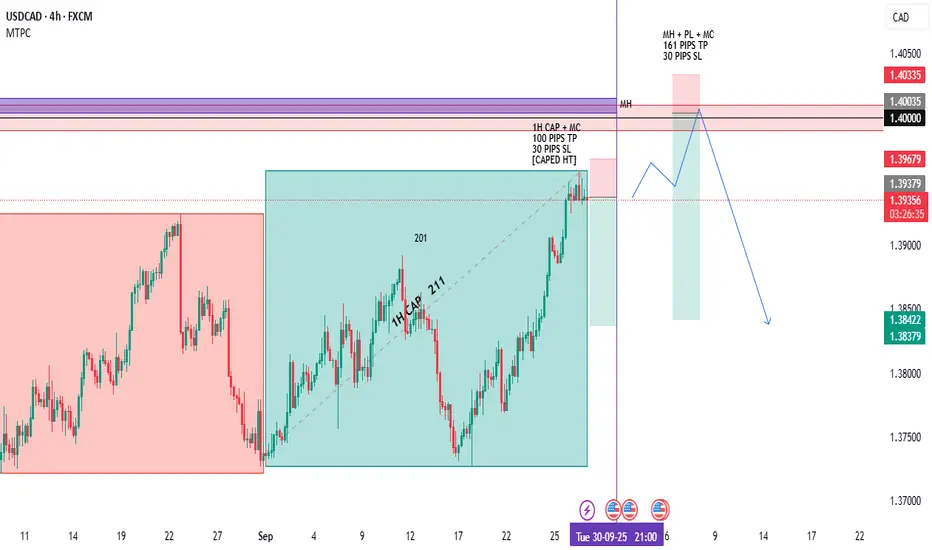
SWING SHORTING OPPORTUNITYLast week market have been trending continuously without making any significant pullback, also the market have already moved 1H CAP avg movement, preparing for a pull back , last candles also shows signs of bullish exhaustion. but there are also chances market can move towards 1.4 PL upto the previous MH before making the Pullback Swing.
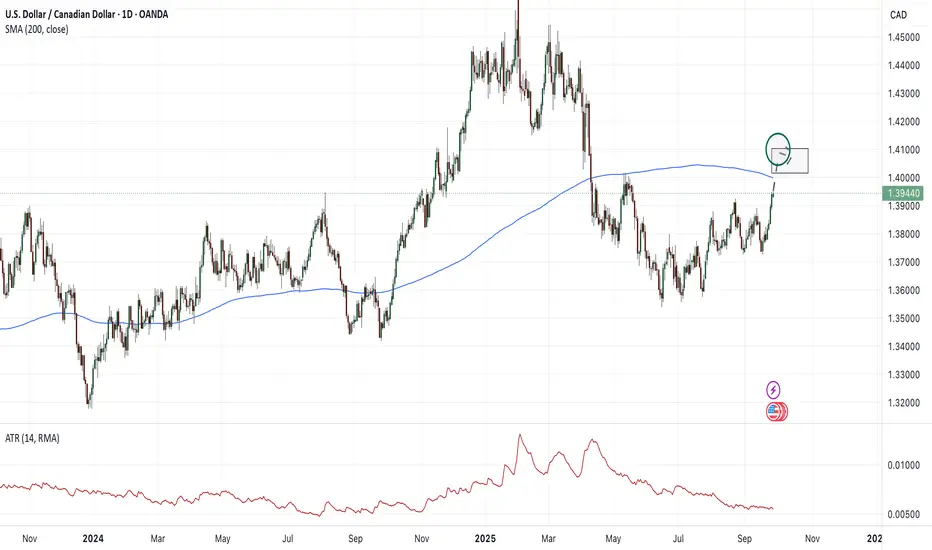
Canadian dollar under pressureThe Canadian dollar is weakening against the greenback in a week of a bearish rally, as the US dollar gains strength in anticipation of the most volatile month around the corner, and weakening “Dovish FED” narrative. The technical picture is particularly interesting here, as it finished the week near the 200-day moving average: the long-term reference, which might become a trigger for more selling pressure for CAD against the USD.
Given the strong momentum of USDCAD, we can expect it to expand this week reaching the target of 1.4050, and potentially higher.
Don't forget - this is just the idea, always do your own research and never forget to manage your risk!
29-09-2025 _ Short Term Bullish Idea _USDCAD H41- Impulsive move to the upside.
2- No Divergence against.
3- One can expect pullback.
4- Followed by further continuation to the Upside.

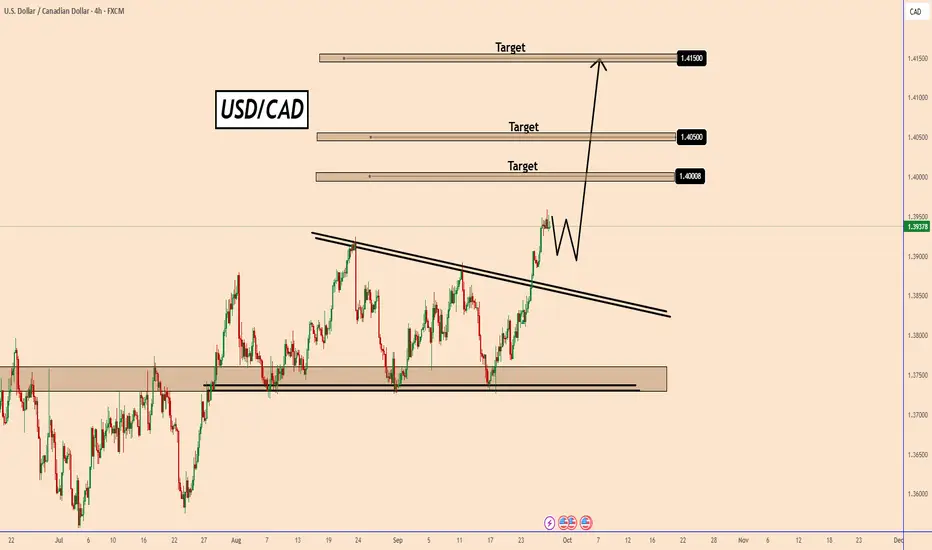
USDCAD: Bullish Momentum in PlayUSDCAD: Bullish Momentum in Play
Price broke out above the descending trendline, showing bullish strength.
After the breakout, price may retest the broken resistance zone before moving higher.
After the better-than-expected data on Thursday and Friday from the U.S the odds are that USDCAD may rise further over the coming week.
The only threat of the US dollar is Trump and the strange game he is playing with his tariffs.
Let's hope he will not make a bigger mess
Key Targets:
1.4000
1.4050
1.4150
As long as price stays above the breakout zone, the bullish scenario remains valid.
You may find more details in the chart!
Thank you and Good Luck!
❤️PS: Please support with a like or comment if you find this analysis useful for your trading day❤️
Usdcad sell on a pullback,I like the fact that the usd has stretched up a d broke a structure area which means for me there will be a possible pullback here from 1.39400 to 1.38400 areas.

USDCAD Technical & Order Flow AnalysisOur analysis is based on a multi-timeframe top-down approach and fundamental analysis.
Based on our assessment, the price is expected to return to the monthly level.
DISCLAIMER: This analysis may change at any time without notice and is solely intended to assist traders in making independent investment decisions. Please note that this is a prediction, and I have no obligation to act on it, nor should you.
Please support our analysis with a boost or comment!
USDCAD bullish idea1 Structure
*The price has previously made higher highs and higher lows, indicating a broader uptrend.
*The recent pullback could be a healthy correction before continuation.
Support Zone
*The price bounced near the 0.5 Fibonacci retracement level and a clear horizontal support zone (gray rectangle).
*This confluence of support strengthens the case for a bullish move.
⚠️ Caution
**While the setup is technically bullish, price is near a key decision point. If it breaks below the support, it invalidates the bullish thesis.
**Watch for confirmation candles (bullish engulfing, strong rejection wicks) before entry.
***Also, be mindful of the upcoming economic events (news icons are visible), which could cause volatility

USDCAD: More Growth Expected Next Week 🇺🇸🇨🇦
USDCAD will likely grow more next week, retesting a recently
broken daily horizontal resistance, that turned into a support after a breakout.
The next strong resistance is 1.397 - it will most likely be the next goal for the buyers.
❤️Please, support my work with like, thank you!❤️
I am part of Trade Nation's Influencer program and receive a monthly fee for using their TradingView charts in my analysis.

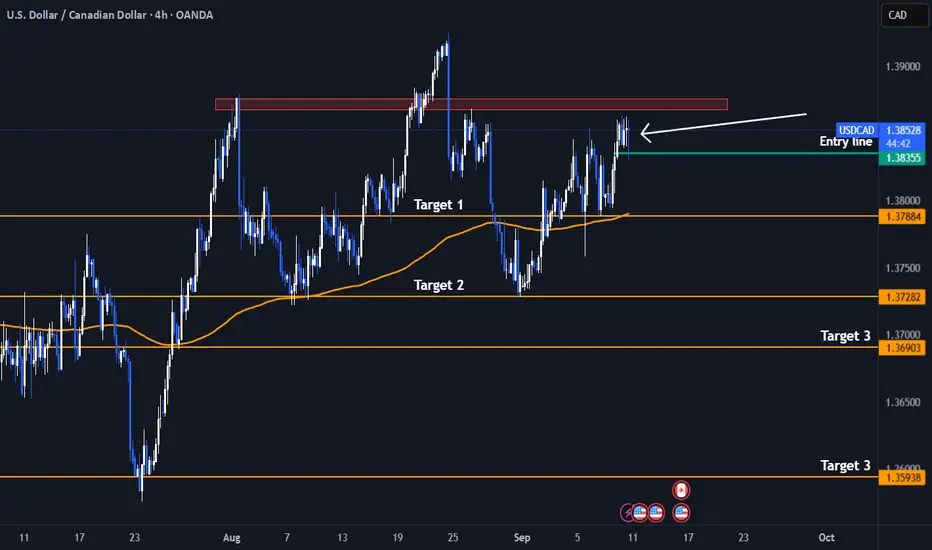
Short! Short! USDCAD - Double Head and Shoulder PatternI have identified a clear head and shoulders pattern forming within a larger head and shoulders structure on the daily timeframe for USD/CAD, indicating a potential bearish reversal.
From a fundamental perspective, several key factors are contributing to the current weakness in the Canadian dollar against the US dollar:
Canada's labor market showed significant weakness in August 2025, with a notable loss of 65.5 thousand jobs and a rise in unemployment to 7.1%, the highest in years. This has increased market expectations for monetary easing from the Bank of Canada (BoC).
Although core inflation remains above target, the weak jobs data is pushing the BoC towards potential rate cuts or a more accommodative policy stance, which weighs on the Canadian dollar.
The market is currently pricing in a very high chance (around 98%) of an additional rate cut by the BoC in September, following previous reductions to 2.75%. This dovish stance contrasts with the Federal Reserve’s more cautious or hawkish approach, creating a wider interest rate differential that supports US dollar strength.
Additionally, declining oil prices, a major export for Canada, are exerting further downward pressure on the CAD.
While recent US economic data has been mixed, the Fed is generally seen as less dovish than the BoC, sustaining demand for the USD.
Trade tensions and geopolitical risks between the US and Canada add to concerns over Canada’s growth outlook, contributing to CAD depreciation risk.
Trade Tip
A strong close below the Entry line will be a perfect entry /4hr TF
Stoploss : Above the Left Shoulder (Red Rectangle)
In summary, the combination of a weakening Canadian economy, dovish BoC bias, lower oil prices, and interest rate divergence between the US and Canada all support a bearish outlook for USD/CAD, which aligns well with the bearish head and shoulders pattern I have spotted on the chart.
Not an Investment Advise
USDCAD Bulls Building Momentum as Loonie WeakensUSDCAD has bounced strongly from recent lows, with buyers regaining control and pushing the pair toward key resistance levels. The move reflects a combination of weaker Canadian fundamentals and resilient USD demand. With oil prices under pressure and the Bank of Canada leaning dovish, the stage looks set for USD strength to continue pressing higher against the CAD.
Current Bias
Bullish – price structure favors further upside toward resistance.
Key Fundamental Drivers
Federal Reserve: While the Fed is moving toward gradual easing, safe-haven demand and inflation risks from tariffs keep the dollar supported.
Bank of Canada: Markets price a high probability of another BoC rate cut, reflecting weak labor market data and slowing growth.
Oil Prices: Crude remains soft near the low $60s, weighing directly on the CAD as energy exports weaken.
Macro Context
Interest Rates: The Fed is cautious but still less dovish than the BoC, creating policy divergence that favors USD.
Economic Growth: Canada’s GDP contracted in Q2, and labor data confirms rising unemployment; meanwhile, the U.S. economy, though slowing, is relatively stronger.
Commodity Flows: Oil remains CAD’s key driver, and falling prices keep downside pressure on the currency.
Geopolitics: U.S. tariffs on Canadian auto parts and broader trade uncertainty add extra headwinds for Canada.
Primary Risk to the Trend
A sharp rebound in oil prices or surprisingly hawkish comments from the BoC could reverse the bullish momentum.
Most Critical Upcoming News/Event
Canada GDP and employment reports
U.S. PCE inflation data
BoC policy meeting outlook
Leader/Lagger Dynamics
USDCAD often acts as a lagger to oil moves, with crude leading sentiment on CAD. However, in times of strong USD demand, USDCAD can act as a leader for CAD crosses like CADJPY and AUDCAD.
Key Levels
Support Levels: 1.3738, 1.3668
Resistance Levels: 1.3826, 1.3891
Stop Loss (SL): 1.3668 (below recent swing support)
Take Profit (TP): 1.3826 (first target), extension to 1.3891
Summary: Bias and Watchpoints
USDCAD carries a bullish bias, supported by weaker Canadian data, softer oil prices, and dovish BoC expectations. A stop loss below 1.3668 protects against downside risks, while targets at 1.3826 and 1.3891 keep focus on upside continuation. Watch Canadian GDP and employment data closely, alongside U.S. PCE inflation, as key catalysts. The pair remains reactive to oil prices but could act as a leader for CAD crosses if USD strength dominates.

USDCAD LongWe are in an uptrend we are waiting for the retest of the fair value gap that is in line with a key area on the Fibonacci level.

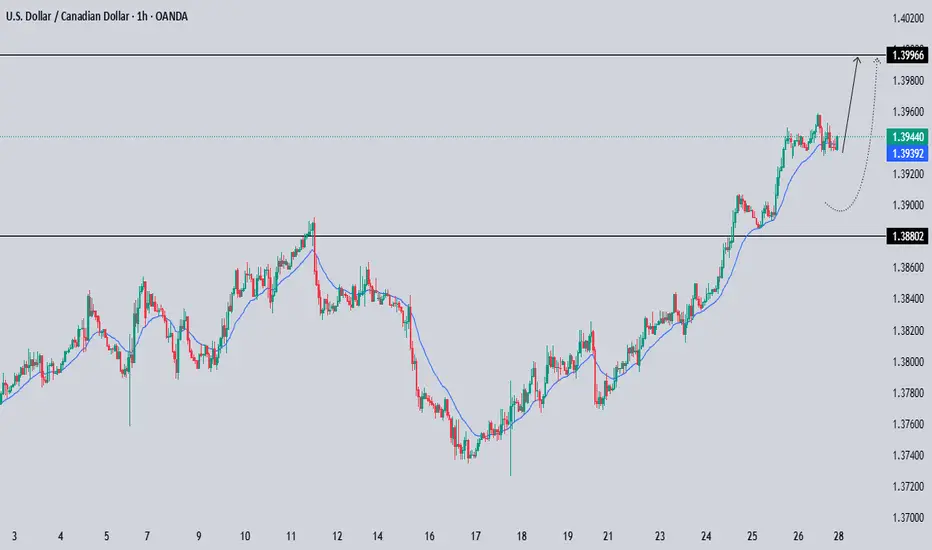
Bullish momentum to extend?The Loonie (USD/CAD) has bounced off the pivot and could rise to the 1st resistance.
Pivot: 1.3917
1st Support: 1.3880
1st Resistance: 1.3991
Disclaimer:
The above opinions given constitute general market commentary, and do not constitute the opinion or advice of IC Markets or any form of personal or investment advice.
Any opinions, news, research, analyses, prices, other information, or links to third-party sites contained on this website are provided on an "as-is" basis, are intended only to be informative, is not an advice nor a recommendation, nor research, or a record of our trading prices, or an offer of, or solicitation for a transaction in any financial instrument and thus should not be treated as such. The information provided does not involve any specific investment objectives, financial situation and needs of any specific person who may receive it. Please be aware, that past performance is not a reliable indicator of future performance and/or results. Past Performance or Forward-looking scenarios based upon the reasonable beliefs of the third-party provider are not a guarantee of future performance. Actual results may differ materially from those anticipated in forward-looking or past performance statements. IC Markets makes no representation or warranty and assumes no liability as to the accuracy or completeness of the information provided, nor any loss arising from any investment based on a recommendation, forecast or any information supplied by any third-party.
USD/CAD on the 4H timeframe.USD/CAD on the 4H timeframe.
From the analysis shown:
Price has broken structure (BOS) and is holding above the resistance zone (around 1.3900 – 1.3920).
The chart marks a projected Target Point around 1.4100 – 1.4110.
This means the next upside move (if the breakout holds) could push toward that zone.
📌 Target Range: 1.4090 – 1.4110

USDCAD Shorti diagnosed on 4H and Daily time. now it s going on retracements peak are. its time to open short positions. One short is for daily entry , one entry is for swing trade till 1.21000.
RR is looks good. 1:22.
always move your be till break dow theory.

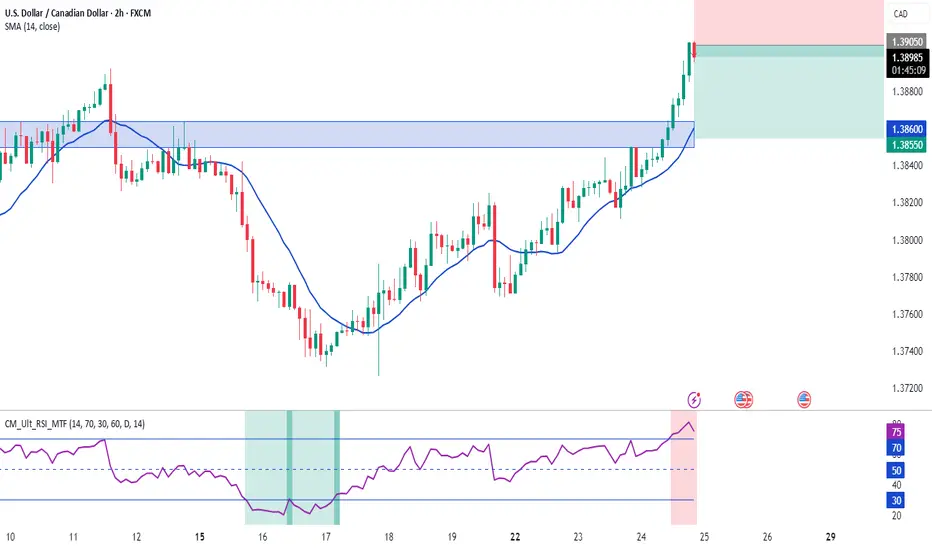
USDCAD Short
Entry Price: 1.3886.
Stop-Loss (SL): ~1.3921 (above recent resistance).
Take-Profit (TP): ~1.3835 (below the entry).
This creates a risk-to-reward ratio of about 1:2 (you risk ~35 pips to potentially gain ~50 pips).
Price has made a strong push upward, approaching a resistance zone near 1.3890–1.3920, where it previously reversed.
The trader is betting on a rejection from resistance for a move down.
This is a short setup on USDCAD, expecting rejection from resistance around 1.3890–1.3920 with an overbought RSI confirmation. Risk is limited with a stop above resistance, aiming for profit down near 1.3835.
Fundamentally, the asset is currently overvalued against the Dollar index and Gold.


Sell⬇️ Sell Entry: 1.39050
⏹️ Stop Loss: 1.39400
*️⃣ Take Profit: 1.38550
🔠 Downward corrective movement to the nearest local support level.
USDCAD - Parabolic ExhaustionPossibility of reversal/s back to test support.
Await confirmation of closes below the trend-lines.
