USDCAD near breakdown zone; Bearish pressure buildsUSDCAD near breakdown zone; Bearish pressure builds
On Sept. 11, USDCAD tested resistance at 1.3891–1.3904 but failed to break higher, reversing lower after U.S. jobless claims and CPI data. The pair now hovers near 1.38350–1.3840, supported by the 100-hour MA at 1.3859. This zone is key: holding above favors dip-buyers, while a break below 1.3812 would tilt bias bearish.
By Sept. 12, the dollar edged higher after the prior day’s drop, as U.S. jobless claims jumped to a four-year high while inflation rose modestly. Markets remain focused on a Fed cut next week, with futures fully pricing a 25-bps move on Sept. 17 and reduced odds of a 50-bps cut.
Trade ideas

USDCAD: Pullback Trade From Support 🇺🇸🇨🇦
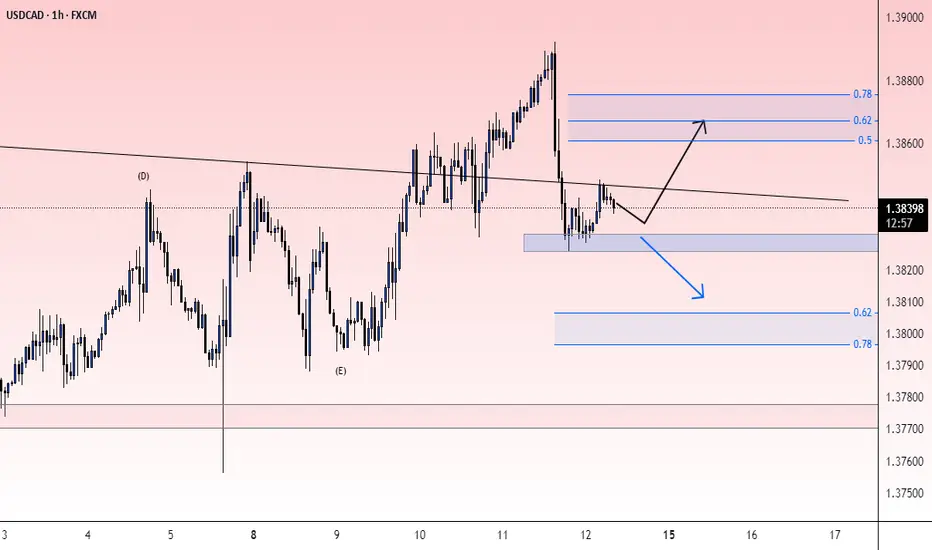
USDCAD is going to bounce from a strong intraday horizontal support.
My confirmation signal is a formation of a double bottom pattern
on that and a breakout of its horizontal neckline.
I expect move up to 1.3855
❤️Please, support my work with like, thank you!❤️
I am part of Trade Nation's Influencer program and receive a monthly fee for using their TradingView charts in my analysis.

check the trendIf the price changes direction within the current support range, we are expected to see the beginning of the upward trend to the resistance levels. Otherwise, the continuation of the downward trend to the next support levels is possible.
USDCAD - LONG - Conviction: Medium | Chronex ( London • Sep 10 )Hello Guys!
🎯 90 % mechanical | Just your entry model
No trend-line art, no gut calls. Just a repeatable institutional process delivered every day at London Open
Context:
🧠 What Chronex does (bird’s-eye view)
- Scans all 28 major FX pairs every session.
- Ranks each currency’s relative strength / weakness from multi-TF data.
- Pairs strongest vs. weakest to create a tight outlook list.
- Adds built-in risk filters → posts one clean table: *Direction · Conviction · Entry zone · SL*.
📍 Today’s Playbook:
Risks
1. Do we have economic high impact news release?
2. Any higher-timeframe counter-trend zones?
3. Has better zone above/below?
Verdict:
💬 Drop questions, challenge the outlook, or share your own setups below!

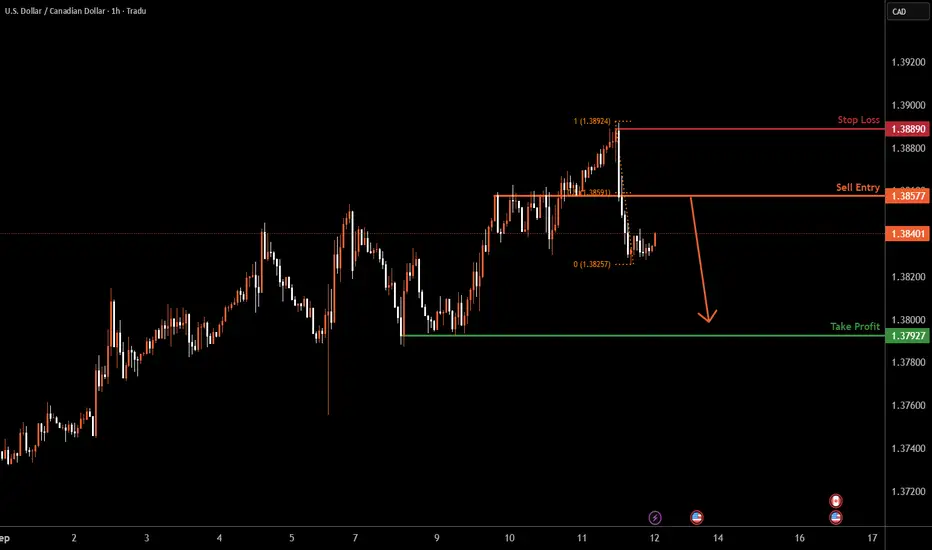
USDCAD H1 | 50% Fibonacci resistance signals bearish reversalLoonie (USD/CAD) is rising towards the sell entry, which is a pullback resistance that aligns with the 50% Fibonacci retracement and could reverse from this level to the downside.
Sell entry is at 1.3857, which is a pullback resistance that aligns with the 50% retracement.
Stop loss is at 1.3792, which is a swing high resistance.
Take profit is at 1.3792, which is a pullback support.
High Risk Investment Warning
Trading Forex/CFDs on margin carries a high level of risk and may not be suitable for all investors. Leverage can work against you.
Stratos Markets Limited (tradu.com ):
CFDs are complex instruments and come with a high risk of losing money rapidly due to leverage. 65% of retail investor accounts lose money when trading CFDs with this provider. You should consider whether you understand how CFDs work and whether you can afford to take the high risk of losing your money.
Stratos Europe Ltd (tradu.com ):
CFDs are complex instruments and come with a high risk of losing money rapidly due to leverage. 66% of retail investor accounts lose money when trading CFDs with this provider. You should consider whether you understand how CFDs work and whether you can afford to take the high risk of losing your money.
Stratos Global LLC (tradu.com ):
Losses can exceed deposits.
Please be advised that the information presented on TradingView is provided to Tradu (‘Company’, ‘we’) by a third-party provider (‘TFA Global Pte Ltd’). Please be reminded that you are solely responsible for the trading decisions on your account. There is a very high degree of risk involved in trading. Any information and/or content is intended entirely for research, educational and informational purposes only and does not constitute investment or consultation advice or investment strategy. The information is not tailored to the investment needs of any specific person and therefore does not involve a consideration of any of the investment objectives, financial situation or needs of any viewer that may receive it. Kindly also note that past performance is not a reliable indicator of future results. Actual results may differ materially from those anticipated in forward-looking or past performance statements. We assume no liability as to the accuracy or completeness of any of the information and/or content provided herein and the Company cannot be held responsible for any omission, mistake nor for any loss or damage including without limitation to any loss of profit which may arise from reliance on any information supplied by TFA Global Pte Ltd.
The speaker(s) is neither an employee, agent nor representative of Tradu and is therefore acting independently. The opinions given are their own, constitute general market commentary, and do not constitute the opinion or advice of Tradu or any form of personal or investment advice. Tradu neither endorses nor guarantees offerings of third-party speakers, nor is Tradu responsible for the content, veracity or opinions of third-party speakers, presenters or participants.
Potential bearish drop?USD/CAD is reacting off the resistance level which is a pullback resistance that aligns with the 61.8% Fibonacci retracement and could drop from this level to our take profit.
Entry: 1.3857
Why we like it:
There is a pullback resistance level that lines up with the 61.8% Fibonacci retracement.
Stop loss: 1.3916
Why we like it:
There is a swing high resistance level.
Take profit: 1.3771
Why we like it:
There is a pullback support that aligns with the 78.6% Fibonacci retracement.
Enjoying your TradingView experience? Review us!
Please be advised that the information presented on TradingView is provided to Vantage (‘Vantage Global Limited’, ‘we’) by a third-party provider (‘Everest Fortune Group’). Please be reminded that you are solely responsible for the trading decisions on your account. There is a very high degree of risk involved in trading. Any information and/or content is intended entirely for research, educational and informational purposes only and does not constitute investment or consultation advice or investment strategy. The information is not tailored to the investment needs of any specific person and therefore does not involve a consideration of any of the investment objectives, financial situation or needs of any viewer that may receive it. Kindly also note that past performance is not a reliable indicator of future results. Actual results may differ materially from those anticipated in forward-looking or past performance statements. We assume no liability as to the accuracy or completeness of any of the information and/or content provided herein and the Company cannot be held responsible for any omission, mistake nor for any loss or damage including without limitation to any loss of profit which may arise from reliance on any information supplied by Everest Fortune Group.
USDCADThe trend in the USD/CAD currency pair is bullish. In the range of 1.38356 to 1.38113, after confirmation, this area could provide a good buying opportunity. ✅

Market Watch – USD/CAD Pullback Setup?USD/CAD is currently in a steady uptrend and is making a possible pullback into a well-defined support/resistance zone.
We’ll keep an eye on this one for confirmation:
✅ Engulfing candle trigger
✅ Strong volume
✅ Momentum hooking in alignment
⚔️ War Room Lesson: An uptrend plus a clean pullback into structure often sets the stage for high-quality trades — but only if the signals line up. Until then, patience.

(USDCAD, 1-hour timeframe).(USDCAD, 1-hour timeframe), I see that you have drawn a bullish setup with:
Price breaking above a resistance zone (yellow box around 1.3860 – 1.3870).
An ascending trendline supporting the move.
Ichimoku cloud showing bullish momentum.
My chart already marks a "Target Point" around 1.3940.
📍 Target: Based on my analysis, the next resistance level is around 1.3940 – 1.3950.
That’s my immediate upside target if the breakout holds.
⚠ Watch for retests of 1.3860 support (former resistance) before continuation.

USDCAD sell !It is time to sell the USDCAD pair now. Rejection from a strong resistance area and more over to that new supply zone established. Do not risk more than 1% per the trade. 1:2.5 risk rewards is expecting from this trade. Good Luck ..!


USDCAD SHORT 1HHead & Shoulder and bearish divergence spotted.
expecting it will break the neckline and start bearish trend.

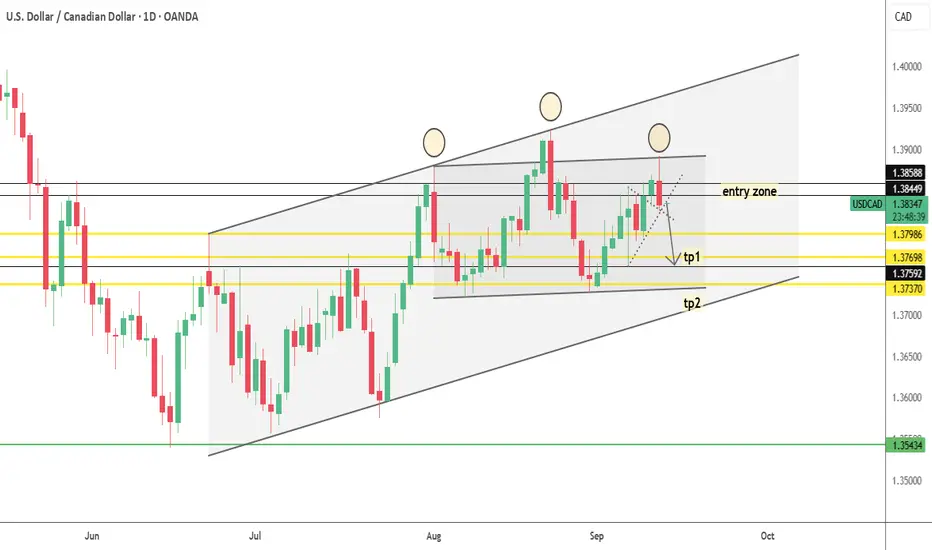
Bullish rise?The Loonie (USD/CAD) could fall to the pivot and bounce to the 1st resistance, which acts as a swing high resistance.
Pivot: 1.3828
1st Support: 1.3791
1st Resistance: 1.3918
Disclaimer:
The above opinions given constitute general market commentary, and do not constitute the opinion or advice of IC Markets or any form of personal or investment advice.
Any opinions, news, research, analyses, prices, other information, or links to third-party sites contained on this website are provided on an "as-is" basis, are intended only to be informative, is not an advice nor a recommendation, nor research, or a record of our trading prices, or an offer of, or solicitation for a transaction in any financial instrument and thus should not be treated as such. The information provided does not involve any specific investment objectives, financial situation and needs of any specific person who may receive it. Please be aware, that past performance is not a reliable indicator of future performance and/or results. Past Performance or Forward-looking scenarios based upon the reasonable beliefs of the third-party provider are not a guarantee of future performance. Actual results may differ materially from those anticipated in forward-looking or past performance statements. IC Markets makes no representation or warranty and assumes no liability as to the accuracy or completeness of the information provided, nor any loss arising from any investment based on a recommendation, forecast or any information supplied by any third-party.

USDCAD: Bullish For The Near Term?Welcome back to the Weekly Forex Forecast for the week of Sept 8 - 12th.
In this video, we will analyze the following FX market: USDCAD
Last Week I was looking for weakness in the USDCAD. It traded through the bearish FVG on the Daily, moving higher as the CAD turned out to be even weaker last week.
Look for this to continue for the upcoming week, as there is internal range liquidity (IRL) drawing price higher for a short term gains.
Enjoy!
May profits be upon you.
Leave any questions or comments in the comment section.
I appreciate any feedback from my viewers!
Like and/or subscribe if you want more accurate analysis.
Thank you so much!
Disclaimer:
I do not provide personal investment advice and I am not a qualified licensed investment advisor.
All information found here, including any ideas, opinions, views, predictions, forecasts, commentaries, suggestions, expressed or implied herein, are for informational, entertainment or educational purposes only and should not be construed as personal investment advice. While the information provided is believed to be accurate, it may include errors or inaccuracies.
I will not and cannot be held liable for any actions you take as a result of anything you read here.
Conduct your own due diligence, or consult a licensed financial advisor or broker before making any and all investment decisions. Any investments, trades, speculations, or decisions made on the basis of any information found on this channel, expressed or implied herein, are committed at your own risk, financial or otherwise.

USDCAD bullish support at 1.3790The USDCAD remains in a bullish trend, with recent price action showing signs of a corrective pullback within the broader uptrend.
Support Zone: 1.3790 – a key level from previous consolidation. Price is currently testing or approaching this level.
A bullish rebound from 1.3790 would confirm ongoing upside momentum, with potential targets at:
1.3930 – initial resistance
1.3960 – psychological and structural level
1.4000 – extended resistance on the longer-term chart
Bearish Scenario:
A confirmed break and daily close below 1.3790 would weaken the bullish outlook and suggest deeper downside risk toward:
1.3755 – minor support
1.3730 – stronger support and potential demand zone
Outlook:
Bullish bias remains intact while the USDCAD holds above 1.3790. A sustained break below this level could shift momentum to the downside in the short term.
This communication is for informational purposes only and should not be viewed as any form of recommendation as to a particular course of action or as investment advice. It is not intended as an offer or solicitation for the purchase or sale of any financial instrument or as an official confirmation of any transaction. Opinions, estimates and assumptions expressed herein are made as of the date of this communication and are subject to change without notice. This communication has been prepared based upon information, including market prices, data and other information, believed to be reliable; however, Trade Nation does not warrant its completeness or accuracy. All market prices and market data contained in or attached to this communication are indicative and subject to change without notice.

UsdCadUSDCAD is showing weakness after testing a key resistance zone. Sellers are stepping in as the pair struggles to break higher, signalling potential downside momentum. If price continues to reject this level, we may see further declines toward the next support areas.

USDCAD SELL OPPORTUNITYHello traders, volatility slowly coming back and we already are benefiting from interesting trade opportunities. New week means new opportunities Here's my point of view about CMCMARKETS:USDCAD
TECHNICALLY:
AS explained before the red area around 1.38500 was a make or break area. I was looking to see some action around that H4-DAILY KEY LEVEL SELL ZONE. Last week price totally rejected the zone and this week we are clearly seeing rejections.
As long as we stay BELOW 1.38500 we can consider to look for SELL entries at pullback but only if fundamentals, confluences & confirmations align. This setup requires for US DOLLAR / DXY
DXY TO BE WEAK. or CAD strong (which can be the case due to fundamentals). Otherwise, the area will be completely invalidated and we will have a deeper pullback/ retracement.
You may find more details in the chart!
Thank you and Good Luck! MAKE SURE TO STAY STRICT WITH YOUR RISK MANAGEMENT!
PS: Please support with a like or comment if you find this analysis useful for your trading day.


【Canadian Dollar Analysis】 USD/CAD is currently oscillating wi【Canadian Dollar Analysis】
USD/CAD is currently oscillating within the 1.3450–1.3600 range, reflecting mixed fundamental drivers. **Supporting factors for CAD**: Rising crude oil prices (WTI back above $80) bolster its commodity currency appeal, while Canada’s stronger-than-expected January CPI may delay BoC rate cuts. **Headwinds**: Robust US economic data continues to strengthen the USD, coupled with sluggish domestic growth (Q4 GDP at just 1%). Technically, a break above 1.3620 is needed to confirm further upside, with key support at 1.3400. Monitor oil price dynamics and comparative economic data between the US and Canada. Trading strategy: range trading with breakout follow-up.

USDCAD📈 USDCAD – Buy Setup (4H TF) Based on CWT
The Alligator indicator (Jaw, Teeth, and Lips) is showing alignment in bullish direction:

uptrend The price is expected to cross the resistance range and after consolidating above the resistance range, the beginning of the upward trend is likely.

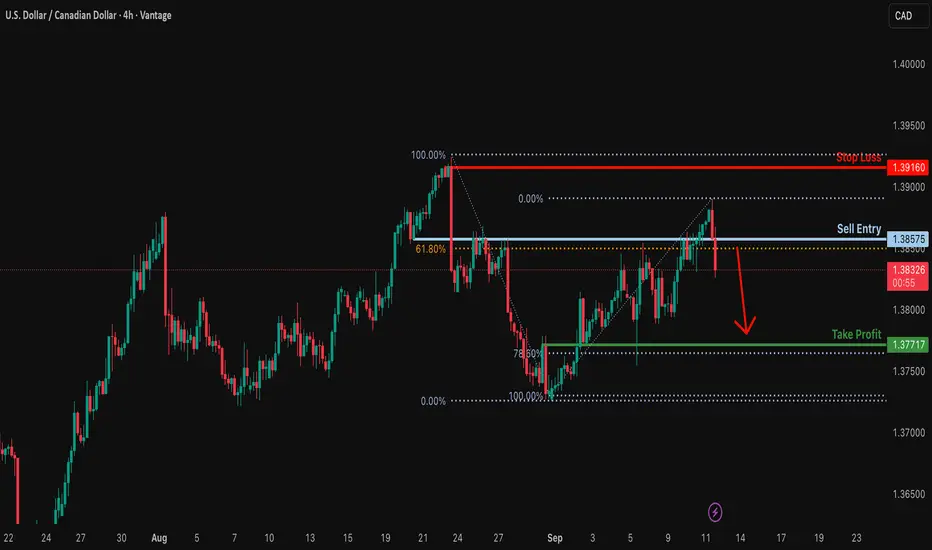
USDCAD H4 | Bearish reversal off overlap resistanceUSD/CAD is reacting off the sell entry which is an overlap resistance that lines up with the 61.8% Fibonacci retracement and could reverse from this level to the take profit.
Sell entry is at 1.3856, which is an overlap resistance that lines up with the 61.8% Fibonacci retracement.
Stop loss is at 1.3918, which is a swing high resistance that lines up with the 100% Fibonacci projection.
Take profit is at 1.3791, which is a pullback support that aligns with the 50% Fibonacci retracement.
High Risk Investment Warning
Trading Forex/CFDs on margin carries a high level of risk and may not be suitable for all investors. Leverage can work against you.
Stratos Markets Limited (tradu.com ):
CFDs are complex instruments and come with a high risk of losing money rapidly due to leverage. 65% of retail investor accounts lose money when trading CFDs with this provider. You should consider whether you understand how CFDs work and whether you can afford to take the high risk of losing your money.
Stratos Europe Ltd (tradu.com ):
CFDs are complex instruments and come with a high risk of losing money rapidly due to leverage. 66% of retail investor accounts lose money when trading CFDs with this provider. You should consider whether you understand how CFDs work and whether you can afford to take the high risk of losing your money.
Stratos Global LLC (tradu.com ):
Losses can exceed deposits.
Please be advised that the information presented on TradingView is provided to Tradu (‘Company’, ‘we’) by a third-party provider (‘TFA Global Pte Ltd’). Please be reminded that you are solely responsible for the trading decisions on your account. There is a very high degree of risk involved in trading. Any information and/or content is intended entirely for research, educational and informational purposes only and does not constitute investment or consultation advice or investment strategy. The information is not tailored to the investment needs of any specific person and therefore does not involve a consideration of any of the investment objectives, financial situation or needs of any viewer that may receive it. Kindly also note that past performance is not a reliable indicator of future results. Actual results may differ materially from those anticipated in forward-looking or past performance statements. We assume no liability as to the accuracy or completeness of any of the information and/or content provided herein and the Company cannot be held responsible for any omission, mistake nor for any loss or damage including without limitation to any loss of profit which may arise from reliance on any information supplied by TFA Global Pte Ltd.
The speaker(s) is neither an employee, agent nor representative of Tradu and is therefore acting independently. The opinions given are their own, constitute general market commentary, and do not constitute the opinion or advice of Tradu or any form of personal or investment advice. Tradu neither endorses nor guarantees offerings of third-party speakers, nor is Tradu responsible for the content, veracity or opinions of third-party speakers, presenters or participants.
