USD/CAD – Sideways Accumulation, Preparing for a Mild UpsideThe August Nonfarm Payrolls report came in at only 22K, far below expectations of 75K and the previous 79K, causing the USD to weaken. However, Canadian labor data was also underwhelming, leaving the CAD too weak to drag the pair significantly lower. As a result, USD/CAD has maintained balance and is moving within a narrow range.
On the H4 chart, the price is fluctuating around 1.38280, closely tracking the long-term descending trendline. The EMA34 and EMA89 are moving sideways, reflecting an accumulation phase. If support at 1.3787 holds, USD/CAD could rebound and push up towards 1.3833 before confirming the next trend direction.
Trade ideas

usd/cad shows uptrendOverall, within the higher time frames, USDCAD is still at its lowest and has shown considerable potential. Currently, it has shown an uptrend, and it has been respecting the support lines within the hourly time frames. As of now, on the 1-hour time frame, it has become bearish. In my opinion, I would wait to see if it touches my yellow support line, or perhaps it could touch my blue support line; otherwise, we should wait until we see a bullish candle after this bearish engulfing candle.

USDCAD 4HTrading Outlook for the Upcoming Week
In this series of analyses, we review trading perspectives and short-term outlooks.
As can be seen, in each analysis there is a key support/resistance zone near the current price of the asset. The market’s reaction to—or breakout from—this zone will determine the next price movement toward the specified levels.
Important Note: The purpose of these trading outlooks is to highlight key levels ahead of the price and the market’s potential reactions to them. The analyses provided are by no means trading signals!

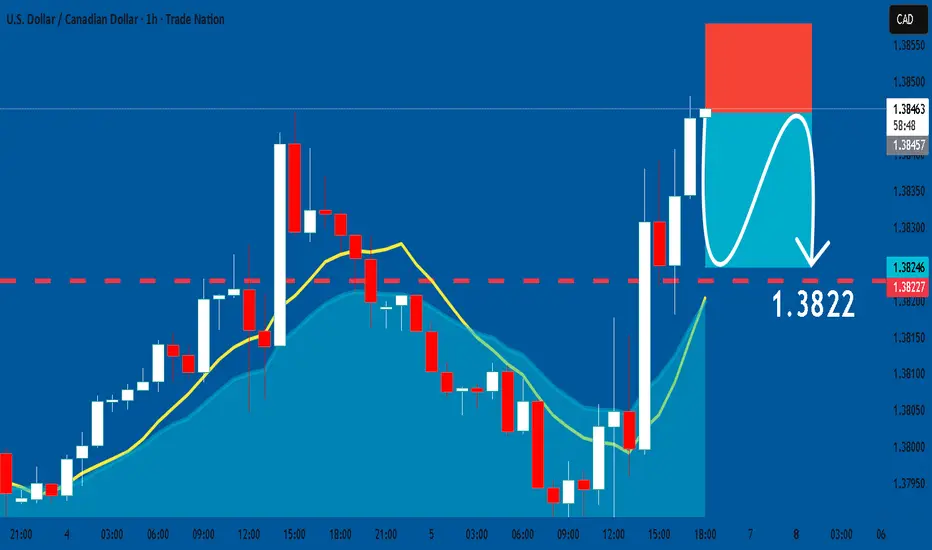
USDCAD: Short Trading Opportunity
USDCAD
- Classic bearish formation
- Our team expects fall
SUGGESTED TRADE:
Swing Trade
Sell USDCAD
Entry Level - 1.3845
Sl - 1.3857
Tp - 1.3822
Our Risk - 1%
Start protection of your profits from lower levels
Disclosure: I am part of Trade Nation's Influencer program and receive a monthly fee for using their TradingView charts in my analysis.
❤️ Please, support our work with like & comment! ❤️
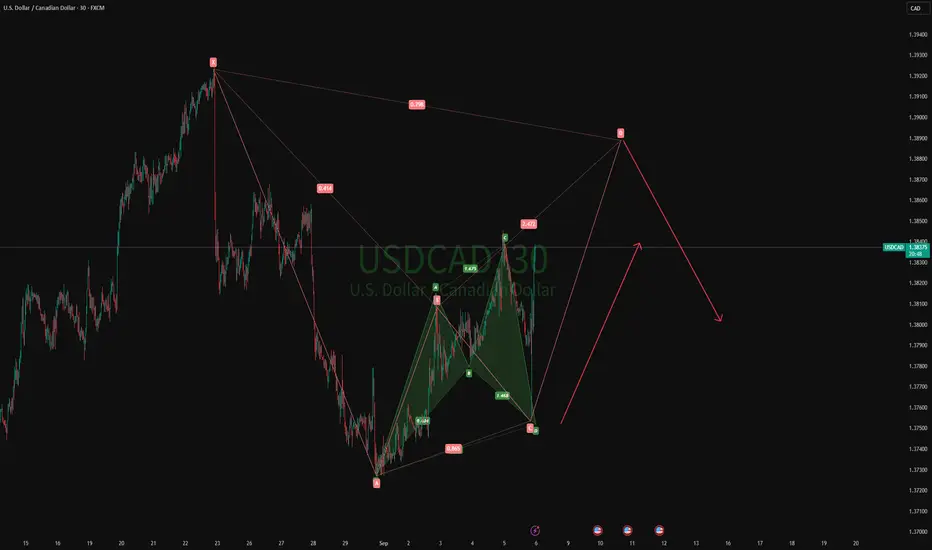
05-09-2025 USDCADAs shown in the figure: 1H Bullish cypher
The market is not always chaotic and disorderly, and there is a precise geometric beauty hidden in price fluctuations. The harmonic form long strategy is a powerful tool for accurately identifying potential market reversal points based on the Fibonacci ratio. When the form forms perfectly at the key support level, it often indicates the depletion of bearish momentum and the initiation of bullish trends.
Sell USD/CAD now at cluster resistance.CAD was one of the top performing majors last week and I expect it to continue. It's the start of a new month and the top wick of the new monthly candle before the downtrend continues. There is Non Farm Payrolls on Friday at the end of the week, so price action before the news event will influence this trades outcome.
Sell now : 1.3814 cluster resistance
Stop : 1.3893 above major resistance
Profit : 1.3656 before 78.6 Fib and rising trendline
Risk 1 : 2

USDCAD – Supply, Demand & Channel Breakdown AnalysisUSDCAD – Supply, Demand & Channel Breakdown Analysis
USDCAD on the H1 timeframe has been moving within an ascending channel, but price recently broke below the channel, showing bearish pressure.
🔴 Supply Zone (1.3827 – 1.3840):
Price tested this zone and failed to push higher.
Sellers are in control from this area.
🔵 Demand Zone (1.3720):
This is the next strong level where buyers previously stepped in.
Acts as a logical take profit target for shorts.
🔑 Summary:
The market rejected the supply zone and broke the channel to the downside. As long as price stays below 1.3830, bearish continuation towards 1.3720 remains valid.

USDCADChart Patterns
**Ascending Trendline Support: Price bounced from a rising trendline, acting as dynamic support.
**Previous Horizontal Support Zone: Also aligns with the Fibonacci 0.5 level from the recent move.
**Potential Double Bottom at support area (watch for confirmation with bullish momentum).
Indicators
RSI (Relative Strength Index):
**Currently near the oversold region (~30), suggesting a potential bullish reversal.
**Possible bullish divergence (price making higher lows while RSI makes lower lows – needs confirmation).
Fibonacci Retracement
**Fib levels from recent low to high are drawn.
**Price bounced near the 50% retracement, a common reversal level.

USD/CAD – Bulls Eyeing a Bounce from Key Demand ZoneAfter an aggressive correction from the 1.3920 highs, USD/CAD has now landed on a heavy demand zone near 1.3720 – 1.3740. This area has proven to be a launchpad for rallies in recent weeks, and price is once again testing buyers’ conviction. With both technical structure and macro fundamentals in play, this zone could determine the next major swing.
Current Bias
Bullish bias as long as 1.3720 holds, with upside potential toward 1.3818 and 1.3920 supply.
Key Fundamental Drivers
USD: Supported by sticky inflation (Core PCE 2.9% y/y) and resilient consumer spending (+0.5% m/m). Fed rate cut expectations have softened, keeping the dollar supported.
CAD: Weighed down by weaker Canadian GDP (Q2 annualized -1.6%, q/q -0.4%) and slowing momentum in domestic growth. Oil remains weak near $64, offering little support to the loonie.
Macro Context
Rates: The Fed remains cautious with cuts, while the BoC faces pressure from economic contraction. Interest rate divergence favors the USD.
Growth Trends: US growth remains firmer compared to Canada’s slowdown.
Commodities: Oil’s weakness is a drag on CAD, making the currency vulnerable.
Geopolitics: Ongoing tariff disputes and Middle East energy risks keep USD demand steady as a safe haven, further weighing on CAD.
Primary Risk to the Trend
A deeper selloff in USD on unexpected Fed dovishness or a sharp rebound in oil prices (driven by geopolitical shocks or supply cuts) could strengthen CAD and invalidate the bullish setup.
Most Critical Upcoming News/Event
US ISM PMI & NFP (this week): Key drivers for Fed policy path.
Canada Jobs Report (Friday): Critical for CAD sentiment after the weak GDP print.
Leader/Lagger Dynamics
USD/CAD tends to lag oil and broader USD moves. It often follows the dollar’s momentum, while oil price shocks can lead moves on CAD. Currently, the pair is USD-led, making it more reactive to Fed data than Canadian domestic flows.
Key Levels
Support Levels: 1.3720 – 1.3740 (demand zone), 1.3660.
Resistance Levels: 1.3818 (mid-resistance), 1.3918 – 1.3925 (major supply).
Stop Loss (SL): 1.3650 (below demand zone invalidation).
Take Profit (TP): 1.3818 (first target), 1.3920 (extended target).
Summary: Bias and Watchpoints
USD/CAD is sitting at a key demand zone around 1.3720 – 1.3740, where buyers need to defend the trend. The bias remains bullish above this level, with upside targets at 1.3818 and 1.3920. A break below 1.3650 would invalidate the long setup and expose further downside. With US data in focus and CAD weighed down by weak GDP and soft oil prices, the pair is more likely to follow USD momentum in the near term. Traders should watch NFP and Canada’s jobs data closely, as these will dictate whether this bounce carries to new highs or fades into deeper consolidation.

USDCAD H1 | Potential bearish dropThe Loonie (USD/CAD) has reacted off the sell entry and could drop from this level to the take profit.
Sell entry is at 1.3808, which is a pullback resistance.
Stop loss is at 1.3842, which is a pullback resistance.
Take profit is at 1.3770, which is an overlap support that aligns with the 61.8% Fibonacci retracement.
High Risk Investment Warning
Trading Forex/CFDs on margin carries a high level of risk and may not be suitable for all investors. Leverage can work against you.
Stratos Markets Limited (tradu.com ):
CFDs are complex instruments and come with a high risk of losing money rapidly due to leverage. 65% of retail investor accounts lose money when trading CFDs with this provider. You should consider whether you understand how CFDs work and whether you can afford to take the high risk of losing your money.
Stratos Europe Ltd (tradu.com ):
CFDs are complex instruments and come with a high risk of losing money rapidly due to leverage. 66% of retail investor accounts lose money when trading CFDs with this provider. You should consider whether you understand how CFDs work and whether you can afford to take the high risk of losing your money.
Stratos Global LLC (tradu.com ):
Losses can exceed deposits.
Please be advised that the information presented on TradingView is provided to Tradu (‘Company’, ‘we’) by a third-party provider (‘TFA Global Pte Ltd’). Please be reminded that you are solely responsible for the trading decisions on your account. There is a very high degree of risk involved in trading. Any information and/or content is intended entirely for research, educational and informational purposes only and does not constitute investment or consultation advice or investment strategy. The information is not tailored to the investment needs of any specific person and therefore does not involve a consideration of any of the investment objectives, financial situation or needs of any viewer that may receive it. Kindly also note that past performance is not a reliable indicator of future results. Actual results may differ materially from those anticipated in forward-looking or past performance statements. We assume no liability as to the accuracy or completeness of any of the information and/or content provided herein and the Company cannot be held responsible for any omission, mistake nor for any loss or damage including without limitation to any loss of profit which may arise from reliance on any information supplied by TFA Global Pte Ltd.
The speaker(s) is neither an employee, agent nor representative of Tradu and is therefore acting independently. The opinions given are their own, constitute general market commentary, and do not constitute the opinion or advice of Tradu or any form of personal or investment advice. Tradu neither endorses nor guarantees offerings of third-party speakers, nor is Tradu responsible for the content, veracity or opinions of third-party speakers, presenters or participants.

USDCAD potential head and shoulders topOn the 4-hour chart, USDCAD rebounded to the previous downward band near 0.618 and then encountered resistance and fell back. Currently, we can pay attention to the support near 1.373 below. If it falls below, it is expected to form a head and shoulders top pattern, and the downward target is 1.358-1.365 area.

Bearish drop off?The Loonie (USD/CAD) has rejected off the pivot, which acts as a pullback resistance and could drop to the 1st support that aligns with the 61.8% Fibonacci retracement.
Pivot: 1.3823
1st Support: 1.3770
1st Resistance: 1.3858
Disclaimer:
The above opinions given constitute general market commentary, and do not constitute the opinion or advice of IC Markets or any form of personal or investment advice.
Any opinions, news, research, analyses, prices, other information, or links to third-party sites contained on this website are provided on an "as-is" basis, are intended only to be informative, is not an advice nor a recommendation, nor research, or a record of our trading prices, or an offer of, or solicitation for a transaction in any financial instrument and thus should not be treated as such. The information provided does not involve any specific investment objectives, financial situation and needs of any specific person who may receive it. Please be aware, that past performance is not a reliable indicator of future performance and/or results. Past Performance or Forward-looking scenarios based upon the reasonable beliefs of the third-party provider are not a guarantee of future performance. Actual results may differ materially from those anticipated in forward-looking or past performance statements. IC Markets makes no representation or warranty and assumes no liability as to the accuracy or completeness of the information provided, nor any loss arising from any investment based on a recommendation, forecast or any information supplied by any third-party.

USDCAD SHORTMarket structure Bearish on HTFs DH
Entry at both Weekly and Daily AOi
Weekly Rejection at AOi
previous Weekly Structure Point
Daily Rejection at AOi
Previous Structure point Daily
Around Psych Level 1.38000
H4 EMA retest
H4 Candlestick rejection
Levels 4.46
Entry 100%
REMEMBER : Trading is a Game Of Probability
: Manage Your Risk
: Be Patient
: Every Moment Is Unique
: Rinse, Wash, Repeat!
: Christ is King.

Potential bearish drop?USD/CAD has rejected off the resistance level, which is a pullback resistance and could drop from this level ot our take profit.
Entry: 1.3828
Why we like it:
There is a pullback resistance.
Stop loss: 1.3857
Why we like it:
There is a pullback resistance that is slightly above the 61.8% Fibonacci retracement.
Take profit: 1.3771
Why we like it:
There is an overlap support that aligns with the 61.8% Fibonacci retracement.
Enjoying your TradingView experience? Review us!
Please be advised that the information presented on TradingView is provided to Vantage (‘Vantage Global Limited’, ‘we’) by a third-party provider (‘Everest Fortune Group’). Please be reminded that you are solely responsible for the trading decisions on your account. There is a very high degree of risk involved in trading. Any information and/or content is intended entirely for research, educational and informational purposes only and does not constitute investment or consultation advice or investment strategy. The information is not tailored to the investment needs of any specific person and therefore does not involve a consideration of any of the investment objectives, financial situation or needs of any viewer that may receive it. Kindly also note that past performance is not a reliable indicator of future results. Actual results may differ materially from those anticipated in forward-looking or past performance statements. We assume no liability as to the accuracy or completeness of any of the information and/or content provided herein and the Company cannot be held responsible for any omission, mistake nor for any loss or damage including without limitation to any loss of profit which may arise from reliance on any information supplied by Everest Fortune Group.

USD/CAD - Bullish Pennant (04.09.2025)The USD/CAD pair on the M30 timeframe presents a Potential Buying Opportunity due to a recent Formation of a Bullish Pennant Breakout Pattern. This suggests a shift in momentum towards the upside and a higher likelihood of further advances in the coming hours.
Possible Long Trade:
Entry: Consider Entering A Long Position around Trendline Of The Pattern.
Target Levels:
1st Resistance – 1.3835
2nd Resistance – 1.3853
🎁 Please hit the like button and
🎁 Leave a comment to support for My Post !
Your likes and comments are incredibly motivating and will encourage me to share more analysis with you.
Best Regards, KABHI_TA_TRADING
Thank you.
Disclosure: I am part of Trade Nation's Influencer program and receive a monthly fee for using their TradingView charts in my analysis.

USDCAD Set To Fall! SELL!
My dear friends,
Please, find my technical outlook for USDCAD below:
The instrument tests an important psychological level 1.3832
Bias - Bearish
Technical Indicators: Supper Trend gives a precise Bearish signal, while Pivot Point HL predicts price changes and potential reversals in the market.
Target - 1.3804
About Used Indicators:
Super-trend indicator is more useful in trending markets where there are clear uptrends and downtrends in price.
Disclosure: I am part of Trade Nation's Influencer program and receive a monthly fee for using their TradingView charts in my analysis.
———————————
WISH YOU ALL LUCK
USDCAD - BULLISH MOVE!Hello Traders!
The USDCAD price formed an inverted head and shoulders pattern.
Currently, the neckline is broken!
So, I expect a bullish move🚀
______________
TARGET: 1.38480🎯

USD/CAD SENDS CLEAR BEARISH SIGNALS|SHORT
USD/CAD SIGNAL
Trade Direction: short
Entry Level: 1.382
Target Level: 1.369
Stop Loss: 1.391
RISK PROFILE
Risk level: medium
Suggested risk: 1%
Timeframe: 1D
Disclosure: I am part of Trade Nation's Influencer program and receive a monthly fee for using their TradingView charts in my analysis.
✅LIKE AND COMMENT MY IDEAS✅


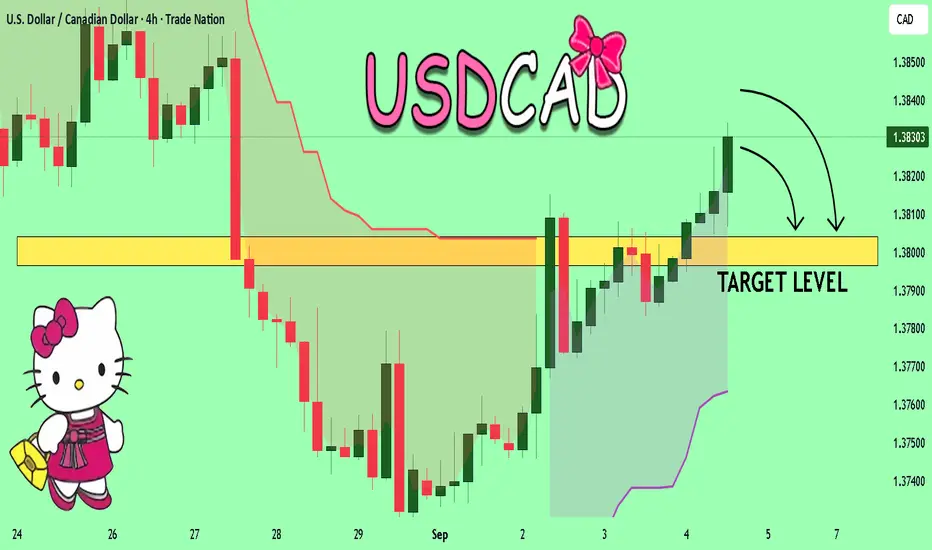
USD/CAD steadies as traders weigh US jobs buildup and Canadian tMarket overview
USD/CAD is holding around 1.3810 on Thursday after a choppy week of data-driven swings. The dollar is consolidating following softer ISM manufacturing readings that highlighted weakness in US factory activity, while the services sector and labor market will take center stage heading into Friday’s nonfarm payrolls. Traders remain cautious ahead of ADP employment and ISM services today, which are expected to refine expectations for a September Fed rate cut.
The Canadian dollar is struggling to capitalize on firmer oil prices after OPEC’s signaling of potential output hikes weighed on the commodity earlier in the week. Domestic fundamentals remain mixed: Q2 productivity contracted at -1.0% q/q, underscoring competitiveness challenges, while today’s trade balance will be scrutinized for signs of improvement after July’s -5.86B deficit. Market positioning suggests CAD resilience depends on strong labor and trade readings later in the week, otherwise leaving USD/CAD range-bound near current levels.
Technical analysis
Current technical conditions and main scenario
The 4-hour chart shows USD/CAD bouncing off 1.3780 support and testing resistance at 1.3810. Price action has broken above a short-term descending trendline, signaling that momentum may be shifting. A sustained move above 1.3810–1.3820 would confirm a bullish breakout, targeting 1.3832 (200% Fibonacci extension) and potentially opening the door toward 1.3860 if follow-through builds.
Alternative scenario
If the pair fails to sustain above 1.3810 and dips back under 1.3798, a retracement toward 1.3780 support is possible. A decisive break beneath 1.3780 would undermine the bullish case and re-expose 1.3750 as the next downside target.

USDCAD Long (70% probability)Looking at the technical analysis in chart, USDCAD tested last demand zone.
I expect a push to the next supply level, and executed two long order on it.
First order is a swing trade, executed from the current price with a wide stop. The other, is a buy limit, with tight stop targeting next supply zone, as indicated on chart.

COMPLETION OF HEAD AND SHOULDERSLooking for opportunity to short USDCAD on completion of the right shoulder down to my demand zone that is support of my ascending structure.

Potentially bullish rise?The Loonie (USD/CAD) has bounced off the pivot and would rise to the 1st resistance that is slightly above the 61.8% Fibonacci retracement.
Pivot: 1.3779
1st Support: 1.3731
1st Resistance: 1.3858
Risk Warning:
Trading Forex and CFDs carries a high level of risk to your capital and you should only trade with money you can afford to lose. Trading Forex and CFDs may not be suitable for all investors, so please ensure that you fully understand the risks involved and seek independent advice if necessary.
Disclaimer:
The above opinions given constitute general market commentary, and do not constitute the opinion or advice of IC Markets or any form of personal or investment advice.
Any opinions, news, research, analyses, prices, other information, or links to third-party sites contained on this website are provided on an "as-is" basis, are intended only to be informative, is not an advice nor a recommendation, nor research, or a record of our trading prices, or an offer of, or solicitation for a transaction in any financial instrument and thus should not be treated as such. The information provided does not involve any specific investment objectives, financial situation and needs of any specific person who may receive it. Please be aware, that past performance is not a reliable indicator of future performance and/or results. Past Performance or Forward-looking scenarios based upon the reasonable beliefs of the third-party provider are not a guarantee of future performance. Actual results may differ materially from those anticipated in forward-looking or past performance statements. IC Markets makes no representation or warranty and assumes no liability as to the accuracy or completeness of the information provided, nor any loss arising from any investment based on a recommendation, forecast or any information supplied by any third-party.
