USDCAD Expected Growth! BUY!
My dear friends,
Please, find my technical outlook for USDCAD below:
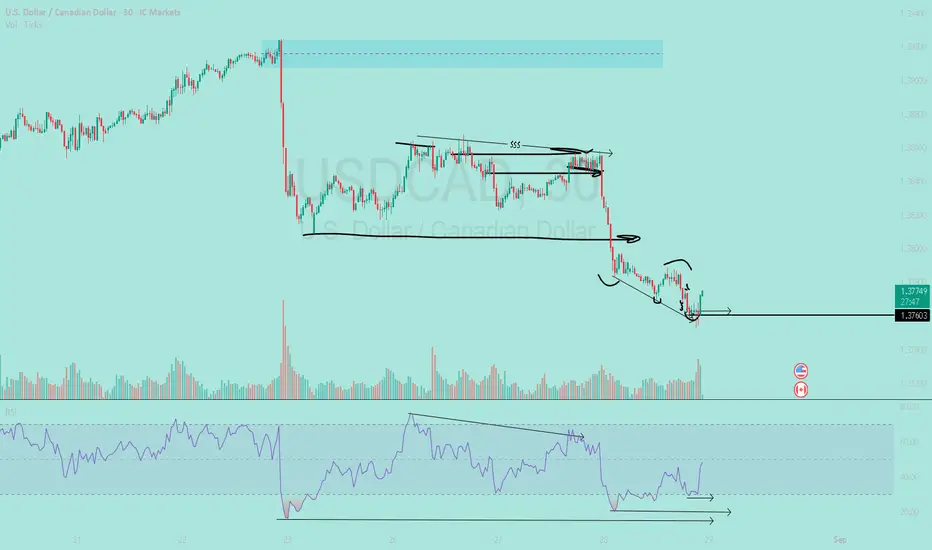
The price is coiling around a solid key level - 1.3742
Bias - Bullish
Technical Indicators: Pivot Points Low anticipates a potential price reversal.
Super trend shows a clear buy, giving a perfect indicators' convergence.
Goal - 1.3794
About Used Indicators:
The pivot point itself is simply the average of the high, low and closing prices from the previous trading day.
Disclosure: I am part of Trade Nation's Influencer program and receive a monthly fee for using their TradingView charts in my analysis.
———————————
WISH YOU ALL LUCK
Trade ideas

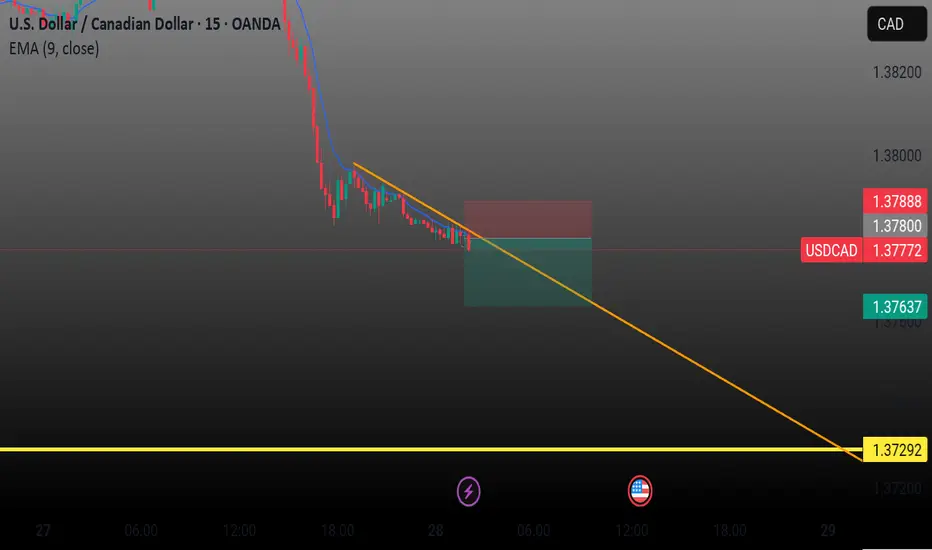
USDCAD Wave Analysis – 28 August 2025- USDCAD broke daily up channel
- Likely to fall to support level 1.3715
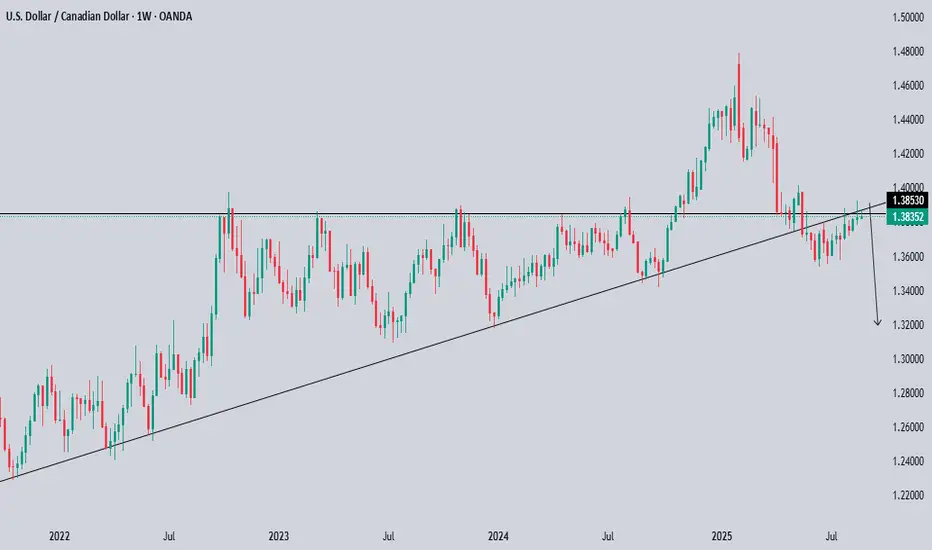
USDCAD currency pair recently reversed down from the resistance zone between the resistance level 1.3900, upper daily Bollinger Band and the 38.2% Fibonacci correction of the downward impulse from February.
The price just broke the support trendline of the daily up channel from July – which should accelerate the active wave 2.
Given the clear daily downtrend, USDCAD currency pair can be expected to fall to the next support level 1.3715 (target price for the completion of the active wave 2).

123 BOTTOM CONFIRMED ON USD/CAD MORE SEASONAL STRENGH AHEAD?Hey traders so today checking out USD/CAD Forex Pair this is looking bullish on the charts.
For those new to trading forex USD/CAD it moves opposite the actual currency meaning if Canadian Dollar is strong this pair will fall. If Canadian Dollar is weak this pair will rise.
So there is normally a Seasonal Pattern where the Canadian Dollar weakens in the fall due to less energy demand. That means the USD/CAD will rise.
Well so far we see a bottom formation on the charts is the market trying to tell us something?
Don't let that chart fool you! No one knows😁
But trading is all about probabilities so if we have a chart bottom plus possible seasonal patterns ahead. That indicates good enough risk/reward to consider a trade. However if the FED cuts interest rates we could see the US Dollar Weaken fast but know one knows for sure how a cut will affect the market especially if he says no further cuts will be done for a while.
So Scenarios for today are...
Bullish- YES strong bottom formation already confirmed on the charts unless the market takes out the low of 1.3540 this market is a buy on any pullback.
Bearish- uh I would not trade personally against a seasonal pattern because it's going against the grain. But then again sometimes being a contrarion can work. But seriously I would not short it unless market broke that low 1.3540. Then the market has proved to you it wants to move higher before taking a risk.
COT (Commitment of Traders) - the report currently shows the funds large specs short the Canadian Dollar so doesn't look oversold yet on the instituional positioning end.
Good Luck & Always use Risk Management!
(Just in we are wrong in our analysis most experts recommend never to risk more than 2% of your account equity on any given trade.)
Hope This Helps Your Trading 😃
Clifford
RISK DISCLOSURE
TRADING IN THE FUTURES AND FOREX MARKET INVOLVES SIGNIFICANT RISK. ALWAYS CONSULT A FINANCIAL ADVISOR AS HIGH RISK ASSET CLASSES MAY NOT BE SUITABLE FOR ALL INVESTORS. THIS IS NOT A RECOMMENDATION TO BUY OR SELL ANY ASSETS. ALL IDEAS ARE MADE FOR EDUCATIONAL PURPOSES. PAST PERFORMANCE DOES NOT GUARANTEE FUTURE RESULTS.
CFTC RULE 4.41 – HYPOTHETICAL OR SIMULATED PERFORMANCE RESULTS HAVE CERTAIN LIMITATIONS. UNLIKE AN ACTUAL PERFORMANCE RECORD, SIMULATED RESULTS DO NOT REPRESENT ACTUAL TRADING.

usdcadmarket buy on usd cad.
rsi double bottom is my set up.
htf 30min. ltf 15/5
structure met my standard.

USDCAD Technical & Order Flow AnalysisOur analysis is based on a multi-timeframe top-down approach and fundamental analysis.
Based on our assessment, the price is expected to return to the monthly level.
DISCLAIMER: This analysis may change at any time without notice and is solely intended to assist traders in making independent investment decisions. Please note that this is a prediction, and I have no obligation to act on it, nor should you.
Please support our analysis with a boost or comment!
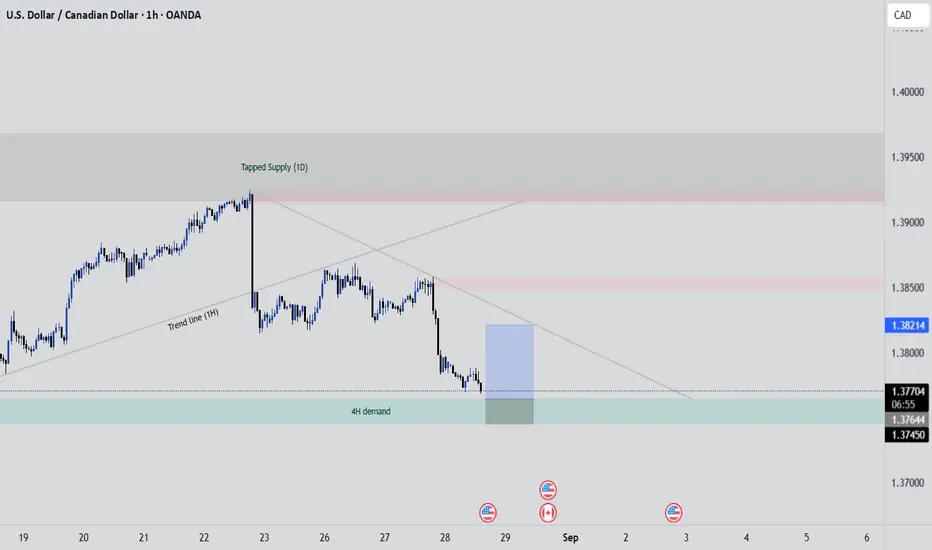
USDCAD (Scalp or Intraday)The price is near demand zone of 4H , which is actually strong one. The price is bearish in lower time frame So this trade is against the trend but with confluence , Price need a good pull back to fill order from lates supply and to break support + demand zone to continue bearish momentum. So we are targeting most recent supply zone and by staying below the trend line. The R:R is 1:2.5 so its good for me.
Will update later on.
NOTE : I am a beginner and learner these trade setup are for learning. If you want to make any improvements in this or suggestions do comment.
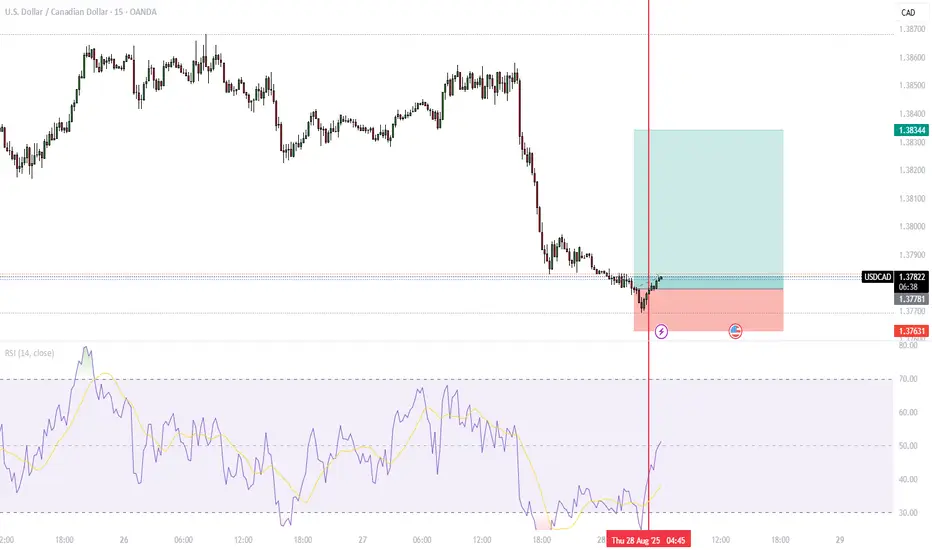
Lingrid | USDCAD Potential Long Trade From Support ZoneThe price perfectly fulfilled my previous idea . FX:USDCAD is retracing from the recent Higher High after stalling at the resistance zone. The structure has shifted into a compression channel followed by a breakout sequence that faded into a range. Price is now hovering just above support and aligned with the downward trendline, setting up a reaction point. A rebound from this zone could trigger an upward projection back toward 1.3839.
📉 Key Levels
Buy trigger: Hold above 1.3760
Buy zone: Support area near 1.3760–1.3780
Target: 1.3839
Invalidation: Breakdown below 1.3693
💡 Risks
Failure to hold the support zone at 1.3760 would negate the bullish case.
Strength in the Canadian dollar from oil market volatility could weigh on upside potential.
U.S. economic data surprises (PCE or jobs) could reinforce bearish momentum.
If this idea resonates with you or you have your own opinion, traders, hit the comments. I’m excited to read your thoughts!

Next possible bullish set upThe price haven’t yet took out IRL and respect key level FVG which has to be our entry point then price must move towards our ERL
USD/CADOn USDCAD, I’m currently spotting a bullish divergence across the 1H, 30M, and 15M timeframes. Price has broken out of the 3-hour uptrend, which suggests the current move could be forming a retest structure.
At the moment, price is pushing upward. My key level of interest is around 1.37973 — this will serve as the critical breaking point. If price successfully breaks and holds above this level, my target is set near 1.38266, which I expect to be a potential hot area for reaction.
However, if price fails to break through 1.37973, I’ll be anticipating a push back down instead, which would confirm weakness and a potential bearish move.
This setup could present an easy entry opportunity, but I’ll wait for confirmation at 1.37973 before committing to either direction.

UDS/CADOn USDCAD, I’ve identified a potential divergence. If price action respects this divergence, I’ll be looking for a bullish move. However, if the divergence fails to hold, I’ll shift my bias and anticipate a bearish continuation.

USDCADUSDCAD appears to be oversold after an impulsive move to the downside, I'm expecting price to retrace back to the upside now, risking 2:1 RR.
USD/CAD set upOANDA:USDCAD
The market is currently forming a potential double bottom at this level. A confirmed rejection and acceptance of this structure would support a bullish continuation. However, failure to hold and accept the double bottom pattern will invalidate the setup and likely result in a bearish move.

Usdcad profit smashedThat was a warm up for today I believe it's still gonna pullback maybe we can catch that big move

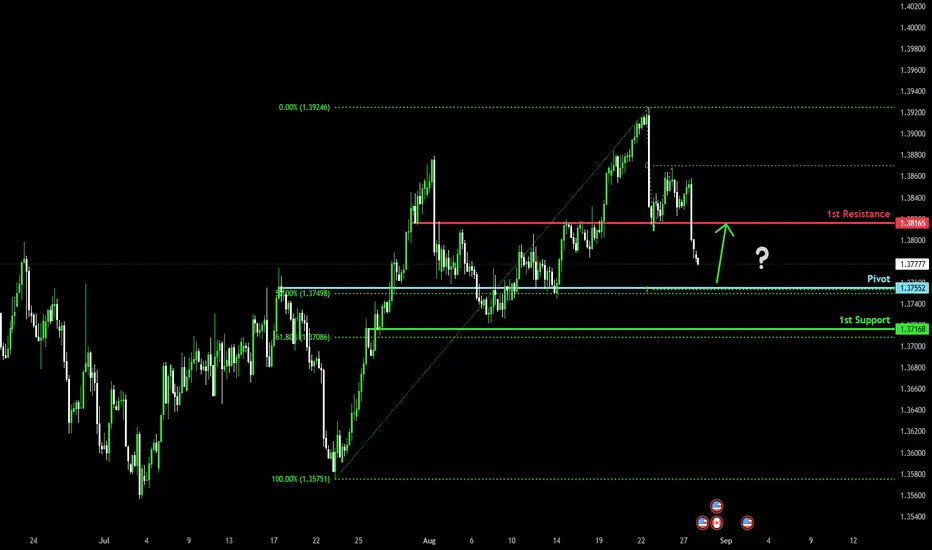
Approaching 50% Fib Support?The Loonie (USD/CAD) is falling towards the pivot which has been identified as an overlap support and could bounce to the 1st resistance which acts as an overlap resistance.
Pivot: 1.3755
1st Support: 1.3716
1st Resistance: 1.3816
Risk Warning:
Trading Forex and CFDs carries a high level of risk to your capital and you should only trade with money you can afford to lose. Trading Forex and CFDs may not be suitable for all investors, so please ensure that you fully understand the risks involved and seek independent advice if necessary.
Disclaimer:
The above opinions given constitute general market commentary, and do not constitute the opinion or advice of IC Markets or any form of personal or investment advice.
Any opinions, news, research, analyses, prices, other information, or links to third-party sites contained on this website are provided on an "as-is" basis, are intended only to be informative, is not an advice nor a recommendation, nor research, or a record of our trading prices, or an offer of, or solicitation for a transaction in any financial instrument and thus should not be treated as such. The information provided does not involve any specific investment objectives, financial situation and needs of any specific person who may receive it. Please be aware, that past performance is not a reliable indicator of future performance and/or results. Past Performance or Forward-looking scenarios based upon the reasonable beliefs of the third-party provider are not a guarantee of future performance. Actual results may differ materially from those anticipated in forward-looking or past performance statements. IC Markets makes no representation or warranty and assumes no liability as to the accuracy or completeness of the information provided, nor any loss arising from any investment based on a recommendation, forecast or any information supplied by any third-party.

The USDCAD currency pair is correcting the upward trend on the oThe USDCAD currency pair is correcting the upward trend on the one-hour timeframe, and my analysis is that at the specified points, this currency pair will enter the upward phase again and experience higher numbers.

USDCAD analysis → The USD/CAD pair has reached a resistance zone on the weekly timeframe, and on its fractal timeframe (the 4-hour chart), it has formed a bearish trend. In case of a pullback to the specified level, a short (sell) swing position can be opened.

USDCAD 27/08/2025Weekly:
-Weekly highs.
Daily:
-H&S pattern.
-Previous day's high liquidity sweep.
4H:
-Bearish W pattern.
-Supply zone.

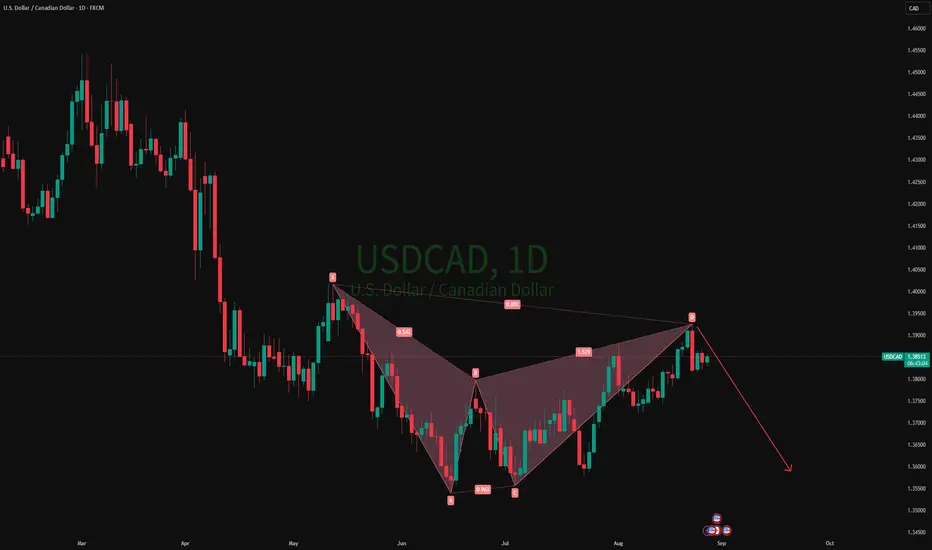
27-08-2025 USDCADThe market is not always chaotic and disorderly, and there is a precise geometric beauty hidden in price fluctuations. The harmonic form long strategy is a powerful tool for accurately identifying potential market reversal points based on the Fibonacci ratio. When the form forms perfectly at the key support level, it often indicates the depletion of bearish momentum and the initiation of bullish trends.
As shown in the figure: 1D Bearish Bat
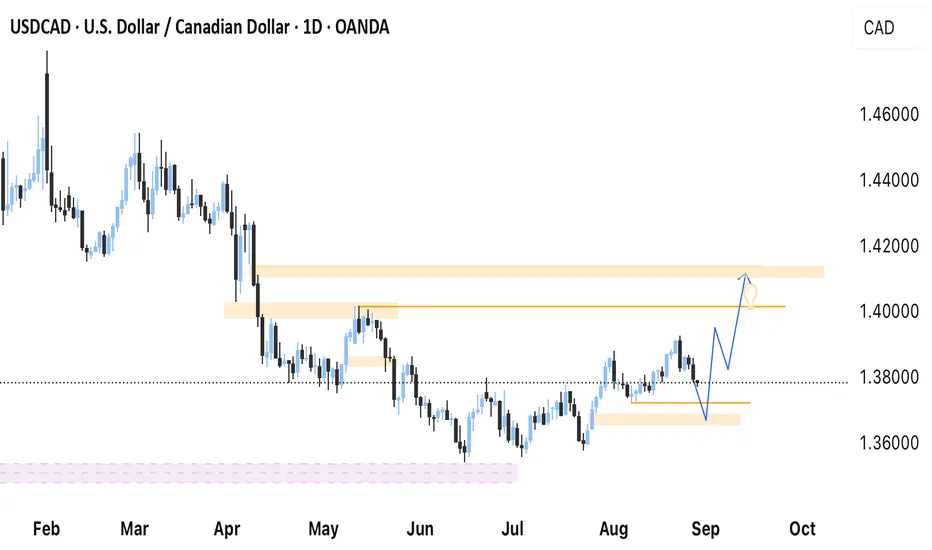
USDCAD uptrend resistance at 1.3890The USDCAD remains in a bullish trend, with recent price action showing signs of a corrective pullback within the broader uptrend.
Support Zone: 1.3795 – a key level from previous consolidation. Price is currently testing or approaching this level.
A bullish rebound from 1.3795 would confirm ongoing upside momentum, with potential targets at:
1.3890 – initial resistance
1.3920 – psychological and structural level
1.3945 – extended resistance on the longer-term chart
Bearish Scenario:
A confirmed break and daily close below 1.3795 would weaken the bullish outlook and suggest deeper downside risk toward:
1.3770 – minor support
1.3745 – stronger support and potential demand zone
Outlook:
Bullish bias remains intact while the USDCAD holds above 1.3795. A sustained break below this level could shift momentum to the downside in the short term.
This communication is for informational purposes only and should not be viewed as any form of recommendation as to a particular course of action or as investment advice. It is not intended as an offer or solicitation for the purchase or sale of any financial instrument or as an official confirmation of any transaction. Opinions, estimates and assumptions expressed herein are made as of the date of this communication and are subject to change without notice. This communication has been prepared based upon information, including market prices, data and other information, believed to be reliable; however, Trade Nation does not warrant its completeness or accuracy. All market prices and market data contained in or attached to this communication are indicative and subject to change without notice.

Sell USDCADI have changed my mind about USDCAD. USDCAD [rice is presenting bearish signs. A bearish flag on the 1hr chart and head and shoulders pattern on the 2hr chart.
