USDCAD rise/fall?USDCAD at a key zone and showing signs of weakness. Some major news coming in less than 2 hours, waiting for liquidations and reactions to jump in on sniper entries.
Trade ideas

USDCAD easy buy setupNice buy signal for USDCAD.
We see an impulsive up after a 3 wave correction. We also have a divergence on MACD.
Good trade for a 1:1 rr
Lets watch.

Stop!Loss|Market View: USDCAD🙌 Stop!Loss team welcomes you❗️
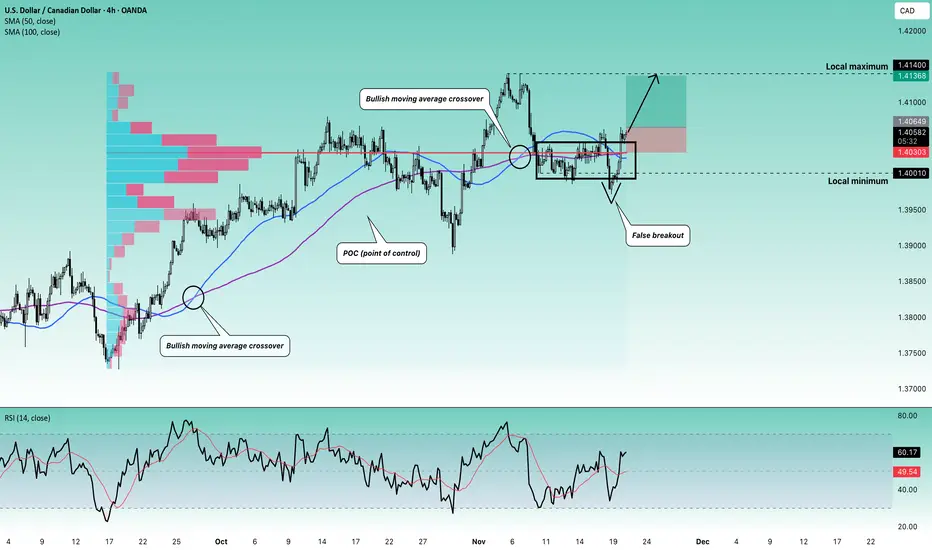
In this post, we're going to talk about the near-term outlook for the USDCAD currency pair☝️
Potential trade setup:
🔔Entry level: 1.40649
💰TP: 1.41368
⛔️SL: 1.40303
"Market View" - a brief analysis of trading instruments, covering the most important aspects of the FOREX market.
👇 In the comments 👇 you can type the trading instrument you'd like to analyze, and we'll talk about it in our next posts.
💬 Description: This currency pair was previously defined as a buy pair, and this one is proceeding exactly as per the previous analysis, with the buy priority remaining. Given the current context, namely, a breakout of the upper balance boundary above 1.40010, an additional, shorter-term buy trade can be considered with the same target as before, namely, near 1.41400.
Thanks for your support 🚀
Profits for all ✅
USDCAD Under Pressure! SELL!
My dear subscribers,
This is my opinion on the USDCAD next move:
The instrument tests an important psychological level 1.4029
Bias - Bearish
Technical Indicators: Supper Trend gives a precise Bearish signal, while Pivot Point HL predicts price changes and potential reversals in the market.
Target - 1.4009
My Stop Loss - 1.4041
About Used Indicators:
On the subsequent day, trading above the pivot point is thought to indicate ongoing bullish sentiment, while trading below the pivot point indicates bearish sentiment.
Disclosure: I am part of Trade Nation's Influencer program and receive a monthly fee for using their TradingView charts in my analysis.
———————————
WISH YOU ALL LUCK

POTENTIAL BUY CONTINUATION ON USDCAD or lowerlevelsThis position on USDCAD here and if it break, we tap into the lower level for the buy.
This looks like a return to base with structure (if the next few candles present bullish opportunity)
Will keep an eye on it to see whether an opportunity present itself

USDCAD | Eyeing the 1.3900 Support Zone – Potential Retest AheadUSDCAD is holding near the 1.40 region as softer Canadian inflation and weaker crude keep the loonie on the back foot. The US dollar remains broadly supported, giving the pair a steady tone despite recent technical softness.
Technical Lens:
Price has slipped out of the rising wedge, and momentum is gently leaning lower. The broader structure still points toward the 1.3900 area, which lines up with a prior swing low and a key Fibonacci marker. It stands out as the next meaningful support if this drift continues.
Scenarios:
If the move lower develops further below the broken wedge, price may start gravitating toward the 1.3900 zone over the coming weeks.
If buyers manage to rebuild traction back inside the former channel, a temporary recovery phase could unfold before any clearer direction takes shape.
Catalysts:
Recent Canadian CPI readings, BoC expectations, oil volatility, and upcoming US releases and Fed communication as the data cycle normalises.
Takeaway:
1.3900 looks like a convincing support zone to monitor, acting as the next major inflection point on the medium-term path.

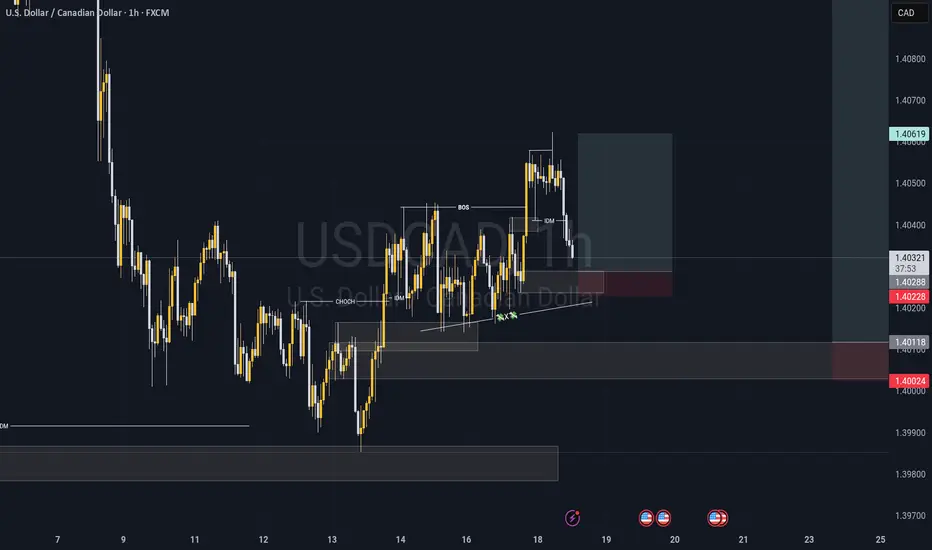
Swinging USDCAD from a discounted levelHello everyone... I'm back !!!
CHOCH + BOS + Liq (IND) + H1 OB
New signal Alert 🚨
USDCAD
Pair: USD/CAD (United States/Canadian Dollar)
Side: BUY (Buy Limit)
Entry: 1.4028
QP/STP: 1.4043 (15 pips)
TP 1: 1.4058 (30 pips)
TP 2: Open
Stop Loss: 1.40220 (6 pips - enough space for price to breathe)
Do not over-leverage your account, use proper risk and money management.
I8.11.25
Matthew 6:33
Ask me anything !!!
USDCAD back to falling?USDCAD waiting for retest from Break out of TrendLine for a continuing drop in the London session.

USD/CAD Trade Aler🚨 USD/CAD Trade Alert 🚨
━━━━━━━━━━━━━━━━━━━
Type: 🟢 Buy
Entry: 1.40390
Take Profit (TP): 🎯 1.40670
Stop Loss (SL): ❌ 1.40254
━━━━━━━━━━━━━━━━━━━
📈 Status: Active
💡 Market Insight:
Price sits above support and holds a bullish tone while it trades over 1.40254. The setup targets 1.40670. A drop below the stop level cancels the trade.

USDCAD H1 | Bullish Bounce off Key SupportMomentum: Bullish
Price is currently within the bullish ichimoku cloud.
Buy entry: 1.40115
- Overlap support
- 61.8% Fib retracement
Stop Loss: 1.3988
- Swing low support
Take Profit: 1.4037
- Swing high resistance
High Risk Investment Warning
Stratos Markets Limited (tradu.com/uk ), Stratos Europe Ltd (tradu.com/eu ):
CFDs are complex instruments and come with a high risk of losing money rapidly due to leverage. 70% of retail investor accounts lose money when trading CFDs with this provider. You should consider whether you understand how CFDs work and whether you can afford to take the high risk of losing your money.
Stratos Global LLC (tradu.com/en ): Losses can exceed deposits.
Please be advised that the information presented on TradingView is provided to Tradu (‘Company’, ‘we’) by a third-party provider (‘TFA Global Pte Ltd’). Please be reminded that you are solely responsible for the trading decisions on your account. Any information and/or content is intended entirely for research, educational and informational purposes only and does not constitute investment or consultation advice or investment strategy. The information is not tailored to the investment needs of any specific person and therefore does not involve a consideration of any of the investment objectives, financial situation or needs of any viewer that may receive it. Past performance is not a reliable indicator of future results. Actual results may differ materially from those anticipated in forward-looking or past performance statements. We assume no liability as to the accuracy or completeness of any of the information and/or content provided herein and the Company cannot be held responsible for any omission, mistake nor for any loss or damage including without limitation to any loss of profit which may arise from reliance on any information supplied by TFA Global Pte Ltd.

BULLISH MOVEThe price formed head and shoulder structure and has broken price above the resistance zone indicating a bullish momentum. Lets expect buys currently.

Buy USDCSDResistance became a support. Stop and profit as follows. Resistance became a support. Stop and profit as follows. Resistance became a support. Stop and profit as follows. Resistance became a support. Stop and profit as follows. Resistance became a support. Stop and profit as follows. Resistance became a support. Stop and profit as follows.

USDCAD: Support & ResistanceI’ve identified two key zones: Support and Resistance.
I’ll act according to whichever zone the price reaches.

USDCAD buy positionOne hour after NY open, USDCAD reversed to P line, additionally confirming my Session low and a 1hr Cap wave.

USDCADUSDCAD is Bullish and currently on a corrective phase. I expect USDCAD to push up to complete a 3 sub corrective wave y before an impulse down to complete sub 2 leg for an impulsive to complete Major leg 3. Keep an eye on the arrows.

USD/CADThis one has a little bit ugly.. i don't know.. just let the market tells me what i'm gonna do..

USD/CAD: Wave of Destruction or Dollar RevivalUSD/CAD: Wave of Destruction or Dollar Revival
📈 Possible Scenarios for the Week
Bearish Scenario (Main Scenario):
Price breaks below ~1.3777
Wave (5) is developing → possible decline to ~1.3570–1.3425
Corrective (Bullish) Scenario:
USD/CAD holds current support
A corrective wave upward is developing to ~1.3970–1.4150
Consolidation:
Range between ~1.3777 and ~1.3970
Prices are gaining strength before the next impulse
✅ Conclusion
USD/CAD could see significant movement in the coming week—the pair is at a crossroads: either the major bearish impulse will continue, or an upward correction will begin.
Key levels: 1.3777 (support) and 1.3970 (resistance)
When trading, it's worth watching for confirmation of the wave structure and price reaction at the designated levels.

USDCAD Bearish ModelAbout two weeks ago, UCAD gave us a clean sell-off. Last week, I expected price to form a bullish pullback before continuing lower. Instead of that pullback, price just slowly drifted down. But, the bearish pressure wasn’t convincing enough to signal a true continuation to the downside.
Now that we’ve finally seen the bullish momentum I was looking for, my focus is on price reaching my area of interest around 1.40873. Once we tap into that level, I’ll be looking for sell setups.

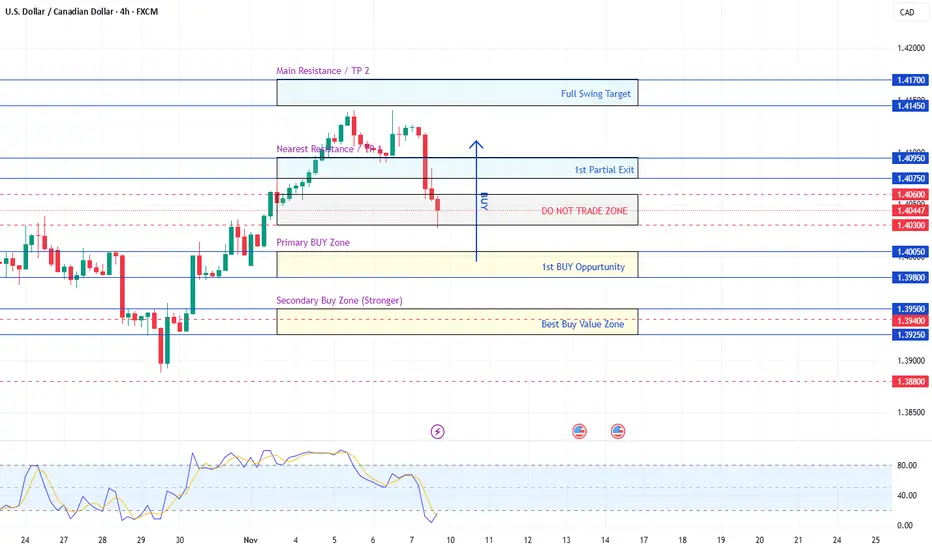
USDCAD - 4H - Weekly Analysis (10-Nov - 14-Nov-25)Market Structure
The trend was bullish, but price has now rejected sharply from 1.4140+.
Current price is pulling down, heading toward support.
Stochastic is oversold, so selling now is late.
Best opportunity is to BUY THE DIP at strong demand zones — not where price is now.
We wait for price to drop into support, then buy.
Key Levels
Zone / Price Range / Action
Primary Buy Zone / 1.3980 – 1.4005 / First buy opportunity
Secondary Buy Zone (Stronger) / 1.3925 – 1.3950 / Best buy value zone
Nearest Resistance / TP1 / 1.4075 – 1.4095 / First partial exit
Main Resistance / TP2 / 1.4145 – 1.4170 / Full swing target
✅ Primary Trade Setup
This is the trade most likely to trigger next week.
BUY LIMIT: 1.3980 – 1.4005
STOP LOSS: 1.3940
TAKE PROFIT 1: 1.4075
TAKE PROFIT 2: 1.4145
Why this works
Price is correcting to retest previous demand zone.
Stochastic is already oversold → momentum will shift upward soon.
You’re entering near discount, not chasing.
🟡 Secondary Setup (If price dips deeper)
If price breaks through the first buy zone:
BUY LIMIT: 1.3925 – 1.3950
STOP LOSS: 1.3880
TAKE PROFIT: 1.4000 → 1.4075 → 1.4145
This is the “high value / institutional entry” zone.
🎯 Expected Price Flow for 10–14 Nov
Early Week (Mon–Tue): Price slides toward 1.4000 → 1.3950
Mid Week (Wed): Bullish recovery begins
Late Week (Thu–Fri): Rally toward 1.4075 → 1.4145
This pattern aligns with:
CAD oil-linked volatility
USD strength recovery cycles
Standard market structure retracement → continuation
🏁 Quick Trading Card (Copy to Notes)
Main Buy
Entry: 1.3980 – 1.4005
SL: 1.3940
TP1: 1.4075
TP2: 1.4145
Deep Value Buy
Entry: 1.3925 – 1.3950
SL: 1.3880
TP: 1.4000 → 1.4075 → 1.4145
🚫 Avoid Trading Here - 1.4030 – 1.4060
This is a no-trade chop zone (no advantage, low probability).
USDCAD - 4H - Weekly Analysis - (17–21 Nov 2025)Market Condition Summary
Trend Bias: Sideways → Bearish
Price Structure: Lower highs forming; rejection from 1.4045–1.4060 resistance
Stochastic: Turning down from overbought (bearish momentum forming)
Volatility: Increasing but still inside a price box
USDCAD is currently stuck between:
🔹 Resistance:
1.4045 – 1.4060 (Strong rejection zone — price failed 3x)
🔹 Support:
1.3985 – 1.3990
1.3925 – 1.3910 (Major Target if breakout happens)
Given the bearish rejection candle pattern + Stochastic turning down + lower high formation → SELL setups are stronger for next week.
🎯 PRIMARY TRADE SETUP (SELL)
📌 Sell Entry Zones:
1️⃣ Entry #1 (Aggressive Sell):
1.4025 – 1.4040
→ Where price is currently rejecting.
2️⃣ Entry #2 (Best Entry – Liquidity Grab):
1.4060 – 1.4075
→ If price spikes up during Monday/Tuesday before the drop.
🛑 Stop Loss Placement
SL: 1.4105
Above:
✔ previous wick highs
✔ liquidity pool
✔ structural invalidation level
🎯 Take Profit Targets
TP1 – Nearest Support:
1.3985
TP2 – Main Support:
1.3925
TP3 – Extended Target (if strong bearish momentum):
1.3890
📊 TRADE PLAN
If market opens flat or slowly climbs:
✅ Wait for a push into 1.4040–1.4060
→ Then SELL after bearish candle confirmation (pin bar / engulfing)
If market drops immediately:
❌ Do NOT chase
→ Wait for price to retrace back into the supply zone 1.4025–1.4040
→ Then enter sell
🔥 ALTERNATE BUY SCENARIO (only if bearish level breaks)
Only BUY if price closes above 1.4105 on 4H.
Buy above breakout:
Entry: 1.4110
SL: 1.4060
TP: 1.4175 / 1.4200
➡️ This is LOW probability next week.

USD/CAD 1DUSD/CAD is setting up for a clean sell opportunity.
The pair has been losing bullish momentum, showing clear exhaustion around the key supply zone.
With weakening USD fundamentals and stronger outlook on the CAD—supported by rising oil prices—the market is positioning for a deeper correction.
I’m watching for lower highs, break of structure, and confirmation of bearish flow before entering the move.
Patience and precision. Nothing else.

USDCAD rise/fall?USDCAD is starting to move back down now going into London session. Let's see how the news affects it going to NY session as it has a high probability of it falling to the last couple of days Lows and beyond.

USDCAD H4 SellThe price is correcting a downward wave... It is expected to start its downward movement to the specified target after touching the red zone.
