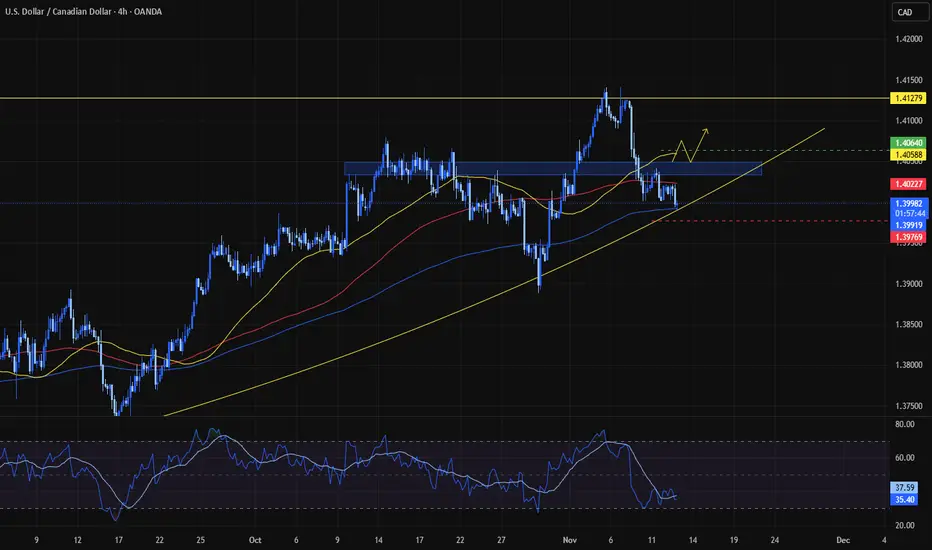
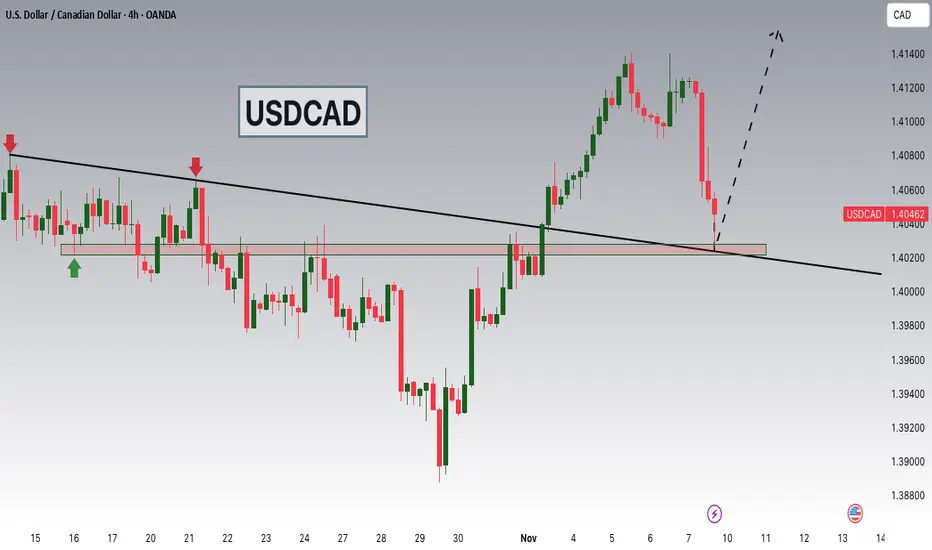
USDCAD – Buy the sweep into H4/D FVG, target the gap aboveBias: Tactical long on H4 if we sweep the micro-support (≈1.3990–1.3980) into the daily/H4 FVG and launch with displacement.
Prior impulsive up-leg, then corrective drop into a higher-TF discount.
H4 shows micro support just above a broad D FVG 1.3960–1.4000.
MACD flattening, RSI basing ~40 (room to mean-revert).
Targets
T1: 1.4035–1.4040 (MSB/structure flip).
T2: 1.4065–1.4085 (upper supply / D-FVG fill).
Stretch: 1.4100–1.4120 if momentum holds.
Trade ideas

Stop!Loss|Market View: USDCAD🙌 Stop!Loss team welcomes you❗️
In this post, we're going to talk about the near-term outlook for the USDCAD currency pair☝️
Potential trade setup:
🔔Entry level: 1.39721
💰TP: 1.41321
⛔️SL: 1.39021
"Market View" - a brief analysis of trading instruments, covering the most important aspects of the FOREX market.
👇 In the comments 👇 you can type the trading instrument you'd like to analyze, and we'll talk about it in our next posts.
💬 Description: Strengthening of the USD is expected in the near future, as noted in previous reviews. Against this backdrop, the Canadian dollar could demonstrate one of the most effective moves in favor of the USD. The buying zone is currently located in the range of 1.39400 - 1.40010. The most likely scenario is an upward reversal from this area with a target of resistance at 1.41400.
Thanks for your support 🚀
Profits for all ✅
❗️ Updates on this idea can be found below 👇

USDCAD Bullish Swing SetupIdentify Fibonacci Support Levels
Use Fibonacci retracement to find key support zones such as the 0.382, 0.5, and 0.618 levels where price often reacts or reverses.
Wait for Reversal Confirmation
Enter only after confirming a trend reversal on the 1-hour chart using candlestick patterns (like engulfing or pin bars), RSI divergence, or a structure break.
Maintain RRR of 1:3
Plan every trade with at least a 1:3 risk-to-reward ratio for every 1% you risk, aim to gain 3%.
Follow Strict Risk Management
Never risk more than 2% of your account balance on a single trade. Adjust your lot size based on stop-loss distance to protect your capital.

USD/CADPrice is in a bullish trend, forming higher highs and higher lows. Currently, price is pulling back to create a higher low. Entry planned at the Fibonacci 0.5 retracement area, with SL below the previous higher low and target at the next higher high. Risk:Reward 1:1

USDCAD analysis — set an alert.This pair wasn’t in our weekly watchlist, but the chart looks like it might provide an opportunity — or maybe not.
It’s not a bad idea to set an alert so we don’t miss it if a position becomes active.
If it manages to break the important resistance and hold above it, it would be a very good buying opportunity, as the resistance would be broken and we’d be trading in the direction of the trend.
USDCAD (50% Fibb) USDCAD is in bullish trend for the past 6 months. We want to be buyers of this trend until the trend changes (Easier said than done).
USDCAD is at the 50% Fibonacci from daily timeframe (low at 1.39 and high at 1.415).. The price is below the 20 daily SMA which means the price is cheaper than the past 20 days. Now price can keep going lower, but I believe the price right now is a decent buying opportunity.
RSI daily > 50 = longer term bullish
If price gets to 1.395, then it would be a screaming buy.

Long usdcad Long usdcad. I was expecting a reversal yesterday with a FVG but it appeared on the last candle of the day. That said, we'll be using the low of that candle as stop low and not the actual weekly lowest price so far. If candle moves below that candle, lower lows will be made
USDCAD BuyWaiting for price to pull back to my fvg for continuing to the upside. I would rather go for smaller pips than for it to reverse usua;;y 20 pips


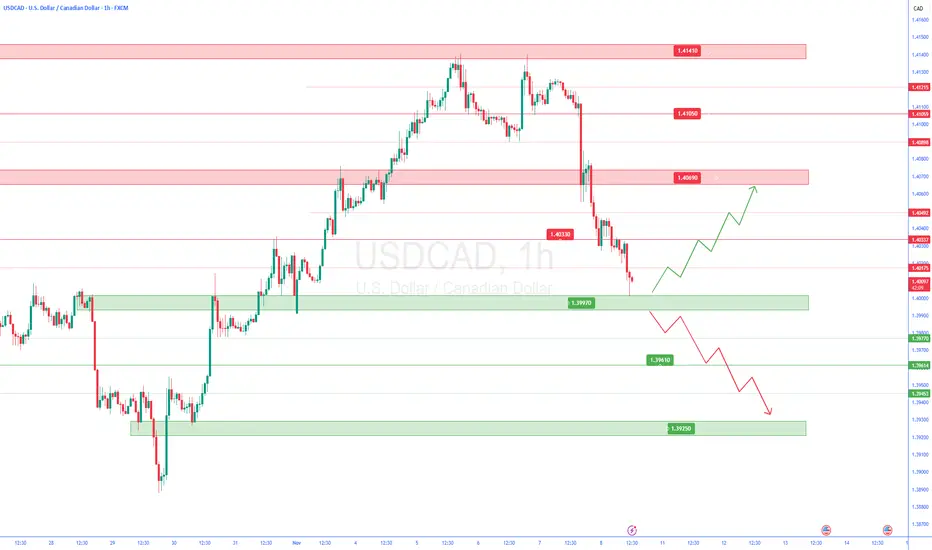
Bullish reversal?Loonie (USD/CAD) has bounced off the pivot and could rise to the 1st resistance, which acts as a pullback resistance.
Pivot: 1.4004
1st Support: 1.3947
1st Resistance: 1.4095
Disclaimer:
The above opinions given constitute general market commentary, and do not constitute the opinion or advice of IC Markets or any form of personal or investment advice.
Any opinions, news, research, analyses, prices, other information, or links to third-party sites contained on this website are provided on an "as-is" basis, are intended only to be informative, is not an advice nor a recommendation, nor research, or a record of our trading prices, or an offer of, or solicitation for a transaction in any financial instrument and thus should not be treated as such. The information provided does not involve any specific investment objectives, financial situation and needs of any specific person who may receive it. Please be aware, that past performance is not a reliable indicator of future performance and/or results. Past Performance or Forward-looking scenarios based upon the reasonable beliefs of the third-party provider are not a guarantee of future performance. Actual results may differ materially from those anticipated in forward-looking or past performance statements. IC Markets makes no representation or warranty and assumes no liability as to the accuracy or completeness of the information provided, nor any loss arising from any investment based on a recommendation, forecast or any information supplied by any third-party.
USDCAD weak!USDCAD has been moving down with a pull back in Asian session. Came in for about a 1:1 RR.

USD/CAD Reversal from Channel Resistance ContinuesUSD/CAD rates are continuing their reversal lower within their multi-month uptrend following last week’s Canadian jobs figures. Stronger than expected jobs growth in Canada has helped tamp down Bank of Canada (BoC) rate cut odds through the end of the year, while the prospect of Trump’s tariffs being struck down by the Supreme Court have likewise emboldened the Loonie. In the options market, Canadian Dollar futures are currently in the 48th percentile for volatility over the past year, highest among major USD-pairs.
In the above chart, USD/CAD rates have backed away from rising channel resistance, marked by the February 2025 swing low near 1.4151. The reversal in recent sessions is pushing the pair back into the area between the 20-day exponential moving average (EMA) and 50-day EMA, which proved itself as support at the end of October. A drop below the 100-day EMA would produce a break of the rising channel in motion since mid-June. At first blush, dip buyers may be in play closer to 1.3900 on a continued pullback.

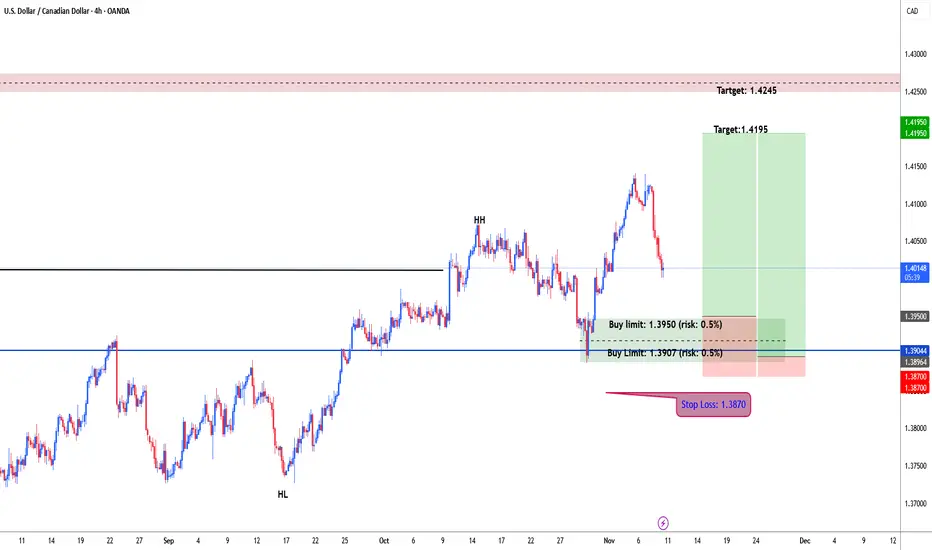
USDCAD possible bullish for 1.4195 & 1.4245#usdcad daily chart forming higher high and higher low. usdcad price broke and closed above 1.4016. wait for correction and test demand zone for another leg higher. i placed my orders at 1.3950 & 1.3906 each with 0.5% risk. stop loss: 1.3870. target: 1.4195 & 1.4245 as well.
USD/CAD Long Setup: Rejection + Volume Cluster Support @ 1.3954USD/CAD has a strong support at 1.3954 built from a classic rejection setup. A sharp pin bar and a heavy volume cluster show where aggressive buyers stepped in and reversed the sell-off. The level also aligns with the start of a bullish Fair Value Gap, adding extra strength. I’m waiting for a pullback to this zone, going long with a stop below the pin-bar low and a minimum 1:1 risk-reward.

usdcad 1h🔹 Overall Outlook and Potential Price Movements
In the charts above, we have outlined the overall outlook and possible price movement paths.
As shown, each analysis highlights a key support or resistance zone near the current market price. The market’s reaction to these zones — whether a breakout or rejection — will likely determine the next direction of the price toward the specified levels.
⚠️ Important Note:
The purpose of these trading perspectives is to identify key upcoming price levels and assess potential market reactions. The provided analyses are not trading signals in any way.
✅ Recommendation for Use:
To make effective use of these analyses, it is advised to manually draw the marked zones on your chart. Then, on the 15-minute time frame, monitor the candlestick behavior and look for valid entry triggers before making any trading decisions.
1.40 Psychologically important support.💵 Key Technical Levels
Level Type Comments
1.4250 📈 Resistance (supply zone) has seen strong selling in the past. This is where big sellers may be active.
1.41 ⚖️ Focal point in the current range market, where price is repeatedly reacting.
1.40 📉 Short-term support Psychologically important number, previously resistance, may now act as support.
50-day EMA ~1.3980 is further strengthening the support zone.

USDCAD📉 Current Outlook and Trade Setup
Primary Trend: Bullish (on the recent move).
Price Action: The price corrected after hitting the 1.41400 area and is now approaching a key support zone.
Proposed Strategy (Buy Setup): The expectation is for a bullish reversal from the key Support Zone (Entry Area), marked by the blue rectangle and red line (approximately 1.39950 - 1.40100).

USDCAD Breakout and Potential RetraceHey Traders, in tomorrow's trading session we are monitoring USDCAD for a buying opportunity around 1.40250 zone, USDCAD was trading in a downtrend and successfully managed to break it out. Currently is in a correction phase in which it is approaching the retrace area at 1.40250 support and resistance area.
Trade safe, Joe.
USDCAD PRICE IS FALLING!USDCAD is beginning to pullback after it attained the high of 1.41397 theres panic in buys but could this be a potential opportunity for a buy ? Or it’s a start of something new? From my point of view from the perspective of technical analysis and sentimental view, I believe USDCAD is till going to trade bullish therefore, a buy opportunity is envisaged.

USD/CAD Looking bullish from support area bullish breakout📈 USDCAD Technical Outlook 🇺🇸🇨🇦
USDCAD showing a strong bullish breakout above key resistance, signaling potential continuation in the uptrend.
Currently, buying opportunities look favorable around 1.40700 zone.
🎯 Technical Target: 1.41700
⏱ Time Frame: 1H
The breakout looks clean with solid momentum — watch for pullbacks toward support for possible long entries.
⚠️ Always use proper risk management and confirm signals before entering any trade.
💬 Like | 🔁 Share | 💭 Comment your view below!
#USDCAD #ForexAnalysis #PriceAction #TradingSetup #FXMarket #TechnicalAnalysis #BuyTheBreakout

Bearish drop off?The Loonie (USD/CAD) has rejected the pivot level, which is acting as pullback resistance, and could decline toward the overlap support that aligns with the 38.2% Fibonacci retracement.
Pivot: 1.4148
1st Support: 1.3911
1st Resistance: 1.4301
Disclaimer:
The above opinions given constitute general market commentary, and do not constitute the opinion or advice of IC Markets or any form of personal or investment advice.
Any opinions, news, research, analyses, prices, other information, or links to third-party sites contained on this website are provided on an "as-is" basis, are intended only to be informative, is not an advice nor a recommendation, nor research, or a record of our trading prices, or an offer of, or solicitation for a transaction in any financial instrument and thus should not be treated as such. The information provided does not involve any specific investment objectives, financial situation and needs of any specific person who may receive it. Please be aware, that past performance is not a reliable indicator of future performance and/or results. Past Performance or Forward-looking scenarios based upon the reasonable beliefs of the third-party provider are not a guarantee of future performance. Actual results may differ materially from those anticipated in forward-looking or past performance statements. IC Markets makes no representation or warranty and assumes no liability as to the accuracy or completeness of the information provided, nor any loss arising from any investment based on a recommendation, forecast or any information supplied by any third-party.

USDCAD - BUY - Daily TradingNow, USDCAD is indicating Strong Bullish Trend.
I will take adventure this trade.
I maintain keep buying even though it is dropped.
Daily Trading
SL : 1.388
TP1 : 1.42680
TP2 : 1.44400
Good Luck
