USDCAD | Waiting on Completion Before the Next Bullish Leg💱 Ticker: USDCAD
🧠 Description:
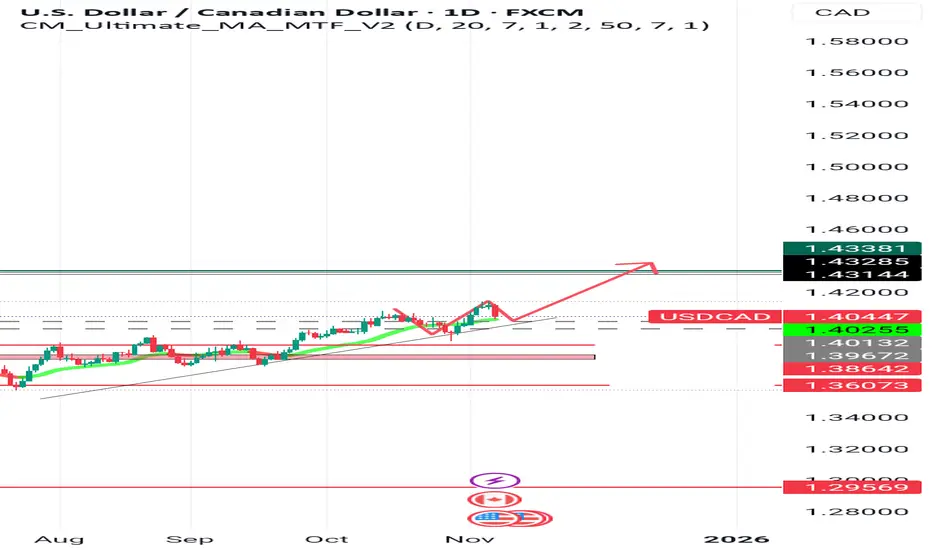
Higher timeframe structure remains bullish, with price climbing toward upper regions.
After identifying the overall HTF bias, I shifted to the mid-term timeframe to watch for bullish continuation zones.
Price recently swept previous sell-side liquidity, and now I’m watching for that massive drop to complete, allowing full mitigation of midterm order blocks before any continuation move.
Once that happens, I’ll drop to the lower timeframe to confirm whether price holds structure and aligns with smart money intent.
Until then, we wait and chill patiently, letting smart money reveal its direction.
🧩 Mindset Note:
Never rush clarity — structure always whispers before it speaks loud.
Trade ideas

USDCAD: trend reversal confirmed, swing position in playPrice broke the descending trendline and retested it, confirming a structural reversal. After the breakout, USDCAD formed a correction and tested the trendline again, creating a demand zone. Price holds above EMA 50 / EMA 100 and is heading toward EMA 200, which may act as resistance before further continuation. The current move forms a swing structure: correction completed inside Fibonacci 0.382–0.618 (1.3793–1.3972), and buyers continue to defend the trendline. A breakout above 1.4148 opens the path to the resistance zone at 1.4265 (target 1) and 1.4380 (target 2). Tactical plan: look for long entries after confirmation on lower timeframes. Invalidation: breakdown of the trendline and move below 1.3850.
USD remains supported by strong macro data and higher rate expectations from the Fed. CAD is under pressure due to weak oil momentum and a dovish stance from the Bank of Canada. Divergence in monetary policy supports bullish continuation in USDCAD.
The swing remains valid as long as the trendline holds. No need to predict tops. Follow structure, not emotions.

USDCAD Sell ModelSimple UCAD sell model for the upcoming week.
After some pretty steady price action to the upside last week, price finally decided to sell-off in what looks to be a continuation of the overall downtrend.

USD/CAD SHORTRed levels marked are sell zones.
Green levels marked are buy zones.
i see price has tested 4hr resistance (2wice) before this sell started. usually leads (falling knife)
theres a Fvg in the 4hr buy zone; which has just broken back above previous failed support; but hasnt been retested.

Bearish drop off?USD/CAD could rise to he resistance level, which is a pullback resistance and could reverse from this level to our take profit.
Entry: 1.4069
Why we like it:
There is a pullback resistance level.
Stop loss: 1.4139
Why we like it:
There is a swing high resistance level.
Take profit: 1.3982
Why we like it:
There is a pullback support level that aligns with the 61.8% Fibonacci retracement.
Enjoying your TradingView experience? Review us!
Please be advised that the information presented on TradingView is provided to Vantage (‘Vantage Global Limited’, ‘we’) by a third-party provider (‘Everest Fortune Group’). Please be reminded that you are solely responsible for the trading decisions on your account. There is a very high degree of risk involved in trading. Any information and/or content is intended entirely for research, educational and informational purposes only and does not constitute investment or consultation advice or investment strategy. The information is not tailored to the investment needs of any specific person and therefore does not involve a consideration of any of the investment objectives, financial situation or needs of any viewer that may receive it. Kindly also note that past performance is not a reliable indicator of future results. Actual results may differ materially from those anticipated in forward-looking or past performance statements. We assume no liability as to the accuracy or completeness of any of the information and/or content provided herein and the Company cannot be held responsible for any omission, mistake nor for any loss or damage including without limitation to any loss of profit which may arise from reliance on any information supplied by Everest Fortune Group.

USDCAD A possible Bullish Continuation Looking at a bullish continuation. The dotted lined area will have the Entry for the movements high.
USD/CADUSDCAD formed a bearish divergence along with a double top pattern.
Entry will be taken after the neckline break, with a 1:1 risk-to-reward ratio.

USDCAD – Daily Demand Re-Test (But Watch the Inducement Trap)USDCAD has tapped into a clean Daily demand zone after breaking structure to the upside.
The broader bias remains bullish, but this specific area sits in a risky place. A classic inducement zone where early buyers often get trapped.
The market may bounce here, but it can also dip slightly deeper to sweep the liquidity resting below the previous low before the real move unfolds.
Because the zone is drawn from the Daily timeframe, all confirmations must come from H1/M30 not lower.
What I need to see:
• H1/M30 bullish BOS
• Strong displacement
• Fresh refined demand for entry
Only then does the upside continuation toward 1.4266 activate.
This is a patience setup not an impulse setup.
Do you think this zone holds, or will USDCAD dip deeper before pushing up? Share your bias below
#USDCAD #Forex #TechnicalAnalysis #PriceAction #Liquidity #SmartMoney #FX #DailyChart #Trading #MarketStructure #OrderFlow #Imbalance #SwingTrading


USDCAD Is Very Bullish! Buy!
Here is our detailed technical review for USDCAD.
Time Frame: 1h
Current Trend: Bullish
Sentiment: Oversold (based on 7-period RSI)
Forecast: Bullish
The market is testing a major horizontal structure 1.404.
Taking into consideration the structure & trend analysis, I believe that the market will reach 1.407 level soon.
P.S
We determine oversold/overbought condition with RSI indicator.
When it drops below 30 - the market is considered to be oversold.
When it bounces above 70 - the market is considered to be overbought.
Like and subscribe and comment my ideas if you enjoy them!

USDCAD: Bullish Outlook Explained 🇺🇸🇨🇦
USDCAD is going to rise from a key daily support cluster.
A formation of a bullish imbalance candle after its test
suggests a strong buying interest.
Expect a bullish movement at least to 1.4074
❤️Please, support my work with like, thank you!❤️
I am part of Trade Nation's Influencer program and receive a monthly fee for using their TradingView charts in my analysis.

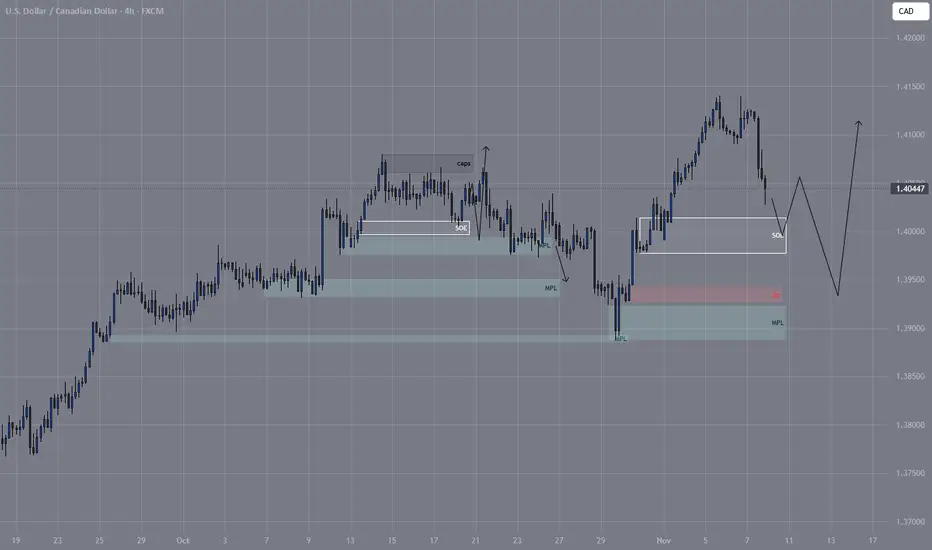
Uptrend in usdcadAccording to the previous analysis, the price started its upward movement exactly from the specified mpl range and reached the soe range. Currently, we expect the price to reach the dp range with a downward correction and start its upward movement again.
USDCAD SHORTHi every one
USDCAD in the channel
I draw the price movement
I hope price move like that

USD/CAD - Sell off ready🧭 Bias: Bearish correction incoming
After a strong bullish leg into higher-timeframe supply, USD/CAD looks primed for a deeper pullback before any continuation move.
🕰 Weekly Outlook
Context : Price just tapped into a weekly supply zone sitting inside the 1.41–1.42 range — exactly where previous sell pressure originated.
Structure : Market has completed a corrective move into the 71% retracement of the prior swing range (a key reversal zone).
Expectation : A rejection from this area could kick off a weekly distribution phase, with potential downside targeting 1.33–1.32 demand.
Key Level: 1.4140 – watch this as the “make or break” ceiling for the bears to defend.
⏱ 8H Technical Breakdown
Trend : Price broke short-term structure (BOS) after sweeping external buy-side liquidity — a classic liquidity grab setup.
Zones of Interest:
🔵 8H Supply: 1.4050–1.4100 — the rejection point confirming short-term bearish orderflow.
🟢 Demand Zone: 1.3920–1.3970 — potential retracement area before further drop.
Moving Average: Price rejected the 200 EMA, reinforcing bearish bias.
Projection: Expect a corrective retest into the 1.40 region before continuation down toward 1.38–1.37 (next demand zone).
⚖️ Risk Management
Maintain stops above 1.4150 (weekly high).
Consider scaling partials near 1.39 and 1.36.
A clean close above 1.42 invalidates the bearish setup.
🧩 Summary
USD/CAD just hit a big liquidity pocket up top 🧱 — signs point to exhaustion. If the 1.41 zone holds, we could be looking at a multi-week bearish correction toward 1.33. For now, watch for a retest into supply before taking the short ride down. 🚀⬇️

USDCAD - 4H - Uptrend - BUY SET UPUSDCAD Trend Analysis
Strong bullish uptrend (higher highs & higher lows).
Current price is pulling back after hitting short-term resistance near 1.4140 – 1.4160.
Stochastic is overbought and crossing downward → confirms pullback is beginning.
So we do not buy at the top.
We wait for price to retrace to support and then buy the dip.
Key Levels to Watch
Price Zone / Purpose
1.4140 – 1.4160 / Immediate resistance (where price rejected)
1.4030 – 1.4050 / Buy Zone (previous breakout & demand zone)
1.3920 / Major support (next demand area)
✅ Primary Trade Setup (Best Probability)
We buy the pullback into demand.
BUY LIMIT: 1.4030 – 1.4050
STOP LOSS: 1.3980
TAKE PROFIT 1: 1.4140
TAKE PROFIT 2: 1.4180 – 1.4200
Why This Setup is Strong
Trend = Bullish → We buy dips, not tops.
The 1.4030–1.4050 level was previous resistance, now becomes support → high probability retest zone.
SL is placed safely below structure → avoids stop hunts.
RR is clean 1:2 – 1:3.
Professional entry. Controlled risk. High probability continuation.
Optional Scalp Opportunity (Aggressive Traders)
If price drops deeper:
BUY AGAIN: 1.3920
SL: 1.3870
TP1: 1.4000
TP2: 1.4140
But the first setup above is the main trade.

USD/CAD — CHoCH Confirmation & Fair Value Gap FillUSD/CAD shows a clear Change of Character (CHoCH) after rejecting from the strong Sell Zone (1.4139).
The break in structure confirmed a short-term bearish shift, aligned with the fair value gap (FVG) retracement.
Key Details:
• Sell Zone: 1.4120 – 1.4140
• FVG: Filled on retest before continuation
• Target Zone: 1.3900 – 1.3880
• Risk/Reward Ratio: ≈ 3.17
If the structure holds, price may continue its correction toward the previous demand zone.
A clean invalidation would occur on a 4H close above 1.4140.
⚠️ Educational setup — not financial advice.
#USDCAD #PriceAction #CHoCH #FVG #SilentScalpers #Forex #SmartMoneyConcepts

USDCAD | Bearish ReversalCXY is improving while DXY is showing downtrend.Moreover,USDCAD chart is in sync with currency index and performing in accordance with the currencies.

USDCAD Technical Analysis! BUY!
My dear friends,
Please, find my technical outlook for USDCAD below:
The instrument tests an important psychological level 1.4071
Bias - Bullish
Technical Indicators: Supper Trend gives a precise Bullish signal, while Pivot Point HL predicts price changes and potential reversals in the market.
Target - 1.4090
Recommended Stop Loss - 1.4054
About Used Indicators:
Super-trend indicator is more useful in trending markets where there are clear uptrends and downtrends in price.
Disclosure: I am part of Trade Nation's Influencer program and receive a monthly fee for using their TradingView charts in my analysis.
———————————
WISH YOU ALL LUCK

possibility of downtrend Considering the price behavior in the current resistance level, possible scenarios have been identified. If the price breaks through the resistance level, the upward trend will likely continue.

USDCAD⬇️ Sell Entry: 1.41070
⏹️ Stop Loss: 1.41520
*️⃣ Take Profit-1: 1.40810
*️⃣ Take Profit-2: 1.40400
🔠 A test of the resistance line on the relative strength indicator (RSI) will signal a price decline. A rebound from the upper boundary of the Double Top reversal pattern will further confirm the decline. A strong rally and a breakout with a consolidation above 1.41520 will reverse the decline in the USDCAD pair. This will signal a breakout of the medium-term resistance area and continued growth with a target of 1.4305. At the time of publication of this forecast, we expect a corrective decline followed by consolidation below 1.40400 and the development of a downward momentum towards 1.39770.
USDCAD swing bull run continuations Harmonic Bullish pattern ABCD
TP last Higher high
then, 1.42864
Fibonacci level 0.5 good support level

