USD/CAD – Bullish ScenarioUSD/CAD – Bullish Scenario
Bias: Bullish, expecting upside continuation.
Current Structure: Price is holding above a key daily support level.
Plan:
As long as support holds, the bullish structure remains valid.
Look for bullish confirmations on lower timeframes — such as a fair value gap or a break of short-term highs.
First major upside target is the next daily resistance.
Extended target at the higher resistance zone if momentum is strong.
Invalidation: A daily close below support will void this bullish plan and require reassessment.
Summary:
Holding support and looking for bullish continuation toward the next resistance zone, with potential for further extension if momentum continues.
Trade ideas

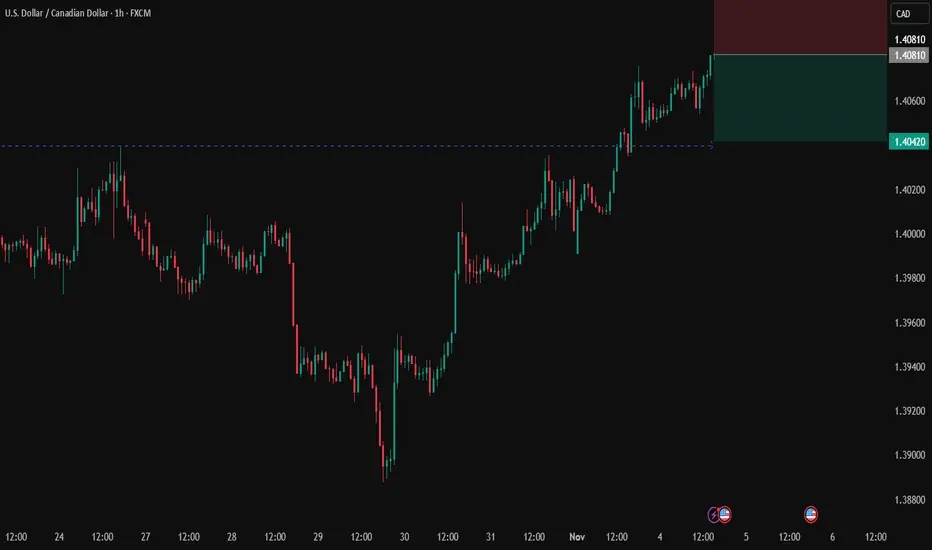
USDCAD H4 | Bullish Bounce off Key SupportUSDCAD is falling towards our buy entry at 1.407, which is a pullback support that aligns with the 23.6% Fibonacci retracement level.
The stop loss is at 1.404, which is a minor overlap support level, while the take profit is at 1.4135, which is a swing high resistance level.
Stratos Markets Limited (tradu.com/uk ):
CFDs are complex instruments and come with a high risk of losing money rapidly due to leverage. 68% of retail investor accounts lose money when trading CFDs with this provider. You should consider whether you understand how CFDs work and whether you can afford to take the high risk of losing your money.
Stratos Europe Ltd (tradu.com/eu ):
CFDs are complex instruments and come with a high risk of losing money rapidly due to leverage. 70% of retail investor accounts lose money when trading CFDs with this provider. You should consider whether you understand how CFDs work and whether you can afford to take the high risk of losing your money.

USDCAD - At ResistanceUSDCAD is just approaching a Resistance Cluster and completing the Butterfly Harmonic Pattern at 1.4146-1.4166. This is in line with the situation on EURUSD, GBPUSD and USDJPY.
I expect the price to perform a correction down to 1.3914 and then revert to uptrend.
Just my humble opinion

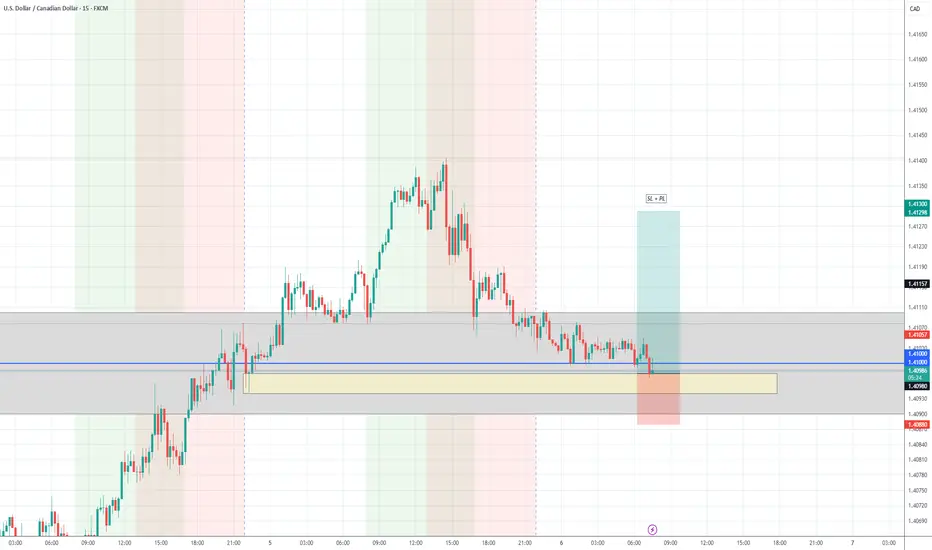
Trade analysis (SL + PL - Bullish Setup)The overall trend remains bearish, but since the market has reached the session low and P-line, a short-term bounce toward the take-profit (TP) area is likely. Once this minor correction plays out, the downtrend may resume, continuing the broader bearish momentum.
Why the US Dollar Dominates the Loonie?The USD/CAD pair trades near 1.4100, reflecting the US Dollar's (USD) persistent strength against the Canadian Dollar (CAD). This rally to seven-month highs stems from powerful structural and cyclical forces. We observe a widening monetary policy divergence and geopolitical uncertainty that favors the USD. Analyzing macroeconomics, fiscal policy, and trade reveals why the CAD struggles to sustain gains, despite positive Canadian data.
Geopolitics and Geostrategy: North American Trade Friction
Trade uncertainty directly pressures the CAD. Recent trade tensions with the US create significant CAD headwinds. Prime Minister Mark Carney apologized for an anti-tariff advertisement, but President Trump reportedly rejected resuming trade talks. This situation keeps bilateral trade risk elevated, undermining business confidence in Canada. US court proceedings over broad tariffs further inject political risk into the U.S.-Canada relationship, threatening key sectors like the auto industry.
The USD functions as the global reserve safe-haven anchor. Global investors gravitate toward USD assets during times of geopolitical friction. This geostrategic function offers the USD a structural advantage over the commodity-linked CAD, reinforcing the pair's upward momentum.
Macroeconomics: Diverging Rate Paths
The primary driver remains the widening interest rate differential. Strong US data bolsters the Federal Reserve's (Fed) hawkish stance. US ADP Employment climbed by 42,000 in October, reversing the prior decline. ISM Services PMI also rose to 52.4, exceeding forecasts. This resilience strengthens the USD.
The Fed maintains a cautious approach toward future rate cuts. CME FedWatch Tool data shows traders reduced the probability of a December Fed cut to 62% from 68%. Conversely, the Bank of Canada (BoC) has already cut its policy rate to 2.25%. Although the BoC signaled an easing cycle pause, markets focus on expected future divergence. This policy gap favors dollar-denominated assets, pushing the USD/CAD higher.
Economics and Fiscal Policy Headwinds
Canada's fiscal policy adds downward pressure on the CAD. The new Canadian budget projects the fiscal deficit will more than double this year. Deficit projections reach -2.5% of GDP for 2025/26 and -2.0% for 2026/27, representing material fiscal loosening. Markets interpret this spending as potentially inflationary without sufficient growth, weakening the CAD.
Furthermore, the CAD remains highly sensitive to crude oil prices. West Texas Intermediate (WTI) crude trades near $\$60.00$ per barrel, declining slightly. As a major oil exporter, softer energy prices negatively impact Canada's terms of trade and export revenue, directly pressuring the Loonie.
Technology and Patent Analysis: The Competitiveness Gap
Structural economic factors underpin the CAD weakness. Canada faces an ongoing competitiveness gap with the US, particularly in high-tech and innovation sectors. Persistent lower productivity growth in Canada compared to the US makes the Canadian economy less appealing for long-term capital investment.
The US economy demonstrates superior labor productivity growth and strong performance in advanced industries. This technology and innovation lag limits the CAD's potential for sustained appreciation. The US also benefits from acting as a "black hole" attraction for Canadian talent and intellectual property. This fundamental economic divergence provides structural support for the Greenback's long-term dominance.

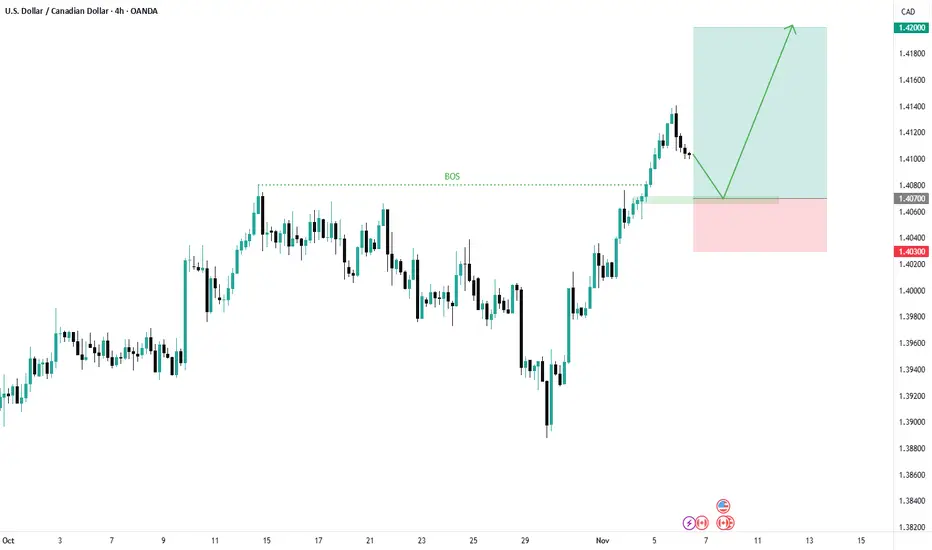
Possible Retracement Before Going HigherOANDA:USDCAD structure and confirming a clear Break of Structure (BOS) around the 1.4070 level. This breakout indicates that bullish order flow has taken control of the market.
Currently, price is showing a mild pullback towards the BOS retest zone, aligning with a potential demand area between 1.4060 – 1.4070. If buyers defend this zone, we could see a continuation toward 1.4160 and higher.
The overall market context remains bullish as long as the structure holds above 1.4040. A clean reaction from the highlighted zone could provide a high-probability long opportunity with a favorable risk-to-reward ratio.
USD/CAD – H4-Daily Supply Zone Reaction | Possible Short SetupPrice has reached a major resistance / supply zone (1.4140 – 1.4210) —
this area has previously caused strong rejections in the past.
If price fails to break and hold above this zone,
a bearish correction toward 1.3850–1.3820 (previous demand area) could follow.
⚙️ Example Trade Setup
Entry: 1.4120 – 1.4140
Stop Loss: 1.4215
Take Profit: 1.3830 / 1.3850
Bias: Bearish
Price could form a lower high on the daily structure.
"USD/CAD testing the daily supply zone ⚠️
#USDCAD #ForexAnalysis #PriceAction #SmartMoneyConcepts #DailyChart #SupplyZone #BearishSetup #FXTrader #TradingView"

USD/CAD) Bullish trend analysis Read The captionSMC Trading point update
Technical analysis of USD/CAD on the 4H t
Overall Concept
The analysis suggests a retracement entry before a continuation to the upside.
The market is currently bullish, respecting higher highs and higher lows.
The analyst expects a pullback into a discount zone (Fibonacci retracement) before a move toward the target point at 1.41464.
---
Technical Breakdown
1. Trend Context
Price is trading above both the 50 EMA (1.40120) and 200 EMA (1.39622) → confirming bullish momentum.
The strong impulsive bullish candles indicate institutional buying.
2. Key Levels
Current Price: 1.40843
Retracement Zone (Potential Buy Area): Between the 0.62–0.79 Fibonacci retracement levels (≈1.4060–1.4040).
Target Point: 1.41464
3. Fibonacci Tool
The retracement tool is drawn from the most recent swing low to swing high.
The blue shaded zone marks the discount entry zone, ideal for smart money re-entry after a short pullback.
4. Expected Move
Scenario: Price retraces to the 0.62–0.79 zone (liquidity sweep or mitigation of demand)
Then: A bullish continuation toward 1.4146 target level, which aligns with previous liquidity or imbalance area.
5. Volume & Confirmation
Volume is moderate (14.73K), supporting a healthy bullish push after correction.
Candlestick structure shows strong bullish impulses with minor pullbacks → confirming buyer control.
---
Trade Idea Summary
Bias: Bullish
Entry Zone: 1.4060 – 1.4040 (Fibonacci discount zone)
Stop Loss: Below 1.4020 (beneath previous structure)
Target: 1.4146
Risk-to-Reward (RR): Approximately 1:3 or better
Mr SMC Trading point
---
Confirmation to Watch
Bullish rejection candle or engulfing pattern within the blue zone
EMA 50 holding as dynamic support
Possible equal highs liquidity sweep near 1.4146 as the final take-profit zone
Please support boost 🚀 this analysis

STRONG BULLISH BREAKOUT IN USDCAD!Price developed a strong bullish trend breakout and has been maintaining its momentum for days now. I anticipate more bullish price action to develop away from the current market price. Therefore, a buy opportunity is envisaged.

USDCAD bullish breakout supported at 1.4080The USDCAD remains in a bullish trend, with recent price action showing signs of a breakout within the broader uptrend.
Support Zone: 1.4080 – a key level from previous consolidation. Price is currently testing or approaching this level.
A bullish rebound from 1.4080 would confirm ongoing upside momentum, with potential targets at:
1.4170 – initial resistance
1.4190 – psychological and structural level
1.4220 – extended resistance on the longer-term chart
Bearish Scenario:
A confirmed break and daily close below 1.4080 would weaken the bullish outlook and suggest deeper downside risk toward:
1.4070 – minor support
1.4050 – stronger support and potential demand zone
Outlook:
Bullish bias remains intact while the USDCAD holds above 1.4080. A sustained break below this level could shift momentum to the downside in the short term.
This communication is for informational purposes only and should not be viewed as any form of recommendation as to a particular course of action or as investment advice. It is not intended as an offer or solicitation for the purchase or sale of any financial instrument or as an official confirmation of any transaction. Opinions, estimates and assumptions expressed herein are made as of the date of this communication and are subject to change without notice. This communication has been prepared based upon information, including market prices, data and other information, believed to be reliable; however, Trade Nation does not warrant its completeness or accuracy. All market prices and market data contained in or attached to this communication are indicative and subject to change without notice.

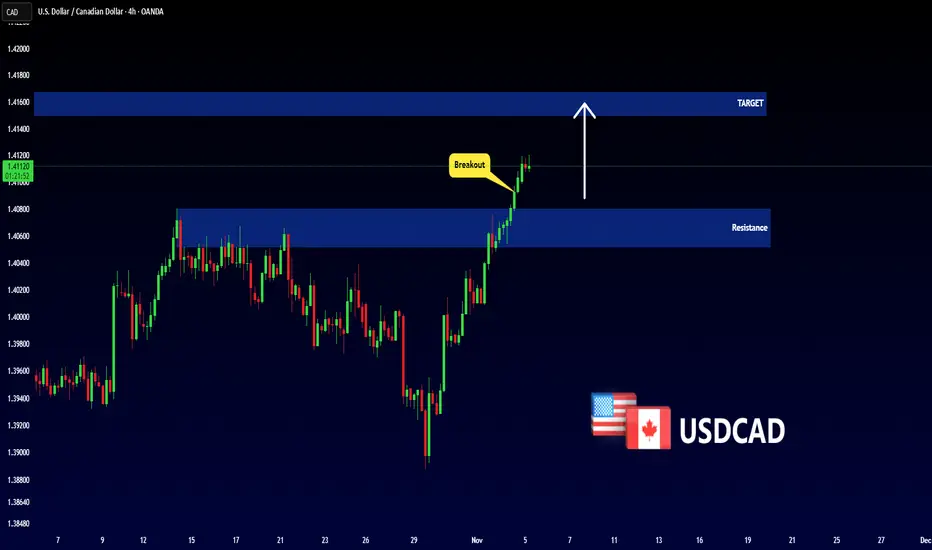
USDCAD Buildup to 1.4150Price has been building momentum after a steady climb, and now we’ve seen a clear breakout above this key resistance zone (now turned support).
This breakout shows buyers stepping in with conviction.
As long as price holds above the highlighted support, my bias would remain bullish, with the next upside target around 1.41500.

USD/CAD pair It's currently very bullish- the bullish trend currently feels very strong on this pair, I like it for a longer period of time cause USD It's getting bullish against other currencies and CAD shows quite week on the chart
- A very nice opportunity for the current month with adding new long positions after the corrections based on previous long trend
- After Wednesday rate cuts the USD will just continue to get stronger against the CAD and other currencies
let me know also your opinion in the comments bellow.

ABCHello traders — hope you’re doing great and stacking pips. Quick one on USDCAD: we’re working an ABC continuation. Price rejected the PCZ cleanly, reclaimed the 23.6% (right on the 200-SMA confluence), and is pushing toward TP1.
Pattern
ABC bullish continuation; CD advancing after a firm PCZ bounce.
Swings: A 1.37268 · B 1.40802 · C 1.38880.
Key Levels
PCZ: 1.39146 (100%) – 1.39500 (78.6%) → rejection confirmed.
23.6% / 200-SMA: ~1.39714 / 1.39716 now acting as support.
TP1 zone: 1.41658–1.42414 (78.6%–100%).

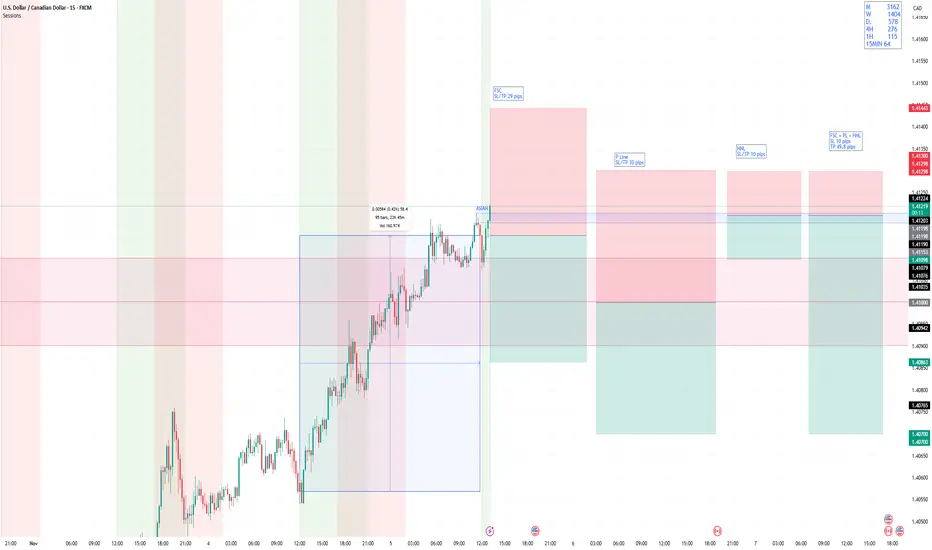
USDCAD Potential Short SetupCombo trade idea HNL + PL + FSC
1st confirmation: Price has moved 58+ pips for combined LDN + NY + ASIA session
2nd: Price is at ASIA session highs
3rd: Psychological Level
Entry: 1.41198
SL: 1.41298
TP: 1.40700
USDCAD - Important Breakout!Hello traders,
The USDCAD price has broken above the resistance zone (1.40518 – 1.40802), confirming a bullish breakout.
This key level is now acting as new support, indicating potential for further upside momentum 🚀
🎯 Target: 1.41500
USDCAD BUYYo fam, we are looking at USDCAD for a buy setup and yeah, I know what you’re thinking this pairs been messy the timing has been off on my half dozen short calls. But listen, the macro deck is stacked for a move up and if you get your filter right you might actually catch something while others are missing it. Keep in touch with me Dynamic take profit Dynamic Stoploss

USD/CAD Rips Through Critical Resistance- Bulls in ChargeThe Canadian Dollar remains under pressure, with USD/CAD ripping through key resistance to confirm a bullish breakout into the monthly open. The move keeps the June uptrend intact, with channel resistance now coming into view ahead of key U.S. and Canadian employment reports.
The rally has now extended into a fourth consecutive day with the advance breaking above confluent resistance into the November open. Initial weekly resistance is now in view at the February low at 1.4151, closely followed by the February close low at 1.4183. Note that channel resistance converges on these levels over the next few weeks and a breach / weekly close above would be needed to fuel the next leg of the advance. The next major technical consideration is eyed at 1.4292-1.4314- a region defined by the 2025 high-week close (HWC) and the 61.8% retracement of yearly range. Look for a larger reaction there IF reached.
Weekly support now rests at former resistance around 1.3978-1.4019. This confluence zone is defined by the 2022 swing high, the 52-week moving average and the 38.2% retracement. Note that the 2022 trendline converges on this region and further highlights the significance of this pivotal zone. USD/CAD needs to stabilize above this level for the June rally to remain viable with broader bullish invalidation now raised the 2022 HWC at 1.3881. A break / close below this threshold would be needed to suggest a more significant high is in place / a larger trend reversal is underway. Subsequent support seen at the 2025 low-week close (LWC) at 1.3734.
Bottom Line: USD/CAD has broken above pivotal resistance and keeps the outlook weighted to the topside into the monthly open. From a trading standpoint, losses would need to be limited to 1.3978 IF price is heading higher on this stretch. Look to reduce portions of long-exposure / raise protective stops on a rally towards channel resistance with a close above 1.4183 ultimately needed to fuel the next major leg of this advance.
-MB


USDCAD November 2025 fundamental analysisUnited States Dollar (USD): Cautious Strength Amid Economic Resilience
Monetary Policy: Fed's Hawkish Pause in Easing Cycle
The Federal Reserve delivered its second consecutive 25 basis point rate cut in October 2025, bringing the federal funds rate to a range of 3.75-4.00%, the lowest since 2022. However, the tone accompanying this decision was notably cautious. Fed Chair Jerome Powell emphasized that a December rate cut is "not a foregone conclusion," effectively pushing back against market expectations that had priced in an 87.7% probability of another 25bps reduction in October and 62% odds for December.
This hawkish messaging reflects the Fed's assessment of persistently elevated inflation, which has risen for five consecutive months and currently stands at 3.0% for both headline and core measures as of September. The central bank cited "increasing downside risks to employment" but noted that Powell explicitly stated he does not anticipate further deterioration in the labor market. The decision saw two dissenting votes—one favoring a 50bps cut and another preferring to hold rates steady—highlighting the divided nature of current Fed thinking.
Economic Fundamentals: Resilience Defying Expectations
The US economy has demonstrated remarkable resilience in the face of historically high tariffs (effective rate of 16-17%, highest since 1934) and a prolonged government shutdown exceeding five weeks. After contracting -0.6% in Q1 2025, GDP rebounded sharply to 3.8% in Q2, with Q3 tracking similarly strong at 3-4% according to the Atlanta Fed's GDPNow model. This growth is partly attributed to AI-related spending, which accounts for more than half of US growth this year.
However, the government shutdown—affecting 1.4 million federal employees with roughly half furloughed and half working without pay—poses growing risks. A rule of thumb suggests every week of shutdown shaves 0.1% off GDP. The lack of timely economic data due to the shutdown complicates the Fed's decision-making process, potentially supporting a cautious approach in November and December.
November Outlook: Dollar Strength with Caveats
For November 2025, the USD maintains a positive outlook supported by several factors. The relative economic resilience compared to other major economies, higher interest rate differentials (3.875% vs most G10 currencies), and ongoing safe-haven demand underpin dollar strength. However, this strength is tempered by the prolonged government shutdown, fiscal concerns, and the gradual Fed easing trajectory.
The dollar's performance will likely hinge on three key developments: resolution of the government shutdown, clarity on the December Fed decision, and the Supreme Court hearing on November 5 regarding the legality of tariffs imposed under the International Emergency Economic Powers Act. Market positioning shows the Dollar Index (DXY) holding above 98, with technical resistance at 99.75 representing a key threshold for sustained strength.
Canadian Dollar (CAD): Economic Headwinds and Continued Easing
Bank of Canada Policy
The Bank of Canada delivered another 25 basis point rate cut at its October 29 meeting, bringing the policy rate to 2.25%. This continues an aggressive easing cycle that has seen rates reduced by 225 basis points since June 2024, from a peak of 4.50% to the current 2.75%. Markets are pricing in current easing for the October meeting despite recent data showing 60,000 employment gains and headline inflation rising to 2.4%.
Economic Challenges
The BoC's dovish stance is driven by persistent concerns about the Canadian economic outlook. The third-quarter Business Outlook Survey showed that uncertainty around trade policy continues to weigh heavily on investment and hiring plans. The "future sales" indicator dropped back into negative territory for the first time in 2025, and 63% of firms expect either unchanged or reduced workforce levels—levels historically associated with unemployment rates of 7.3% or higher.
Canada's terms of trade have deteriorated significantly, with crude oil prices falling to multi-month lows. WTI crude is trading around $59-60 per barrel, down from earlier highs, removing a key pillar of support for the loonie.
November Outlook: Bearish
The Canadian Dollar faces a challenging November. USD/CAD has moved higher to the 1.40 handle, and while some analysts expect a return to 1.38 by year-end driven primarily by USD weakness, the path may be slow with potential spikes to 1.41. The loonie is expected to underperform against most G10 currencies, given the BoC's continued easing path and Canada's vulnerability to weak energy prices.
Verdict
For November 2025, the USD/CAD pair is fundamentally positioned as a BUY opportunity with an expected continuation of the upward trend. While minor corrections are possible, the overall dominant factors point towards further gains, making it favorable for long positions throughout November.

#USDCAD: Price to continue remain bullish! Let's wait and watchDear traders,
I hope you all are doing well.
The USDCAD pair has been extremely bullish since the CAD currency began to decline. We now have an excellent opportunity to rise, with the potential for the price to reverse in good time. This analysis is based solely on the current market conditions and price behaviour, so it may differ from your own views. The target is a swing, and you can adjust it according to your own analysis. Please use this analysis for educational purposes only.
Good luck and trade safely!
Team Setupsfx_

USDCAD Consolidation Selling Pressure re-emerging near the top USDCAD is showing signs of consolidation after recent gains, with selling pressure re-emerging near the top of the recent range. Price action indicates exhaustion around resistance, suggesting a potential short-term rejection and downside correction.
Crude oil prices have stabilized near the mid-$60s, providing some support for the Canadian dollar. Meanwhile, the Bank of Canada remains patient, balancing weak but steady domestic data. This cautious stance, combined with stable oil, adds to the likelihood of a pullback in USDCAD from current levels.
A rejection from resistance could lead to a correction toward 1.3955 initially, with a deeper move possible toward 1.3901 if momentum builds. While the broader trend remains supported, short-term price action favours sellers below 1.4060. A rejection from this zone could open room for a retracement toward the mid-1.39s, especially if oil maintains stability and USD momentum softens.
You may find more details in the chart.
Trade wisely best of Luck Buddies,
Ps; Support with like and comments for better analysis Thanks for Supporting.

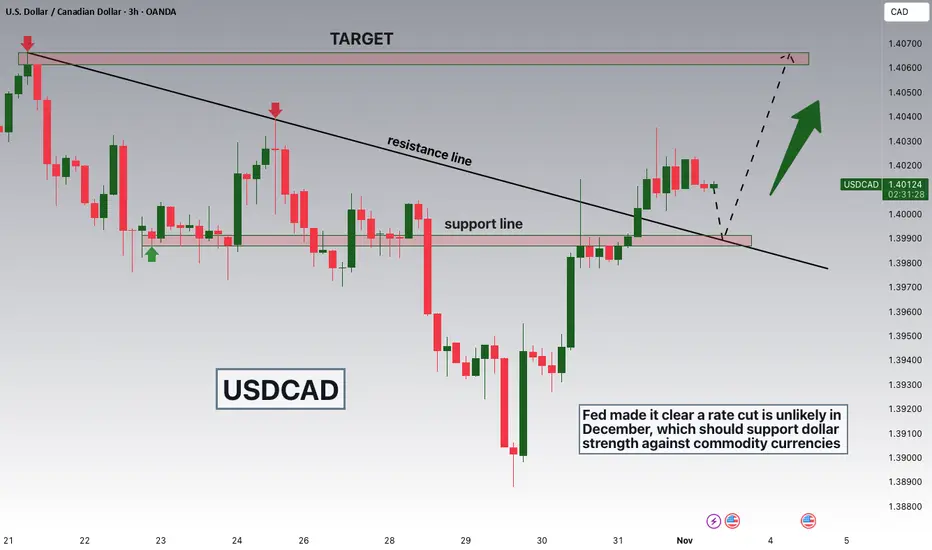
USDCAD Breakout and Potential RetraceHey Traders, in today's trading session we are monitoring USDCAD for a buying opportunity around 1.39900 zone, USDCAD was trading in a downtrend and successfully managed to break it out. Currently is in a correction phase in which it is approaching the retrace area at 1.39900 support and resistance area.
Fundamentally fed made it clear that a rate cut is unlikely in December which should strengthen the dollar against commodity currency!
Trade safe, Joe.