USDCAD Short term projectionWe have hit a major Resistance level on USDCAD, buyers seem to be loosing control.. let's watch how it plays out..
Trade ideas

USDCAD Technical Analysis! SELL!
My dear subscribers,
My technical analysis for USDCAD is below:
The price is coiling around a solid key level - 1.4067
Bias - Bearish
Technical Indicators: Pivot Points Low anticipates a potential price reversal.
Super trend shows a clear sell, giving a perfect indicators' convergence.
Goal - 1.4013
About Used Indicators:
By the very nature of the supertrend indicator, it offers firm support and resistance levels for traders to enter and exit trades. Additionally, it also provides signals for setting stop losses
Disclosure: I am part of Trade Nation's Influencer program and receive a monthly fee for using their TradingView charts in my analysis.
———————————
WISH YOU ALL LUCK

USDCAD buys continuation?USDCAD has been on a bullish trend for months. It broke a high and created traps for early buyers. We're simply waiting for price to sweep the liquidity and trigger our order.
USE PROPER RISK MANAGEMENT!
NO TRADE IS GUARANTEED!!!
USD/CAD Looking bullish breakdown bullish strong📈 USDCAD Analysis – Bullish Breakout Alert 🇺🇸🇨🇦
USDCAD has shown a strong bullish breakout — breaking out of the downtrend and key resistance zone, indicating solid momentum from the support area around 1.40300.
💹 Technical Outlook (1H Time Frame)
Support: 1.40300
Resistance Targets: 1.40600 / 1.40700
Bias: Bullish continuation expected if price holds above 1.4030
⚠️ Trading Tip:
Use proper risk management and confirm entries with your own strategy before executing any trade.
👍 Like • 💬 Comment • 🔁 Share
Stay disciplined, trade smart! 💼

USDCAD: Time For Correction 🇺🇸🇨🇦
There is a high chance that USDCAD will continue retracing
from the underlined blue resistance.
The price formed a double top pattern on that and violated
a support line of a rising channel with a bearish imbalance candle
after its test.
I will expect a down movement to 1.4047
❤️Please, support my work with like, thank you!❤️
I am part of Trade Nation's Influencer program and receive a monthly fee for using their TradingView charts in my analysis.

USD/CAD double top forming on daily.I am shorting to the second daily support. The news could change everything but I doubt it will get to SL

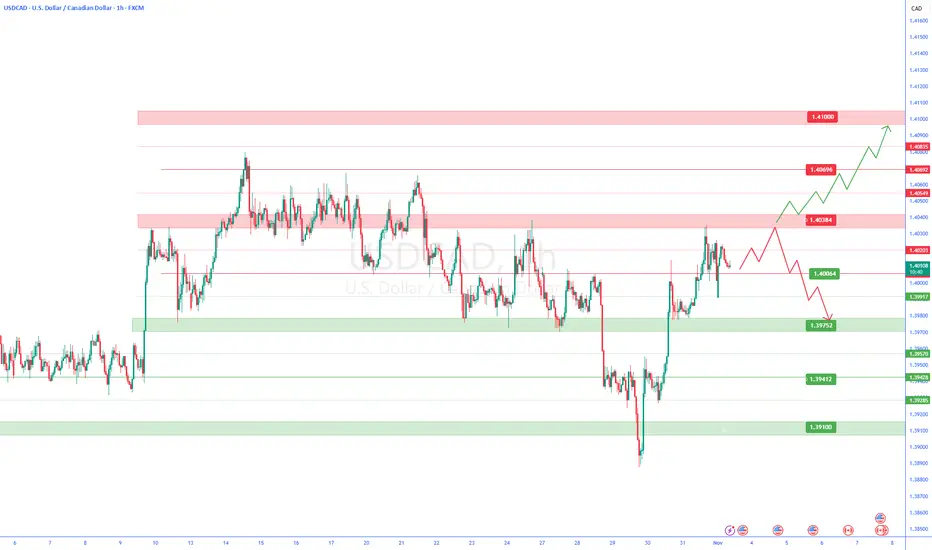
Loonie Weakens as Fed Cut Expectations Fade The Canadian dollar has been weakening against the US dollar, and signs suggest that this trend may continue as USD/CAD approaches a key level of resistance around 1.4070. This may be particularly true now that the market sees the odds of a Federal Reserve rate cut in December falling to below 70%, down from about 94% prior to last week’s FOMC meeting.
The two-hour technical chart shows USD/CAD breaking out of what appears to be a bull flag, suggesting further weakness in the Canadian dollar may lie ahead. If the USD/CAD can move above the top of the flagpole, which is currently acting as resistance, it could pave the way for a move towards 1.4150.
On the daily chart, the Canadian dollar is now trading firmly above its 10-day exponential moving average and appears to be showing positive momentum on the Relative Strength Index, which has been trending higher since forming a bullish divergence from early spring into mid-summer, alongside a triple bottom on the price chart.
Taken together, these factors suggest that the Canadian dollar may be on course to weaken even further, potentially beyond 1.4150, with USD/CAD possibly moving back towards the 1.43 area once this move has fully unfolded.
However, it should be noted that, with the US government currently shut down, there could be economic impacts that the market has not yet fully assessed. This means that if USD/CAD fails to break above 1.4070, the next significant support level may not emerge until around 1.3870.
Written by Michael J. Kramer, founder of Mott Capital Management.
Disclaimer: CMC Markets is an execution-only service provider. The material (whether or not it states any opinions) is for general information purposes only and does not take into account your personal circumstances or objectives. Nothing in this material is (or should be considered to be) financial, investment or other advice on which reliance should be placed.
No opinion given in the material constitutes a recommendation by CMC Markets or the author that any particular investment, security, transaction, or investment strategy is suitable for any specific person. The material has not been prepared in accordance with legal requirements designed to promote the independence of investment research. Although we are not specifically prevented from dealing before providing this material, we do not seek to take advantage of the material prior to its dissemination.

USDCAD LONG CALL📈 USDCAD Trade Breakdown | Start of the Week Setup
Kicking off the week with a structured USDCAD setup.
After a strong impulsive move, price formed a bullish pennant, consolidating above a key support zone before breaking out.
Confluences:
1️⃣ Breakout from the pennant pattern
2️⃣ Retest of structure support
3️⃣ Bullish continuation aligned with higher timeframe momentum
Targets set at TP1 (1.40347) and TP2 (1.40579) as the market builds bullish momentum.
Consistency and structure remain the focus — 💡
#Forex #TradingAnalysis #USDCAD #MarketStructure #FinanceCommunity #TechnicalAnalysis


USDCAD possible bullish for 1.4240#usdcad forming higher high & higher low i.e bullish trend continuation. Daily demand zone for another leg higher is 1.3948-3890. stop loss: 1.3875. target: 1.4240

USDCAD – 15M Chart: Waiting for the VMS AlignmentGood morning, we had a great October and we are looking forward to another great month for November. Here is a potential setup we spotted this morning.
USD/CAD had a strong impulsive move up, followed by a clear engulfing candle showing early signs of exhaustion.
Momentum is high, divergent and hooking down, signaling that buyers may be losing steam.
Now we’re waiting for volume to show strength over 75 to confirm the next move and complete the VMS alignment.
Until then — we stay patient and prepare, not predict.
#VMS #ForexAcademy #USDCAD #ForexTrading #AlignedExecution

USD/CAD Rejection Setup: Strong Support at 1.3899USD/CAD formed a strong support at 1.3899 based on a classic Rejection Setup. Buyers rejected lower prices, confirmed by a heavy volume zone and a small fair value gap. I’m watching this level for a pullback to go long, expecting buyers to defend it again.

USDCAD ideaUSD/CAD gains ground for the third successive session, trading around 1.4020 during the European hours on Monday. The technical analysis of the daily chart indicates a price consolidation, with the pair moving sideways within a rectangle pattern.

USD/CAD BEST PLACE TO SELL FROM|SHORT
Hello, Friends!
Previous week’s green candle means that for us the USD/CAD pair is in the uptrend. And the current movement leg was also up but the resistance line will be hit soon and upper BB band proximity will signal an overbought condition so we will go for a counter-trend short trade with the target being at 1.388.
Disclosure: I am part of Trade Nation's Influencer program and receive a monthly fee for using their TradingView charts in my analysis.
✅LIKE AND COMMENT MY IDEAS✅

USD/CAD BEARS ARE GAINING STRENGTH|SHORT
Hello, Friends!
We are now examining the USD/CAD pair and we can see that the pair is going up locally while also being in a uptrend on the 1W TF. But there is also a powerful signal from the BB upper band being nearby, indicating that the pair is overbought so we can go short from the resistance line above and a target at 1.396 level.
Disclosure: I am part of Trade Nation's Influencer program and receive a monthly fee for using their TradingView charts in my analysis.
✅LIKE AND COMMENT MY IDEAS✅

3 SESSION TRIANGLEtraingle consolidation build in 3 session in last hour of asia from closing price start move

usdcad 1h🔹 Overall Outlook and Potential Price Movements
In the charts above, we have outlined the overall outlook and possible price movement paths.
As shown, each analysis highlights a key support or resistance zone near the current market price. The market’s reaction to these zones — whether a breakout or rejection — will likely determine the next direction of the price toward the specified levels.
⚠️ Important Note:
The purpose of these trading perspectives is to identify key upcoming price levels and assess potential market reactions. The provided analyses are not trading signals in any way.
✅ Recommendation for Use:
To make effective use of these analyses, it is advised to manually draw the marked zones on your chart. Then, on the 15-minute time frame, monitor the candlestick behavior and look for valid entry triggers before making any trading decisions.
USDCADUSDCAD showing strength on the surface… but it’s tired underneath. ⚖️
Momentum’s faking confidence — the cracks are starting to show.
I’ve seen this kind of silence before the drop.
Not advice — just observation. 👁️📉

USD/CAD(20251103)Today's AnalysisMarket News:
Starting November 2nd, North America will begin observing winter time. Trading hours for US and Canadian financial markets (gold, silver, crude oil, US stocks, etc.) and the release times of economic data will be delayed by one hour compared to summer time.
Technical Analysis:
Today's Buy/Sell Threshold:
1.4008
Support and Resistance Levels:
1.4064
1.4043
1.4029
1.3986
1.3972
1.3952
Trading Strategy:
A break above 1.4029 could be a buy signal, with a first target price of 1.4043.
A break below 1.4008 could be a sell signal, with a first target price of 1.3986.

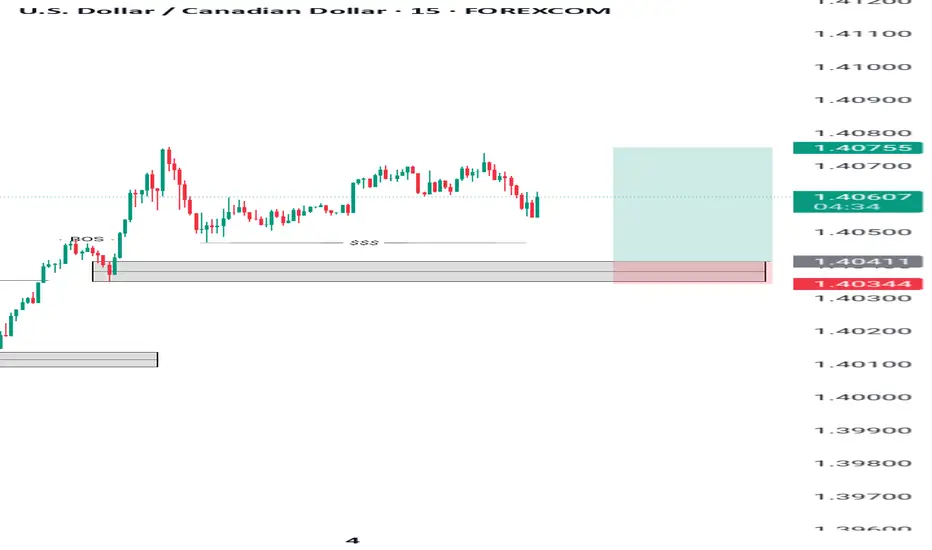
USDCAD SHORT -TERM SELL PROJECTION USDCAD has been creating some Supply and demand zones for months now and as we can see clearly on the chart, it is in a strong supply zone with confluence on the third touch on the downtrend line

Bulish bounce off?The Loonie (USD/CAD) has bounced off the pivot, which is a pullback support, and could rise to the 61.8% Fibonacci retracement.
Pivot: 1.3913
1st Suport: 1.3736
1st Resistance: 1.4259
Disclaimer:
The above opinions given constitute general market commentary, and do not constitute the opinion or advice of IC Markets or any form of personal or investment advice.
Any opinions, news, research, analyses, prices, other information, or links to third-party sites contained on this website are provided on an "as-is" basis, are intended only to be informative, is not an advice nor a recommendation, nor research, or a record of our trading prices, or an offer of, or solicitation for a transaction in any financial instrument and thus should not be treated as such. The information provided does not involve any specific investment objectives, financial situation and needs of any specific person who may receive it. Please be aware, that past performance is not a reliable indicator of future performance and/or results. Past Performance or Forward-looking scenarios based upon the reasonable beliefs of the third-party provider are not a guarantee of future performance. Actual results may differ materially from those anticipated in forward-looking or past performance statements. IC Markets makes no representation or warranty and assumes no liability as to the accuracy or completeness of the information provided, nor any loss arising from any investment based on a recommendation, forecast or any information supplied by any third-party.

USD/CAD | Bullish Continuation SetupBias: Bullish
HTF Overview (4H):
Price remains bullish on the higher timeframe, showing strong momentum and clear volume support. Buyers are controlling the structure, keeping the 4H trend intact.
MTF Overview (30M):
Mid-term setup shows inducement and sell-side liquidity being cleared. Price fell into the mid-term order block, confirming accumulation zones. Structure has been refined, mapping liquidity and identifying the areas where price is likely to react.
LTF Confirmation (5M):
Lower timeframe CHoCH occurred — break of lower highs confirming mid-term area control. Next, minor sell-side liquidity will be swept and nearest 5M order blocks mitigated to provide clean entry for continuation.
Execution Plan:
Stops placed below 5M structure. Targets: 5M highs → 30M highs → 4H highs depending on momentum and market delivery. If price fails the near order block, we’ll replot PD grid on higher timeframe to find the next valid entry zone before executing.
Trade Management:
Partial exit at first 5M high, second scale at 30M high. Trail stops below last 5M structural low. Full swing considered if momentum persists toward 4H highs.
Mindset Note:
Patience over speed — wait for structure to confirm. Losses are part of the process; smart money shows the path, we follow with discipline.
Progress Hook:
Each setup reinforces mapping and patience — tracking HTF → MTF → LTF ensures higher-probability trades and precision execution.
Tags:
#SMC #SmartMoneyConcepts #Liquidity #Inducement #OrderBlock #USDCAD #Forex #InducementKing

Im looking for buy setups.Those who are passionate about trading understand that it’s a tough business. What you must realize is that every market prediction—every call on price direction—is based on probabilities. There is no such thing as a 100% guaranteed outcome. The market can move against you at any time, for any reason. It might be triggered by geopolitical news, changes in oil production, a sudden war, or any number of unpredictable factors that can influence financial markets.
If you have one or more solid reasons to believe that the price will move in a certain direction, your job is to take a small, calculated position with a good risk-to-reward ratio—and then let the market decide.
A trader’s bias—whether bullish or bearish—can come from various sources: technical analysis, fundamental data, past price behavior, or simply well-observed market patterns. What matters most is understanding that the market is constantly evolving. Yesterday’s analysis may no longer apply today.
Remember, the market doesn’t have to follow your analysis. You have to follow the market—observe its shifts, adapt to its changes, and respond accordingly.
I hope this perspective helps some of you on your trading journey. Good luck!
