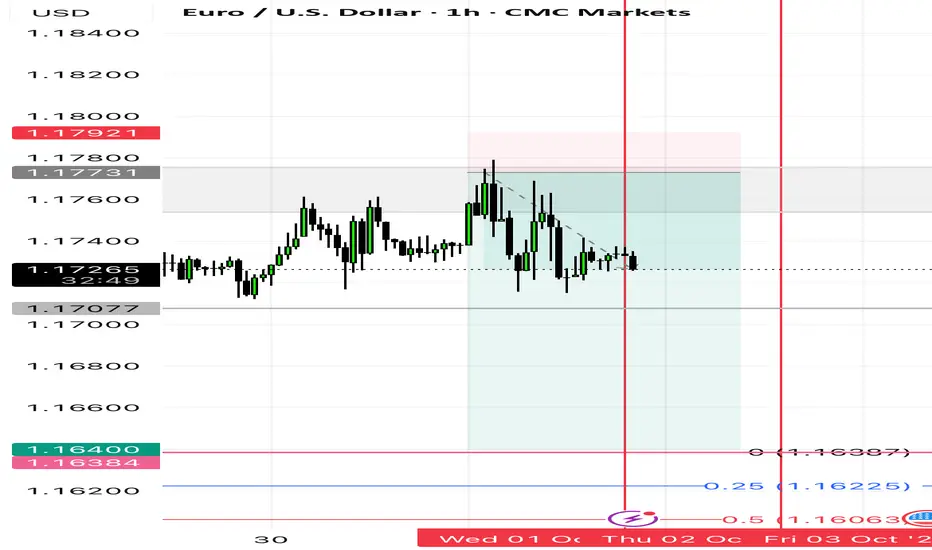
Long trade Trade Journal Entry
Pair: EURUSD
Trade Type: Buy-side trade
Date: Wed, 1st Oct 2025
Time: 7:00 am
Session: London Session AM
Trade Details
Entry: 1.17321
Profit Level (TP): 1.18481 (+0.70%)
Stop Level (SL): 1.17141 (-0.09%)
Risk-to-Reward (RR): 7.49
Market Structure & Context
Trend: Price rebounded from a corrective low and retraced into demand.
Fib Levels: 0.5 retracement zone (1.1730) supported entry.
Liquidity Context:
Previous day low sweep → liquidity taken.
Recovery into the demand block validated the bullish bias.
Confluence Factors:
FVG alignment with entry.
YDDO (yesterday’s daily open) is acting as support.
MA alignment points to bullish short-term momentum.
Narrative (Wyckoff / SMC)
Spring-like behaviour: Market swept liquidity below 1.1712 then bounced.
Displacement: Breakout from consolidation confirmed buyers’ strength.
Entry: Taken at equilibrium zone (1.1732) aligning with 50% retracement.
Target: Overhead liquidity at 1.1848.
Stop Placement: Beneath demand block (1.1714), protecting against structural break.
Key Levels
Entry Zone: 1.1730–1.1732
Stop: 1.1714
Target: 1.1848 (liquidity pool)
Intermediate Levels: 1.1760 / 1.1795
Action Plan
Take partials at 1.1760 (local structure break level).
Hold majority position in the 1.1848 liquidity pool.
If price retraces back to 1.1716, monitor for invalidation and potential flip scenario.
USDEUR trade ideas

EURUSDPreferably suitable for scalping and accurate as long as you watch carefully the price action with the drawn areas.
With your likes and comments, you give me enough energy to provide the best analysis on an ongoing basis.
And if you needed any analysis that was not on the page, you can ask me with a comment or a personal message.
Enjoy Trading ;)

EURUSD Bullish Correction Not DoneIndeed the overall bias is bearish for this market.
But if there is one thing I know about retests of these head and shoulder patterns is that sometimes price will insist on retesting either the right shoulder region or even the head.
Personally I am not looking to long the dollar just yet until one of those two highs I have drawn up have been taken.
Good luck for NFP everyone.

EURUSD: Bullish Trend In Play with Buy Opportunities on Pullback📊 EURUSD remains in a bullish trend, despite recently experiencing a volatile pullback with sharp moves both up and down ⚡.
🔎 Price action is now beginning to show signs of a bullish structure break 📈. My plan is to wait for a retracement, and from there, look for a buy opportunity as outlined in the video 🎯.
📈 The higher-timeframe bias stays bullish, so patience and confirmation will be key before engaging in the trade 🚀.
⚠️ Disclaimer: This analysis is for educational purposes only and not financial advice. Always trade responsibly and manage risk carefully.

EURUSDPreferably suitable for scalping and accurate as long as you watch carefully the price action with the drawn areas.
With your likes and comments, you give me enough energy to provide the best analysis on an ongoing basis.
And if you needed any analysis that was not on the page, you can ask me with a comment or a personal message.
Enjoy Trading ;)

EURUSD BULLSA lot of traders are anticipating sell direction, most have already sold at around 1.17700 zone. For me I still hold a bullish bias due to:
1. Although technical analysis leaves room to catch sells the pair still maintains an uptrend. Therefore, based on recent events claiming a US government shut down, conflicting views on rate cuts from Fed officials and NFP Lining up on Friday creating a risk on mood, I find it wise to sell towards NfP. Any lower than expected will confirm the bulls further and focus can shift to 1.192000 and later 1.20000. But higher than expected will mean that the Fed will keep interest rates steady and a reversal will be confirmed.

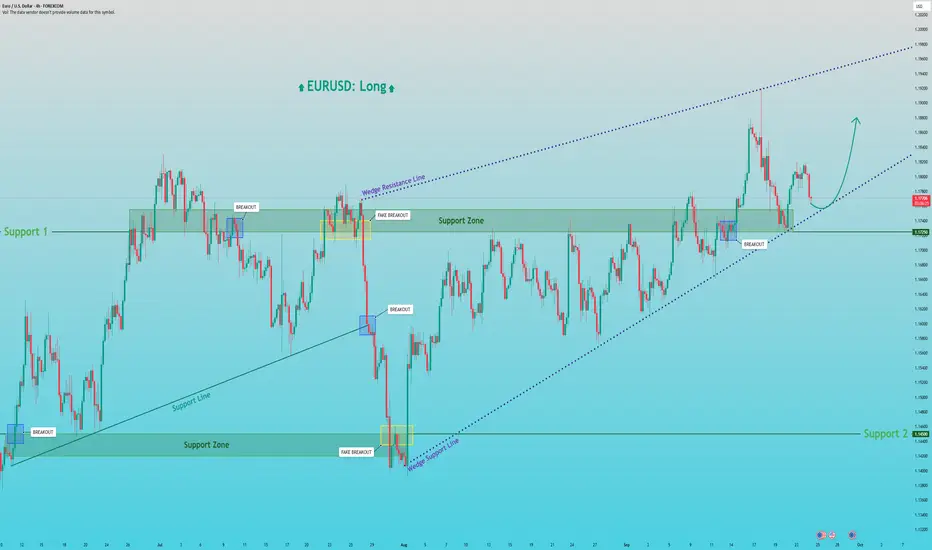
EURUSD: Rally from Wedge Support to 1.1880Hello everyone, here is my breakdown of the current Euro setup.
Market Analysis
A prior uptrend failed, leading to a sharp drop down to the major Support zone 2 around the 1.1450 level. However, strong buying pressure emerged from that low, initiating a powerful reversal and establishing the current market structure.
This new bullish phase has formed a well-defined Upward Wedge. The price successfully broke through Support 1 and tested the wedge's resistance. Currently, it's in a healthy corrective pullback and is testing the ascending support line of this wedge, which is a key area to watch.
My Scenario & Strategy
I'm looking for the price to complete its correction and find a solid floor on the ascending support line. A confirmed bounce from this dynamic support would be the key signal that the next impulsive move up is about to begin.
Therefore, the strategy is to watch for this bounce. A successful rebound would validate the long scenario. The primary target for the next wave higher is 1.1880, which would represent a new structural high within the Upward Wedge.
That's the setup I'm tracking. Thank you for your attention, and always manage your risk.
EUR/USD - High Volume Control🚨I am refining, evolving and still compacting the reporting. Getting there, hope it helps.
🚨In short - Price travels from Institutional high-volume area to high volume area FYI
🎯 KEY PIVOT
📍 Zone Type: SUPPLY ZONE
📊 Price Range: 1.17400-1.17500
📏 Distance: 83 pips above current price with rejection history
📊 MAIN BIAS
🔴Bias: BEARISH
📌 Context: Range-bound with supply overhead resistance
💎 DIAMOND EDGE - Primary Setup
🎲 Direction: Short from 1.17400-1.17500
🔍 Confirmations:
• Bearish rejection wick at or above 1.17400
• Break below 1.17350 with volume expansion
🎯 Targets:
• T1: 1.16900-1.17000
• T2: 1.16400-1.16500
🔄 BIAS FLIP SETUP🟢
⚡ Trigger: Break and close above 1.17500 with momentum
🎲 Direction: Long from 1.17500-1.17600
🔍 Confirmations:
• Strong breakout close above 1.17500
• Retest of 1.17500 as support holds
🎯 Targets:
• T1: 1.17800-1.17900
• T2: 1.18000-1.18100
⚠️ SESSION RULES
🕐 Trade high volume sessions only (NY/London overlap priority)
📰 Check economic calendar daily - high impact news creates volatility spikes
💡 Wait for price to reach supply zone - avoid chasing between levels

EURUSD is preparing for growth from trend support Correction after updating the maximum. The price is testing liquidity within the trading range, namely the point of maximum volume - the middle of the range.
The currency pair forms a false breakdown of the upward support line. A retest of the break-even zone at 1.1689 could be a starting point for growth.
The global trend is upward, the local trend is neutral, as the price is consolidating. However, the currency pair forms a false breakdown of the trend support...

FVG to fill on the monthly macro pressure Liquidity taken, daily FVG filled. Expected continuation in NY open tomorrow. 50% of position closed at 1.17300 for 1:2
Macro pressure 🔻
"Last stop before the drop?"On the 4H structure, we clearly see a developing bearish trend. The yellow box represents my Fibonacci retracement zone, which I call my 'Golden Zone.' Once liquidity from the left side has been swept, we could be in a position to take the short trade. I am currently in this trade and waiting for it to reach my 1-hour Demand Zone to exit. I'll read your thoughts.

EURUSDEURUSD: Potential Left Head and Right Shoulder on the 1H. We see how it respected the fair value gap and we see how the lower time frames like the 5M, 15M, 30M, all showed us rejection from the daily trend and on the fair value gap.
Also if price does end up forming the left head right shoulder the retest could potentially wick into the EMA

DeGRAM | EURUSD will retest the support level📊 Technical Analysis
● EUR/USD is rebounding from 1.1660 support, showing a potential reversal pattern within the broader ascending channel.
● A break above 1.1729 would confirm bullish continuation toward 1.1780, aligning with previous resistance levels.
💡 Fundamental Analysis
● Euro gains support from easing U.S. dollar demand after dovish Fed comments, while strong Eurozone PMI data underpins bullish momentum.
✨ Summary
EUR/USD defends 1.1660 support, eyeing 1.1729 breakout and 1.1780 as the next target. Medium-term outlook favors continuation of the uptrend.
-------------------
Share your opinion in the comments and support the idea with a like. Thanks for your support!

EURUSD Bearsih momentum, STRONG SELLWe have seen a false break on the EURUSD imperfect double top, followed by a sharp correction from the top. Then the price retest the broken TL right now. I see it as best opportunity to reentry or add a new sell position on EURUSD.
CHEEERRSSS...!!!

EURUSDPreferably suitable for scalping and accurate as long as you watch carefully the price action with the drawn areas.
With your likes and comments, you give me enough energy to provide the best analysis on an ongoing basis.
And if you needed any analysis that was not on the page, you can ask me with a comment or a personal message.
Enjoy Trading ;)

EURUSD: Bearish! Wait For Valid Sell Setups!After sweeping the old highs from 2021, price has cleared out the buy side liquidity.
The next move should be simply heading down to clear out the sell side liquidity at the lows.
Enjoy!
May profits be upon you.
Leave any questions or comments in the comment section.
I appreciate any feedback from my viewers!
Disclaimer:
I do not provide personal investment advice and I am not a qualified licensed investment advisor.
All information found here, including any ideas, opinions, views, predictions, forecasts, commentaries, suggestions, expressed or implied herein, are for informational, entertainment or educational purposes only and should not be construed as personal investment advice. While the information provided is believed to be accurate, it may include errors or inaccuracies.
I will not and cannot be held liable for any actions you take as a result of anything you read here.
Conduct your own due diligence, or consult a licensed financial advisor or broker before making any and all investment decisions. Any investments, trades, speculations, or decisions made on the basis of any information found on this channel, expressed or implied herein, are committed at your own risk, financial or otherwise.

EUR/USD Intraday Analysis – October 1, 2025Technical Overview:
EUR/USD is showing signs of a short-term bullish momentum after forming a corrective base near 1.1720. The price recently created a local high (point A) and is now undergoing a minor pullback (point B), suggesting a potential continuation toward the 1.1820 resistance zone (point C).
Key Levels:
Support: 1.1740 (short-term EMA support and minor consolidation zone), 1.1720 (stronger intraday demand)
Resistance: 1.1820 (previous swing high, potential target for wave C)
Price Action & Pattern Analysis:
The chart indicates a possible ABC bullish wave forming on the hourly timeframe.
Point A marks the recent high in the upward push. A minor retracement to point B could offer a low-risk entry for buyers targeting point C.
Trendlines confirm the continuation of the upward trend, aligning with EMA support zones.
Trading Strategy:
Long Scenario:
Enter near 1.1740 – 1.1750 on pullback (B)
Target: 1.1820 (C)
Stop-loss: Below 1.1720
Short Scenario:
Consider only if price breaks below 1.1720 decisively
Target: 1.1700 – 1.1680 (next support area)
Technical Indicators:
EMA: Aligns with pullback support, confirming short-term trend
RSI: Monitor for overbought signals near resistance at 1.1820
Fibonacci: Retracement from recent swing low supports 1.1740–1.1750 as a key entry zone
Summary:
EUR/USD shows a bullish continuation setup with a clear ABC pattern. Watch the pullback near point B for potential long entries targeting 1.1820. A break below 1.1720 could invalidate the bullish scenario.

EURUSD - Reading the Market Maker’s Hand> EURUSD Analysis
The market is strongly affected by various news events, but mathematical analysis always finds the signs and reads the market maker’s hand.
The previous analysis remains valid — we simply enjoy the current move.

EURUSD Is Going Up! Long!
Take a look at our analysis for EURUSD.
Time Frame: 6h
Current Trend: Bullish
Sentiment: Oversold (based on 7-period RSI)
Forecast: Bullish
The market is approaching a key horizontal level 1.173.
Considering the today's price action, probabilities will be high to see a movement to 1.181.
P.S
The term oversold refers to a condition where an asset has traded lower in price and has the potential for a price bounce.
Overbought refers to market scenarios where the instrument is traded considerably higher than its fair value. Overvaluation is caused by market sentiments when there is positive news.
Like and subscribe and comment my ideas if you enjoy them!

EURUSDI got into this trade earlier today. I believe price will target the 1.18180 area if momentum holds. So far, it's looking good. I've taken a lot of Ls lately, but I just need to keep going

EUR/USD – Short SetupAfter the demand from the last dealing range failed to create a new high, price confirmed weakness with a clear Lower Low, shifting the short-term bias to the downside.
Key Observations:
Shift in Bias: The inability of demand to sustain, followed by a Lower Low, confirms a change in market control.
External Supply Zone: Current retracement aligns with H1 external supply, providing an optimal risk zone for positioning shorts.
Premium Confluence: The 75% retracement (1.1775) overlaps with peak negative delta, reinforcing the distribution zone.
Objective Target: The immediate target is the VAL of the daily dealing range. The short-term H1 bearish structure is expected to conclude at the daily demand area.
Institutional Context:
The next institutional catalyst will be the COT release on 26/09/2025, which may validate speculative positioning aligned with this bearish momentum. Until then, execution remains anchored to objective structural shifts and fair value levels.

EUR/USD – Could We See a Push Into Supply Before a Drop?Looking at the 1H chart, price has been in a clear bearish sequence with lower highs and lower lows forming. Currently, EUR/USD is retracing upwards, and I’m watching the supply zone around 1.1827 – 1.1840 as a potential area of interest.
🔹 We have unmitigated supply sitting above, which could act as the last area to grab liquidity before sellers step back in.
🔹 If price reaches this zone, I’ll be looking for signs of rejection to potentially short back down toward lower demand levels.
🔹 However, the question remains: will buyers have enough momentum to push into that supply first, or do we roll over earlier?
👉 What do you think? Do we tag the supply before the next leg down, or does the bearish continuation kick in sooner?

The Day Ahead Non-Non-Farm-Payrolls day! Friday, October 3
Data releases:
UK September official reserves changes
France August industrial production
Italy September services PMI, August retail sales, Q2 deficit
Eurozone August PPI
Central banks:
Fed’s Williams and Jefferson speak
ECB President Lagarde, Sleijpen, Villeroy, Schnabel scheduled
BoE Governor Bailey speaks
This communication is for informational purposes only and should not be viewed as any form of recommendation as to a particular course of action or as investment advice. It is not intended as an offer or solicitation for the purchase or sale of any financial instrument or as an official confirmation of any transaction. Opinions, estimates and assumptions expressed herein are made as of the date of this communication and are subject to change without notice. This communication has been prepared based upon information, including market prices, data and other information, believed to be reliable; however, Trade Nation does not warrant its completeness or accuracy. All market prices and market data contained in or attached to this communication are indicative and subject to change without notice.
