Turning Losses into LessonsA losing trade isn’t failure — it’s feedback. I review my mistakes to improve my rules and mindset.
One of my rules is to take a maximum of three trades per week. This week I had already taken two, and both were losing trades. This reminded me of the importance of being grounded in my rules and setup framework. I was rather impatient this week, so I paused early this morning before looking at the charts and reviewed my rules and framework as my grounding.
I might have been too emotional within the two previous days. And honestly, life happens — learning to get back up matters most.
Losing is part of the journey. The key is to detach emotionally, learn objectively, and keep going.
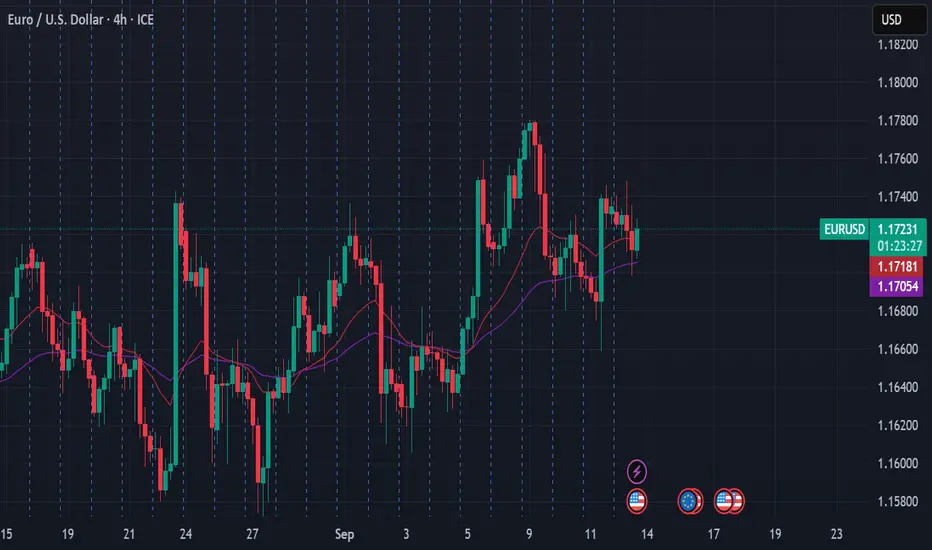
Today, I followed my rules and my setup framework. I waited for price to break below the support level at 1.1680. However, it hadn’t come back to retest and act as resistance for a sell entry.
USDEUR trade ideas
LIVE TRADE: EUR USD long, entry 1.1718It's another USD short trade, based on the 'multiple rate cut narrative'. The overall market mood remains positive and the US 10 YEAR is falling, coinciding with 'soft' consumer confidence data.
I've chosen the EUR to long, based on yesterday's neutral / mildly hawkish ECB and the divergence of US and EUR rate cut expectations.
Its a 20 pip stop loss with 20 pip profit target, this time the stop loss is behind 'nice 15min support'.
The risk to the trade is 'limp Friday price action'. Or simply USD strength.
If it's ongoing, I will close the trade before end of day to avoid weekend risk .

Monthly Forex Analysis: EUR/USD – Issue 210The analyst predicts that the EUR/USD rate will increase within the time specified on the countdown timer. This prediction is based on a quantitative analysis of the price trend
___Please note that the specified take-profit level does not imply a prediction that the price will reach that point. In this framework of analysis and trading, unlike the stop-loss, which is mandatory, setting a take-profit level is optional. Whether the price reaches the take-profit level or not is of no significance, as the results are calculated based on the start and end times. The take-profit level merely indicates the potential maximum price fluctuation within that time frame.

EURUSD : Status @ 10/09 (update)Let's continue what I discussed on 10/09. Now, I provide more details.
Perhaps many of you are discouraged when the price gives a false breakdown. Those who are easily discouraged should play something else.
I added two more 'trendlines' so that we can see more clearly how the price reacts to it. Which is why we need to pay attention to these lines.
This is the interesting part: 99.99% see a trendline at work. Perhaps only 0.01% see something else.
The next important line is 1.1730
One thing to remember is that the 'trendline' is pointing upwards. This affects how we trade, especially when executing the entry. One should know the pros and cons of selling in an upward 'trendline'
The red vertical line separates - when the line is below 1.1730, wait for a breakdown with 1.1730 as SL. When the line is above 1.1730 .........
So how would you trade this?
As of NOW, we can see two strong lines - the 'trendlines' and the horizontal 1.1730 line
I was saying that price might make a move before 17/09. Till then, expect volatility. If one can't handle volatility, do not play. But this setup above is very R/R friendly.
Trade wisely.
Good luck.

EURUSD 15M The trend on 1H is Bearish, i check on 15M we can open trade for a scalp to take a little profit

Really simple EUR/USD Range trade for Pre FOMC with solid R2RA1 Setup, I know everyone will be playing this but when they make it this simple why wouldn't you.
EUR/USD is stuck in a very tight range with no breaks above or below and I can see this continuing until FOMC where we're likely to see a huge move to the up or downside.
Short the top of the range and long the bottom of it on Monday. Simple - Trade is below.
Personally favouring down but for now, no need to worry about that.
Shorts from 1.1745 → SL 1.1760
TP 1.1710 / 1.1700
R2R - 3:1

EURUSD SELLERS ARE READY TO ROCKNROLL LOLEurusd we are breaking UP TREND and with the help of DIVERGENCE give me good case to take this SELL
My main target is 1.15374
My first TP @ 1.1691 (IF WE GET THERE)
Thanks and good luck

EUR/USD Asia liquidity set upHighs swept correlating with DXY lows swept we are targeting Asia low and liquidity below

Downtrend in EURUSDAfter stabilizing in the supply range, the price is currently trending down and has given its confirmations. I expect to enter the trade at the qml range to enter this trade.

EUR/USD BEARS ARE STRONG HERE|SHORT
Hello, Friends!
EUR/USD is making a bullish rebound on the 12H TF and is nearing the resistance line above while we are generally bearish biased on the pair due to our previous 1W candle analysis, thus making a trend-following short a good option for us with the target being the 1.157 level.
Disclosure: I am part of Trade Nation's Influencer program and receive a monthly fee for using their TradingView charts in my analysis.
✅LIKE AND COMMENT MY IDEAS✅

EURUSD after the newsYesterday, the ECB kept interest rates unchanged, while U.S. inflation data was released.
EURUSD bounced off the support zone and is once again moving toward a retest of the previous highs.
The next resistance levels are at 1,1766 and 1,1830.
Next week, the Fed’s interest rate decision will be announced, which will be a key driver for market movement.

What Is Systematic Risk and How May It Affect Markets?What Is Systematic Risk and How May It Affect Markets?
Systematic risk affects all traders, no matter the strategy or asset class. It comes from market-wide forces—like interest rates, inflation, or geopolitical shifts—that influence entire sectors at once. Unlike unsystematic risk, it can’t be avoided through diversification. This article breaks down what systematic risk is, how it’s measured, and how traders may incorporate it into their analysis.
What Is Systematic Risk?
Systematic risk refers to the kind of risk that affects entire markets or economies, rather than just individual assets. It’s the result of large-scale forces—like inflation, interest rates, central bank policy, geopolitical conflict, or economic slowdowns—that ripple through multiple asset classes at once.
A sharp rise in interest rates, for example, tends to push bond prices lower and can drag down equity valuations as borrowing costs climb and consumer spending slows. Similarly, during a global event like the 2008 financial crisis or the COVID-19 shock in 2020, almost all sectors saw simultaneous drawdowns. These events weren’t tied to poor management or bad earnings reports—they were macro-level shifts that hit everything.
Because it’s a largely undiversifiable risk, systematic risk is a key consideration for traders assessing overall market exposure. It often drives correlation between assets, particularly in times of stress. This is why equities, commodities, and even currencies can start to move in the same direction during periods of heightened volatility.
So, can systematic risk be diversified against? Only relatively speaking. Traders and investors may shift into defensive positions to limit potential drawdowns (e.g. gold, bonds, healthcare stocks vs tech companies). However, no matter how diversified a portfolio is, it remains exposed to this kind of risk because it’s tied to broader market movements rather than asset-specific events.
Note: systematic risk differs from systemic risk. The systemic risk definition relates to the potential collapse of the financial system, such as in a banking crisis. It is rare but severe.
Systematic vs Unsystematic Risk
Systematic risk is broad and market-driven. Unsystematic risk, on the other hand, is specific to a company or sector. It might come from a product failure, a major lawsuit, or a change in management. For example, if a tech company misses earnings due to poor execution, that’s unsystematic. If the entire sector drops because of a global chip shortage or policy change, that’s systematic.
Unsystematic risk can be reduced through diversification. Holding assets across industries may help spread exposure to isolated events. But systematic risk can’t be avoided by simply adding more assets. It affects everything to some extent.
That’s why traders track both systematic and unsystematic risk—understanding where their risk is concentrated and whether their exposure is tied to broad market movements or individual events. Clear separation of the two may help traders analyse potential drawdowns more accurately.
Key Drivers of Systematic Risk
Systematic risks tend to stem from structural or macroeconomic forces, and while they can’t be avoided, traders can track them to better understand the environment they’re operating in. Below are some of the most common types of systematic risk and how they influence market-wide movement.
Monetary Policy
Central banks play a huge role in shaping market conditions. When interest rates rise, borrowing becomes more expensive, which tends to slow down spending and investment. That usually puts downward pressure on risk assets like equities. Conversely, rate cuts or quantitative easing often lead to a surge in asset prices as liquidity improves.
Traders closely monitor central bank statements and economic projections, especially from institutions like the Federal Reserve, the Bank of England, and the European Central Bank.
Inflation and Deflation
Inflation affects everything from consumer behaviour to corporate earnings. Higher inflation can reduce real returns and push central banks to tighten policy. Deflation, though less common, signals weak demand and falling prices, which also tends to hurt equities. Commodities, currencies, and bonds often react sharply to inflation data.
Economic Cycles
Booms and busts are among the most well-known examples of systematic risk, influencing everything from job creation to earnings growth. During expansions, risk appetite tends to rise. In downturns, investors often shift towards defensive assets or cash. GDP figures, manufacturing data, and consumer spending are key indicators traders watch.
Geopolitical Risk
Elections, wars, trade tensions, and sanctions can drive sharp market reactions. These events introduce uncertainty, increase volatility, and can disrupt global supply chains or investor sentiment.
Market Sentiment and Liquidity
Panic selling or sudden shifts in positioning can cause assets to move together, even if fundamentals don’t support it. During liquidity crunches, correlations spike and markets can move sharply on little news. This is often driven by leveraged positioning unwinding or large institutions adjusting risk.
Measuring Systematic Risk
Systematic risk can’t be removed, but it can be measured, and that may help traders understand how exposed they are to broader market swings.
One of the most widely used tools is beta. Beta shows how much an asset moves relative to a benchmark index. A beta of 1 indicates that the asset typically moves in the same direction and by a similar percentage as the overall market. Above 1 means it’s more volatile than the market; below 1 means it’s less volatile. For example, a high-growth stock with a beta of 1.5 would typically move 15% when the market moves 10%.
Another approach is Value at Risk (VaR), which estimates the potential loss on a portfolio under normal market conditions over a specific timeframe. It doesn’t isolate systematic risk but gives a sense of how exposed the overall portfolio is.
Traders also watch the VIX—often called the “fear index”—which tracks expected volatility in the S&P 500. When it spikes, it usually signals rising market-wide risk.
More complex models like the Capital Asset Pricing Model (CAPM) use beta and expected market returns to price risk, but some traders use these tools to get a clearer picture of how exposed they may be to movements they can’t control.
How Traders May Use Systematic Risk in Analysis
Systematic risk isn’t just a background concern—it plays a direct role in how traders assess the market, structure portfolios, and manage exposure. By understanding how market-wide forces are likely to affect asset prices, traders can adjust their approach to reflect broader conditions rather than just focusing on technical analysis or individual names.
Position Sizing and Exposure
When systematic risk is elevated—during tightening cycles, political unrest, or global economic slowdowns—traders may scale back position sizes or reduce leverage. The aim is to avoid being caught in a correlated sell-off where multiple positions move against them at once. It's common to see increased cash holdings or a shift towards lower beta assets in these periods.
Asset Allocation Adjustments
Systematic risk also shapes how capital is distributed across asset classes. For example, during periods of strong economic growth, traders may lean into equities, particularly cyclical sectors. In contrast, during uncertain or contractionary periods, there may be a move towards defensive sectors, fixed income, or commodities like gold. Some rotate between assets based on macro trends to stay aligned with the dominant forces driving markets.
Macro Analysis and Scenario Planning
Understanding systematic risks may help traders prepare for potential market reactions. A trader can analyse upcoming interest rate decisions, inflation prints, or geopolitical tensions and assess which assets are likely to be most sensitive. If recession risk increases, they may expect higher equity volatility and reassess exposure accordingly.
Correlation Tracking
As systematic risk rises, correlations between assets often increase. Traders who normally count on diversification may find their positions moving together. Keeping track of these shifts may help reduce false confidence in portfolio structure and encourage more dynamic risk controls.
Systematic Risk: Considerations
As mentioned above, systematic risk is mostly unpredictable and fully unavoidable. There are some other things you should consider when trying to analyse it. Here are a few points traders often keep in mind:
- Lagging indicators: Metrics like GDP or inflation are backwards-looking. Markets often react before the data confirms the trend.
- False signals: Beta, VaR, and the VIX can be useful, but they’re not foolproof. A low VIX doesn’t guarantee calm markets, and beta doesn’t account for real market conditions.
- Uncertainty around timing: Even if the presence of risk is clear, the timing and severity of its impact are hard to analyse with precision.
- Overreaction risk: Markets can price in fear quickly, and traders may misjudge whether a reaction is justified or temporary.
- Diversification assumptions: Assets that usually behave differently may move in sync during stress. Risk models can underestimate this.
The Bottom Line
Systematic risk is unavoidable, but understanding how it moves through markets may support traders in making decisions. By tracking macro drivers and adjusting positions accordingly, traders may respond with more clarity during volatile periods. However, it is important to take into account all the difficulties that systematic risk brings.
FAQ
What Is Systematic Risk?
Systematic risk refers to the type of risk that affects an entire market or economy. It’s driven by macroeconomic forces such as interest rates, inflation, economic health, and geopolitical events. Because it impacts broad segments of the market, systematic risk cannot be eliminated through diversification.
What Is Systematic Risk vs Unsystematic Risk?
Systematic risk is market-wide and linked to broader economic conditions. Unsystematic risk is asset-specific and tied to events like company earnings, leadership changes, or industry developments. According to theory, unsystematic risk can be reduced by holding a diversified portfolio, while systematic risk remains even with strong diversification.
What Are the Five Systematic Risks?
The main categories include interest rate risk, inflation risk, economic cycle risk, geopolitical risk, and currency or exchange rate risk. Each can affect multiple asset classes and contribute to broad market shifts.
Can You Diversify Systematic Risk?
No. While diversification may help reduce unsystematic risk, systematic risk affects most assets. It might be managed, not avoided.
This article represents the opinion of the Companies operating under the FXOpen brand only. It is not to be construed as an offer, solicitation, or recommendation with respect to products and services provided by the Companies operating under the FXOpen brand, nor is it to be considered financial advice.

movement continuityHello traders, my view on the following EUR-USD currency pairs is a possible upward continuation movement after touching the inefficiency region following an RSI breakout.

EURUSD: Local Bullish Bias! Long!
My dear friends,
Today we will analyse EURUSD together☺️
The market is at an inflection zone and price has now reached an area around 1.17137 where previous reversals or breakouts have occurred.And a price reaction that we are seeing on multiple timeframes here could signal the next move up so we can enter on confirmation, and target the next key level of 1.17255.Stop-loss is recommended beyond the inflection zone.
❤️Sending you lots of Love and Hugs❤️

EURUSD My Opinion! BUY!
My dear followers,
This is my opinion on the EURUSD next move:
The asset is approaching an important pivot point 1.1722
Bias - Bullish
Safe Stop Loss - 1.1714
Technical Indicators: Supper Trend generates a clear long signal while Pivot Point HL is currently determining the overall Bullish trend of the market.
Goal - 1.1741
About Used Indicators:
For more efficient signals, super-trend is used in combination with other indicators like Pivot Points.
Disclosure: I am part of Trade Nation's Influencer program and receive a monthly fee for using their TradingView charts in my analysis.
———————————
WISH YOU ALL LUCK

If break that level then hold Alrd told u guys buy from 1170 now come to BE and hold 1180 if break 1174 then exit the trade

eurusd short trade take this trade now
hope it hit the tp
its my trade not yours do your own considerations

EURUSD potencial swing long idea, 12.9.25We are long from yesterday news at 14:30, holding on BE.
Potencial to add into position,
if price come to our low yellow rectangle area at 1.1710 or lower.
USD news at 16:00
We are in clear up trend on 1H, 4H, D, W.
If we go to yellow rectangle dont enter as fast as you can,
but wait for clear reversal structure on lower TF.
Be patience! Quality over quantity!

EURUSD may break through the 1.183 resistanceOn the daily chart, EURUSD is trading within an upward trending channel, with short-term bulls holding the upper hand. Currently, focus on resistance near 1.183. A break above this level could lead to further gains. Above resistance is the 1.1900-1.2000 area. Currently, short-term support for EURUSD is around 1.1660.

10-08-2025 _ Short Term Bullish Idea _ EURUSD H41- Bullish Divergence on H4.
2- Followed by series of HHs and HLs.
3- We are looking for correction followed by a move to the upside.

EUR/USD And There's the TestWhile US CPI printed in-line with expectations, it was the jobless claims data that seemed to get the attention around the Dollar. But perhaps more important than that was the comment from Christine Lagarde, saying that disinflation appeared to be coming to a conclusion for the Eurozone economy. This is something that could press rate cut expectations out of Europe lower, and for the USD, this is important.
The Euro is a 57.6% clip in the DXY basket, so weakness in Euro is often a necessary ingredient for USD-strength and vice versa. And so far in Q3, both trends have been stalled, with USD grinding near supports and EUR/USD holding near resistance. I've posted about the EUR/USD setup multiple times as there was an open door for a turn in July that snapped back quickly in August. And then last week saw the build of two different bullish formations come to conclusion with a bull pennant and an inverse head and shoulders pattern.
Both patterns gave way to breakout after the NFP report last week and today sees the 1.1663 support level in-play, helping to lead to a bounce and a test of the longer-term Fibonacci level at 1.1748. This opens the door for bulls to make a move and if we are going to see USD breakdown scenarios, this seems to be an important variable to allow that to happen.
Next resistance in EUR/USD is at the 1.1830 swing high, after which it's all about the 1.2000 handle. As for fundamental drivers, next week brings the Fed and markets have heavily priced-in rate cuts out to the end of next year. - js

EURUSD 4H: Dual Scenario OutlookEURUSD 4H: Dual Scenario Outlook
The EURUSD pair is depicted on a 4-hour timeframe, trading within a well-defined ascending channel (light blue parallel lines) that has guided price action from April to September, indicating an underlying bullish trend over this period.
Several significant support and resistance zones are identified: a current '1st Resistance' (red band) where the price is currently testing, a 'Deciding Area' (grey band) which aligns with the channel's lower boundary, a 'Key Support' (green band), and a 'Long-term Support' (dark blue band).
The current price (1.17325) is critically positioned, actively testing the '1st Resistance' zone, which has previously acted as a ceiling for price action on multiple occasions.
Two potential scenarios are outlined: an immediate bullish move (upper dotted white line) targeting the upper boundary of the ascending channel around 1.2000 (indicated by the upper purple ellipse).
Alternatively, the second scenario (lower dotted white line) suggests a rejection from the '1st Resistance,' leading to a retracement down to the 'Deciding Area' (grey band) and the lower trendline of the ascending channel, around 1.1600 (indicated by the lower purple ellipse), before any potential further move.
Disclaimer:
The information provided in this chart is for educational and informational purposes only and should not be considered as investment advice. Trading and investing involve substantial risk and are not suitable for every investor. You should carefully consider your financial situation and consult with a financial advisor before making any investment decisions. The creator of this chart does not guarantee any specific outcome or profit and is not responsible for any losses incurred as a result of using this information. Past performance is not indicative of future results. Use this information at your own risk. This chart has been created for my own improvement in Trading and Investment Analysis. Please do your own analysis before any investments.

BUY EURUSD I'm expecting the market to retrace back to this level 1.16921 which will be our entry level.
