EURUSD Daily Forecast -Q3 | W37 | D11| Y25📅 Q3 | W37 | D11| Y25
📊 EURUSD Daily Forecast
🔍 Analysis Approach:
I’m applying Smart Money Concepts, focusing on:
Identifying Points of Interest on the Higher Time Frames (HTFs) 🕰️
Using those POIs to define a clear trading range 📐
Refining those zones on Lower Time Frames (LTFs) 🔎
Waiting for a Break of Structure (BoS) for confirmation ✅
This method allows me to stay precise, disciplined, and aligned with the market narrative, rather than chasing price.
💡 My Motto:
"Capital management, discipline, and consistency in your trading edge."
A positive risk-to-reward ratio, paired with a high win rate, is the backbone of any solid trading plan 📈🔐
⚠️ Losses?
They’re part of the mathematical game of trading 🎲
They don’t define you — they’re necessary, they happen, and we move forward 📊➡️
🙏 I appreciate you taking the time to review my Daily Forecast.
Stay sharp, stay consistent, and protect your capital
— FRNGT 🚀
FX:EURUSD
USDEUR trade ideas

EURUSD Daily Forecast -Q3 | W37 | D11| Y25📅 Q3 | W37 | D11| Y25
📊 EURUSD Daily Forecast
🔍 Analysis Approach:
I’m applying Smart Money Concepts, focusing on:
Identifying Points of Interest on the Higher Time Frames (HTFs) 🕰️
Using those POIs to define a clear trading range 📐
Refining those zones on Lower Time Frames (LTFs) 🔎
Waiting for a Break of Structure (BoS) for confirmation ✅
This method allows me to stay precise, disciplined, and aligned with the market narrative, rather than chasing price.
💡 My Motto:
"Capital management, discipline, and consistency in your trading edge."
A positive risk-to-reward ratio, paired with a high win rate, is the backbone of any solid trading plan 📈🔐
⚠️ Losses?
They’re part of the mathematical game of trading 🎲
They don’t define you — they’re necessary, they happen, and we move forward 📊➡️
🙏 I appreciate you taking the time to review my Daily Forecast.
Stay sharp, stay consistent, and protect your capital
— FRNGT 🚀

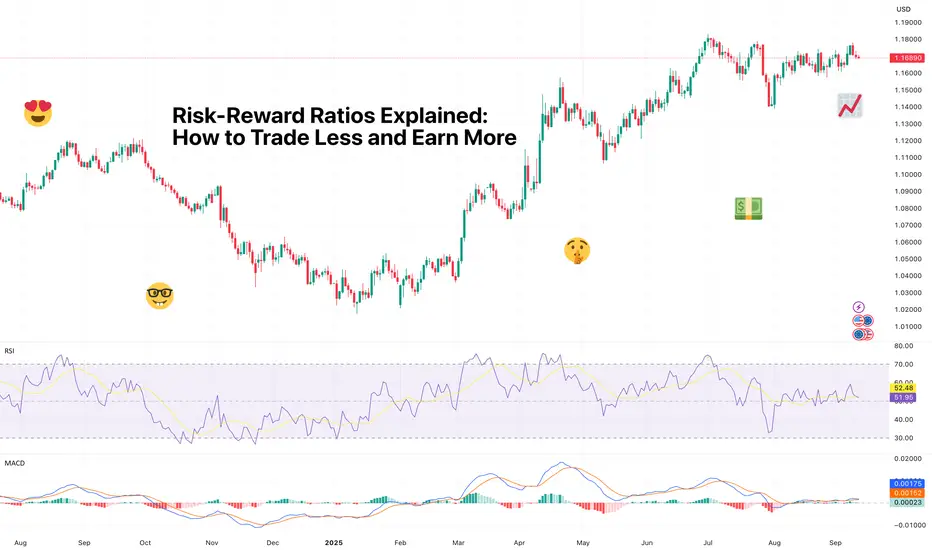
Risk-Reward Ratios Explained: How to Trade Less and Earn MoreIf you’ve been trading for a while, you’ve probably had one of those weeks where you take 15 trades, stress over every tick, barely sleep – and somehow, your P&L ends up red anyway.
Meanwhile, someone in your Discord chat casually posts their “one trade of the week” that banked more than your entire month.
The difference? They understand risk-reward ratios (unless they’re social-media influencers and have a course to sell). The ones that get risk-reward ratios right aren’t trading more, they’re trading less, better.
And that’s what we’re diving into today: how to use risk-reward to stop overtrading, focus on higher-quality setups, and finally give your capital the respect (and break) it deserves.
💡 What Risk-Reward Really Means
At its core, the risk-reward ratio (RRR) tells you how much you’re willing to lose compared to how much you aim to gain. But don’t let the simplicity fool you – mastering this concept separates the true traders from the exit liquidity.
Say you’re risking $100 to make $300. That’s a 1:3 risk-reward ratio – for every $1 on the line, you’re targeting $3 in return.
The beauty is, you don’t need to be right most of the time to make money. At a 1:3 ratio, you can lose six trades out of ten and still come out ahead. That flips the game from “I need to be right” to “I just need to manage risk.”
But, believe it or not, most traders do the opposite. They risk $300 to make $100, cut winners too early, and widen stops when trades go south. That’s not risk management; that’s donation season.
📐 Why This Isn’t Just About Math
Risk-reward ratios look clean on paper, but in real life, psychology can ruin everything.
Picture this:
You plan a beautiful 1:3 setup.
The trade starts working, you’re up 1R, and you panic.
You close early “just to lock in profits.”
If you’ve been around for a while, you’ve heard the saying “You never go broke taking profits.” True. But cutting winners early might mean missing out, hitting your goals slower or not hitting them at all.
Pro tip: once you’re up 1R, consider putting a stop at breakeven and let your take profit stay where you set it initially.
Because there’s a flip side, too. When trades go against you, emotions tell you to give it a little more room. You move your stop. Then you move it again. Suddenly, your carefully planned 1:3 trade becomes a 3:1 loser.
This is where discipline comes in. A risk-reward plan only works if you have the discipline to stick to it . Otherwise, you’re trading vibes, not setups.
🎯 The Sweet Spot for Most Traders
There’s no universal “best” ratio, but for most retail traders these setups work fine:
Day traders often aim for around 1:1 to 1:2
Swing traders typically prefer 1:3 to 1:4
Position traders can stretch to 1:5 or higher
Why? Higher timeframes give price more space to breathe. If you’re scalping, you can’t realistically aim for a 1:5 setup unless you enjoy watching charts like they’re Netflix and crying when spreads eat your edge.
But here’s where traders mess up: Instead of finding setups that naturally offer good ratios, they force them. They shrink stops to chase a flashy 1:6 RRR and end up getting wicked out by noise. Quality setups beat aggressive plays more often than not.
🚀 Asymmetric Risk-Return: The Home Run Setup
Let’s talk about asymmetric bets – trades where the upside massively outweighs the downside. Think 1:10, 1:15, or even 1:20 setups.
These are rare, but they’re game-changers when they hit.
Imagine risking $100 with a tight stop on a breakout setup. If price pops and you catch the move early, you could ride it for $1,500 or more. That’s a 15R trade – the kind that can pay for weeks, sometimes months, of smaller losses.
Here’s a recent example in FX:GBPUSD . The pair hit a double top in mid-August and immediately reversed, piercing the $1.3590 (a prior peak) by just 5 pips. Say you spotted that double-top formation and shorted with a 10-pip stop.
You’d survive the rise and then enjoy a 200-pip reward. That’s 20R in the bag, provided you exited right before the trend turned.
But here’s the trade-off:
You’ll get stopped out more often.
You need patience to let the winners actually run.
You have to accept discomfort – watching price retrace without panic-selling your position.
The market sharpshooters who master asymmetric setups don’t chase them every day. They stalk clean breakouts, major trend reversals, or high-conviction catalysts – and when the trade lines up, they size big, set a tight stop, and let the probabilities do the heavy lifting.
It’s less about being right every time and more about letting one big win offset multiple small losses.
🧩 Making Risk-Reward Work for You
Understanding ratios isn’t enough. You need a process:
Start with risk first
Decide how much you’re okay losing per trade – most pros cap it at 1–2% of account size.
Find logical stops, not emotional ones
Set stops based on structure – below support, above resistance, or at levels where your idea is simply wrong.
Set realistic targets
Don’t dream of 1:10 on a choppy Tuesday unless there’s a major catalyst to back it up.
Let math guide position sizing
Smaller stops mean larger position sizes for the same risk, but stay consistent with your capital exposure.
By planning before you enter, you flip the game from guessing to executing. That’s when risk-reward stops being theory and starts being strategy.
📈 Risk-Reward in Different Market Conditions
Markets change character, and your RRR should adapt too.
In strong trending markets , you can aim for bigger ratios since momentum carries trades further.
In range-bound conditions , scaling back to 1:1.5 or 1:2 makes sense – breakouts fail more often.
During news-heavy weeks , either widen stops or stay flat if you’re risk-averse. Chasing trades when Powell’s mic is on ? Risky business.
The smart traders bend their risk-reward ratios based on volatility instead of forcing the same plan everywhere.
🏖️ Trade Less, Profit More
Here’s the counterintuitive truth: the fewer trades you take, the more money you’ll likely make. In other words, less is more.
Focusing on high-quality setups with favorable RRRs means:
Less noise
Less overtrading
More time for actual analysis instead of gambling
You don’t need to catch every move. Stick to your RRR strategy, take care of the losses, and let profits take care of themselves.
🎯 The TradingView Edge
This is where tools make life easier:
Use Supercharts to visualize risk-reward zones before you enter.
Once inside a chart, navigate to the left-hand toolbar and spot the icon where it says Projection . Pick Long position for long risk-reward ratio, and Short position for short risk-reward ratio. Here’s a helpful tutorial in case you need some guidance.
Set alerts at key levels so you’re not glued to your screen.
Scan with screeners to find setups with volatility and structure that match your target ratios. heatmaps can help, too.
And finally, check out the newest product we launched, Fundamental Graphs , allowing you to compare plenty of metrics across multiple companies (we’re talking earnings, cash flows, net income, revenue, all that good stuff).
👉 The Takeaway
Risk-reward ratios aren’t a thing to consider – they’re a pillar of profitable trading. You don’t need to predict the market perfectly; you need to structure your trades so that your wins pay for your losses, and then some.
For most traders, the shift is simple:
Stop chasing every setup.
Start filtering for trades where the upside dwarfs the downside.
And when you get the rare asymmetric winner, ride it like your P&L depends on it – because it does.
Off to you : What’s your RRR strategy? Are you a defensive player or you’re chasing the asymmetric trades? Share your approach in the comments!
EUR/USD has been trapped in a sideways rangeEUR/USD has been trapped in a sideways range over the past few weeks, showing choppy, back-and-forth price action. However, the recent break above the descending trendline suggests that a potential bullish breakout may be underway. After a period of short-term consolidation, the pair could regain upward momentum and test key resistance levels.
Currently, the euro is trading around 1.1700 as traders await Thursday’s European Central Bank (ECB) meeting and upcoming U.S. inflation data for direction on future monetary policy.
ECB policymakers are widely expected to keep interest rates unchanged for a second consecutive meeting. This cautious stance comes amid ongoing trade uncertainties and eurozone inflation remaining at the target level for the third straight month.
The outcome of these events will likely influence the next major move in EUR/USD, with stronger U.S. inflation potentially supporting the dollar, while a dovish Fed or hawkish hints from the ECB could fuel further gains in the euro.
if the price will react in our favour then next Resistance zone 1.18500.
You may find more details in the chart.
Trade wisely best of luck.
Ps; Support with like and comments for better analysis.

EURUSD - The Heat Is Still OnHello everyone, what do you think about the trend of FX:EURUSD ?
Today, EUR/USD is experiencing a slight pullback, currently hovering around the 1.169 level after approaching the resistance at 1.177. The first target is aimed at the support zone near 1.163, following a violation below the two EMA lines.
Economic factors from both the Eurozone and the US continue to significantly influence this currency pair's movement. Recent data shows downward pressure on the USD as expectations for a Fed policy easing are being priced in, which continues to support bullish momentum for EUR/USD.
However, from a technical perspective, we expect EUR/USD to slightly correct toward the 1.163 support level before the uptrend resumes.
What do you think? Is this a good opportunity for traders to look for new buying positions? Please share your thoughts in the comments and don’t forget to like the post if you agree with my view!

Gold Backing worldwidePart 1: The Origins of Gold as Money
Ancient Civilizations
Gold was used by Egyptians as early as 2600 BCE for jewelry, trade, and as a symbol of wealth.
In Mesopotamia, gold was valued as a unit of exchange in trade agreements.
Ancient Greeks and Romans minted gold coins, which spread across Europe and Asia.
Gold as Universal Acceptance
Because of its rarity, durability, and divisibility, gold became the universal standard of value across cultures. Unlike perishable goods or barter items, gold retained value and was easily transferable. This laid the foundation for gold to back economies centuries later.
Part 2: The Rise of the Gold Standard
19th Century Development
The classical gold standard emerged in the 19th century. Countries fixed their currencies to a certain amount of gold, ensuring stability in exchange rates. For example:
Britain officially adopted the gold standard in 1821.
Other major economies — Germany, France, the U.S. — followed by late 19th century.
How It Worked
Governments promised to exchange paper currency for a fixed quantity of gold.
This restrained governments from printing excessive money, keeping inflation low.
International trade was simplified because exchange rates were fixed by gold parity.
Benefits
Stability of currency.
Encouraged trade and investment.
Limited inflation due to money supply constraints.
Drawbacks
Restricted economic growth during crises.
Countries with trade deficits lost gold, forcing painful economic adjustments.
Part 3: Gold Backing in the 20th Century
World War I Disruptions
Most nations suspended the gold standard to finance military spending.
Post-war, many tried to return, but economic instability weakened confidence.
The Interwar Gold Exchange Standard
A modified version emerged in the 1920s, allowing reserve currencies (like the U.S. dollar and British pound) to be backed by gold.
This proved unstable and collapsed during the Great Depression.
Bretton Woods System (1944 – 1971)
After World War II, a new system was established at the Bretton Woods Conference.
The U.S. dollar became the anchor currency, convertible into gold at $35 per ounce.
Other currencies pegged themselves to the dollar.
This system created a gold-backed dollar world order where gold indirectly supported most global currencies.
Collapse of Gold Convertibility (1971)
In 1971, President Richard Nixon suspended gold convertibility (“Nixon Shock”).
Reasons: U.S. trade deficits, inflation, and inability to maintain gold-dollar balance.
This marked the beginning of fiat currency dominance.
Part 4: Gold’s Role in Modern Economies
Even though direct gold backing ended, gold remains vital:
1. Central Bank Reserves
Central banks worldwide hold gold as part of their foreign exchange reserves.
Provides diversification, stability, and acts as insurance against currency crises.
Major holders include the U.S., Germany, Italy, France, Russia, China, and India.
2. Store of Value & Inflation Hedge
Gold is a safe haven during economic or geopolitical crises.
Investors flock to gold when fiat currencies weaken.
3. Confidence in Currencies
Though fiat currencies are no longer backed by gold, the size of gold reserves adds credibility to a nation’s financial system.
4. Gold-Backed Financial Instruments
Exchange-traded funds (ETFs) backed by gold bullion.
Gold-backed digital currencies (such as tokenized assets on blockchain).
Part 5: Global Gold Reserves – Who Holds the Most?
According to World Gold Council data (2025 estimates):
United States: ~8,133 tonnes (largest holder, ~70% of reserves in gold).
Germany: ~3,350 tonnes.
Italy: ~2,450 tonnes.
France: ~2,435 tonnes.
Russia: ~2,300 tonnes (massively increased in past decade).
China: ~2,200 tonnes (increasing steadily to challenge U.S. dominance).
India: ~825 tonnes (also a large private gold ownership nation).
Smaller nations also hold gold as part of strategic reserves, although percentages vary.
Part 6: Regional Perspectives on Gold Backing
United States
No longer directly gold-backed, but U.S. gold reserves underpin the dollar’s strength.
Fort Knox remains symbolic of America’s monetary power.
Europe
The European Central Bank (ECB) and eurozone nations collectively hold significant gold.
Gold gives the euro credibility as a global reserve currency.
Russia
Increased gold reserves significantly to reduce dependence on the U.S. dollar amid sanctions.
Gold is a strategic geopolitical weapon.
China
Gradually building reserves to strengthen the yuan’s role in global trade.
Gold accumulation aligns with ambitions of yuan internationalization.
India
Holds large reserves at the central bank level and even larger amounts privately.
Gold plays a cultural, economic, and financial safety role.
Middle East
Gulf countries with oil wealth also diversify with gold reserves.
Some are exploring gold-backed digital currencies.
The Future of Gold Backing
Possible Scenarios
Status Quo – Fiat currencies dominate, gold remains a reserve hedge.
Partial Gold Return – Nations introduce partial gold-backing to increase trust.
Digital Gold Standard – Blockchain-based systems tied to gold reserves gain traction.
Multipolar Currency Order – Gold used more in BRICS or Asia-led alternatives to the dollar.
Likely Outcome
While a full gold standard is unlikely, gold’s role as a stabilizer and insurance policy will remain or even grow in uncertain times.
Conclusion
Gold backing has shaped global finance for centuries — from the classical gold standard to Bretton Woods and beyond. Although modern currencies are no longer directly convertible into gold, the metal continues to influence monetary policy, global reserves, and investor behavior. Central banks across the world still trust gold as the ultimate hedge against uncertainty.
In an age of rising geopolitical tensions, inflationary pressures, and digital finance, gold’s importance may even increase. Whether as part of central bank reserves, through gold-backed tokens, or as a foundation for regional trade systems, gold remains deeply woven into the fabric of the global monetary order.

Fundamental Market Analysis for September 11, 2025 EURUSDThe euro is getting support as the market has a calmer view on the Fed: investors expect gentler moves later this year, so the dollar doesn’t look as strong as it did in mid-summer. At the same time, the ECB avoids sharp statements: the regulator is acting cautiously and making sure eurozone inflation doesn’t re-accelerate. In this environment, the euro feels more confident and can slowly climb toward 1.18000.
The US remains the key risk: if inflation or jobs data comes in much stronger than usual, the dollar will rise quickly and the euro may pull back. For now, the backdrop is neutral-to-positive for the euro: fewer market fears, stable rate expectations, and no “hawkish” surprises from Frankfurt. That makes buying moderately justified with controlled risk.
Overall: absent a major upside surprise in US data and without tough signals from the ECB, the pair has a chance to edge higher from current levels. The 1.18000 target looks realistic in the near term, and the stop level helps keep the position under control.
Trade idea: BUY 1.17000, SL 1.16850, TP 1.18000

EURUSD Is Bearish! Sell!
Please, check our technical outlook for EURUSD.
Time Frame: 7h
Current Trend: Bearish
Sentiment: Overbought (based on 7-period RSI)
Forecast: Bearish
The market is approaching a significant resistance area 1.169.
Due to the fact that we see a positive bearish reaction from the underlined area, I strongly believe that sellers will manage to push the price all the way down to 1.163 level.
P.S
Please, note that an oversold/overbought condition can last for a long time, and therefore being oversold/overbought doesn't mean a price rally will come soon, or at all.
Disclosure: I am part of Trade Nation's Influencer program and receive a monthly fee for using their TradingView charts in my analysis.
Like and subscribe and comment my ideas if you enjoy them!

EURUSD awaiting newsToday at 1:15 PM (London), the ECB will announce its interest rate decision.
Just 15 minutes later, U.S. inflation data will be released.
These are key events that are expected to trigger strong market moves.
It’s advisable to reduce risk on all open positions and avoid opening new ones before the news.
Once the data is out, clearer entry opportunities will appear.


EURUSD MARKET OUTLOOK-H4 CHARTFrom the technical standpoint, EURUSD approached a resistant level from where we’re looking forward to seeing a sharp drop in EURUSD price. We can also see how the market was able to form a head and shoulder pattern which also suggest the sell idea. I’m sure we’re likely going to see some bearish move away from the resistant level.

EURUSDwave 2 expanded flat correction. the price might be looking for short then after the end of correction, longs are expected

LONG EURUSDWave 5 counting
Price will head to take extreme premium zone top
Created the Bull Trap at 1.174
Created the Bear Trap at 1.162
Drive Wave back up to take the extreme premium at 1.180
Goodluck

EU SHORTSlooking for something like this to play out on EU, PA appears to be heading down towards lower bands, plus my 7 years of touching my crystal ball have worked thus far :)

Bullish bounce?The Fiber (EUR/USD) is falling towards the pivot which is a pullback support that lines up with the 61.8% Fibonacci retracement and could bounce to the 1st resistance.
Pivot: 1.1676
1st Support: 1.1618
1st Resistance: 1.1772
Disclaimer:
The above opinions given constitute general market commentary, and do not constitute the opinion or advice of IC Markets or any form of personal or investment advice.
Any opinions, news, research, analyses, prices, other information, or links to third-party sites contained on this website are provided on an "as-is" basis, are intended only to be informative, is not an advice nor a recommendation, nor research, or a record of our trading prices, or an offer of, or solicitation for a transaction in any financial instrument and thus should not be treated as such. The information provided does not involve any specific investment objectives, financial situation and needs of any specific person who may receive it. Please be aware, that past performance is not a reliable indicator of future performance and/or results. Past Performance or Forward-looking scenarios based upon the reasonable beliefs of the third-party provider are not a guarantee of future performance. Actual results may differ materially from those anticipated in forward-looking or past performance statements. IC Markets makes no representation or warranty and assumes no liability as to the accuracy or completeness of the information provided, nor any loss arising from any investment based on a recommendation, forecast or any information supplied by any third-party.

Bullish SMT Signal at EURUSD & GBPUSDThere was an SMT signal on EURUSD and GBPUSD. EURUSD was targeting a strong order block, and it broke through the previous low, which acted as an inducement. The SMT provided additional confirmation of the strength and resilience of that order block.

EURUSD - DISTRIBUTION COMPLETEEUR/USD appears to have completed a distribution phase, with the UTAD (Upthrust After Distribution) aligning with the recent PPI release.
This event likely served as the final liquidity grab before a potential reversal. The rally and the distribution as a whole showed volume spikes without follow-through, reinforcing classic signs of distribution exhaustion.
Macro context supports this technical setup: while the U.S. economy is slowing, it's not collapsing—leaving room for hawkish repricing in a market currently dovishly priced for the Fed. On the other side, EURUSD is stretched, both technically and fundamentally, making it vulnerable to a correction.

EUR/USD 4H | Retest of Breakout Zone – Next Leg Higher?Market Structure:
EUR/USD has finally broken above its multi-week descending trendline and is now retesting the breakout zone. Price action has compressed into the 1.1680–1.1700 range, aligning with key technical factors.
Technical Confluence:
✔️ Fibonacci Retracement: Price sits at the 0.5–0.618 retracement (“golden pocket”) of the latest swing.
✔️ Moving Averages: 50 EMA and 200 EMA cluster at current support.
✔️ Trendline Retest: Old resistance flipped into potential new support.
✔️ Structure: Higher-low formation holding above 1.1640.
⚡ Key Levels to Watch:
Support / Buy Zone: 1.1680–1.1700
Invalidation (Stop-Loss Idea): Below 1.16080
Resistance / Targets:
TP1 → 1.1780 (previous high)
TP2 → 1.1825 (-0.27 Fib extension)
TP3 → 1.1885 (-0.618 Fib extension)
📌 Trade Idea:
(Swing Long Bias)
Entry Zone: 1.1680–1.1700
Stop: Below 1.16080
Targets: 1.1780 → 1.1825 → 1.1885
Risk/Reward: ~1:1.5 to 1:2.25
🧠 Bias:
Holding above 1.1690 = bullish continuation favored.
Losing 1.1680 could expose 1.1608, and deeper to 1.1485 monthly support.
🔮 Outlook:
The EUR/USD breakout + retest setup aligns fibs, EMAs, and structure into a strong confluence zone. If bulls hold this level, expect continuation toward 1.1825 → 1.1885 in the coming sessions.
What do you think traders does EUR/USD hold this breakout, or will sellers drag it back below 1.17?
#EURUSD #Forex #SwingTrading #PriceAction #Fibonacci #Breakout
@WrightWayInvestments
@WrightWayInvestments
@WrightWayInvestments

EURUSD Sep. 10, 2025The information and publications are not meant to be, and do not constitute, financial, investment, trading, or other types of advice or recommendations.

EUR/USD ; SHORT!Hello friends
Well, you see that the price is moving in a channel regularly and in this area, the ceiling of the channel, we are waiting for a price correction at the bottom of the channel.
If the channel breaks validly from above, the price can grow well.
*Trade safely with us*

Eurusd1. Overall Trend
• The pair has been moving in a sideways/ranging structure since July, with repeated attempts to break the descending trendline (blue line).
• Each touch of this line has pushed the price lower, so it acts as a major resistance trendline.
4. Possible Scenarios
🔹 Bullish Case (Breakout)
• A 4H or daily close above 1.1800 would confirm a breakout.
• Upside targets: 1.1900 – 1.1950, and if momentum continues, 1.2000.

EURUSD Short Term IdeaShort term EURUSD potential short trade setup for a 1:6RR trade. Annotations on screen describe the main concepts following the price and structure.

EURUSD Long From 1.1713Euro showing signs of basing after pullback.
• Long @ 1.1713 running
• Targets: 1.19 → 1.22
• Invalidation: Below 1.16
