Higher low in EURUSDEURUSD held steady around 1,1800 following the recent rally.
We’re watching for the formation of a higher low, which would confirm a potential continuation to the upside.
The main target remains a break above the previous high, with a move toward 1,2000.
All positions should remain aligned with the trend!
USDEUR trade ideas

EURUSD | 30 min bullish bias
📌 Confluence: Elliott Wave + SMC CHoCH/BOS confirmations
This aligns with Smart Money Concepts (SMC):
Price swept liquidity at Wave 5 lows
Retracing into fresh supply zone
Expecting sellers to step back in

SEPT 23: Swing Failure Pattern Done Correctly?SEPT 23: Swing Failure Pattern Done Correctly?
I guess this is it. I got stopped out once though, but I had conviction in the trading idea so I re-entered with a stop limit.
It went well.
What I did right on this trade though?
I followed my trading plan:
1. Top Down Analysis
2. Price didn't break through the HTF swing point, just went close to it. Swing Failure Pattern.
3. Divergence + Overbought conditions ongoing
4. Volume profiles indicating POC is below price, means sooner or later it'll get traded back into.
5. Entered on a 15min sweep + 5min FVG. The initial entry didn't work though, and did another sweep before going back down.
All's good.
I followed my trading plan and did not enter impulsively after the initial loss.
I guess this counts as a good trade.
oh, and I screen recorded my analysis earlier. might be of some value, might be not. either way this is a good thing. it keeps me from entering trades sporadically.

EURUSD(20250924) Today's AnalysisMarket Analysis:
Federal Reserve Chairman Powell stated that the policy rate remains somewhat restrictive, but allows the Fed to better respond to potential economic developments; tariffs are expected to have a one-time pass-through effect; and decisions will "never be based on political considerations." Fed spokespersons noted that Powell's comments indicate that he believes interest rates remain tight, potentially opening the door for further rate cuts.
Technical Analysis:
Today's Buy/Sell Levels:
1.1803
Support and Resistance Levels:
1.1844
1.1829
1.1819
1.1788
1.1778
1.1762
Trading Strategy:
If the price breaks above 1.1819, consider entering a buy position, with the first target price being 1.1844.
If the price breaks below 1.1803, consider entering a sell position, with the first target price being 1.1788.

EURUSDEURUSD
- Completed " 1234 " Impulsive Waves
- Break of Structure
- Change of Characteristics
- Rising Wedge as an corrective pattern in Short Time Frame
- S / R Level

$EURUSD Long From the OBOANDA:EURUSD is on a bullish trend. BOS on HTF and the retracement to the discount zone confirm our bias. We experienced SMT with GU, whereby EU failed to sweep the PWL and the price action on LTF (1H OB) signal potential buys from 1.1800 area.

EUR/USD: Coiling for a breakout as triangle tightenSitting in an ascending triangle with RSI (14) and MACD generating bullish signals on price momentum, traders should be on alert for a potential topside break in EUR/USD.
If we see a definitive push above 1.1820, longs could be established with a tight stop beneath for protection, targeting 1.1848 initially and 1.1860 after that.
While the price and momentum picture favours longs, you can’t ignore that the pair struggled around these levels during the North American session, putting a possible countertrend short trade on the menu should no definitive bullish break emerge when Asian trade is in full swing later today.
Shorts could be placed beneath 1.1820 with a stop above the level for protection, targeting uptrend support found around 1.1795 currently.
Good luck!
DS


Potential bullish continuation ahead?EUR/USD has bounced off the support level which is a pullback support and could rise from this level to our take profit.
Entry: 1.1774
Why we like it:
There is a pullback support level.
Stop loss: 1.1690
Why we like it:
There is a pullback support level.
Take profit: 1.1877
Why we like it:
There is a swing high resistance level.
Enjoying your TradingView experience? Review us!
Please be advised that the information presented on TradingView is provided to Vantage (‘Vantage Global Limited’, ‘we’) by a third-party provider (‘Everest Fortune Group’). Please be reminded that you are solely responsible for the trading decisions on your account. There is a very high degree of risk involved in trading. Any information and/or content is intended entirely for research, educational and informational purposes only and does not constitute investment or consultation advice or investment strategy. The information is not tailored to the investment needs of any specific person and therefore does not involve a consideration of any of the investment objectives, financial situation or needs of any viewer that may receive it. Kindly also note that past performance is not a reliable indicator of future results. Actual results may differ materially from those anticipated in forward-looking or past performance statements. We assume no liability as to the accuracy or completeness of any of the information and/or content provided herein and the Company cannot be held responsible for any omission, mistake nor for any loss or damage including without limitation to any loss of profit which may arise from reliance on any information supplied by Everest Fortune Group.

Buy Stops and Buy Limits for EUR/USDThis Euro CFD chart reflects a clear auction process shaped by order flow and supply and demand dynamics. Price first established an accumulation range, with liquidity resting above the AR High and below the AR Low. After sweeping sell-side liquidity beneath the AR Low into a demand zone near 1.1720–1.1740, buyers stepped in strongly, creating an impulsive expansion that left behind imbalances, which acted as magnets for rebalancing on the retrace. This demand zone has since proven to be a significant point of interest where smart money absorbed selling pressure. On the upside, supply is concentrated near 1.1810–1.1820, where the market is currently stalling in balance after filling inefficiencies. This creates a two-sided auction: if demand continues to hold above 1.1740, order flow favors a breakout above balance, drawing liquidity higher; however, if buyers fail to defend demand, price is likely to rotate back down toward the equal lows and POI at 1.1720. Overall, the chart shows the market balancing between demand and supply, with the next decisive move hinging on whether buyers or sellers win control of the current auction.

Dollar decline against euro (expected)I like to share my idea about the euro against the dollar. The euro had been dancing around 1.153 and 1.179 zone with a uptrend trading above the zone (at this moment). I think we might get a big push to 1.27 EUR/USD in the next few months.
As the US is printing and borrowing more money then the euro the value of the dollar will decline against other currencies. Other assets with grow in price because of the decline of the dollar (as you might have noticed with stocks/gold/houses/crypto).
I hope you like this idea and I wonder what you guys think!

EURUSD DAILY TIMEFRAME ANALYSIS #EURUSD: More Growth Potential 🇪🇺🇺🇸
As I predicted earlier, 📈EURUSD nicely bounced from a major daily support.
Analyzing how strong was a bullish reaction to that, I think that there
is more growth potential here.
On a daily time frame, the price formed a bullish imbalance candle
and a double bottom with a confirmed change of character on a 4H.
The next strong resistance is 1.1827.
It feels like it might be reached soon.
—————————
Daily/4H time frames
—————————

EURUSD: More Growth Potential 🇪🇺🇺🇸
As I predicted earlier, EURUSD nicely bounced from a major daily support.
Analyzing how strong was a bullish reaction that, I think that there
is more growth potential here.
On a daily time frame, the price formed a bullish imbalance candle
and a double bottom with a confirmed change of character on a 4H.
The next strong resistance is 1.1827.
It feels like it might be reached soon.
❤️Please, support my work with like, thank you!❤️
I am part of Trade Nation's Influencer program and receive a monthly fee for using their TradingView charts in my analysis.

EURUSD is at risk?Currency trading in 2025 was notable to a certain behavior of the US dollar: it was under constant pressure amid “sell America” narrative and expectations of FED’s rate cuts: first, traders have been awaiting them in July, then - after stubborn inflation prints, expectations have transitioned to September.
So, we are finally there - the first FED’s rate cut has happened. Two more are underway: investors look forward to three rate cuts before the year end.
Can this push the US dollar even lower?
This week, we have two important publications: GDP growth rate for the US and PCE index (also known as “FED’s inflation”). If they display strength relative to weaker NFP numbers earlier this month, they might trigger buying of the US dollar.
The net position of commercial traders for Euro fx futures (which have a negative correlation with the US dollar index), we see that it has achieved an intermediate-term low: a massive short futures position from “commercials” often points to a market turn.
In a strong trending situation, this “oversold” condition could stay there for a long time, but now the situation is controversial. The market needs new narratives: both bearish narratives for the US dollar are no longer that strong.
What are those narratives by the way?
First may be called “Sell America and move to Gold or overseas assets”
Second is “Dovish FED”
If we take a look at yields of 30-year bonds of the United States, we’d see that they don’t price in any decline after the scheduled “3-step rate cut”, but rather start to grow: that is actually a bullish factor for the US dollar.
Volatility:
And the last (but not least) potential bullish factor for the US dollar would be cyclical behavior of volatility. The intermediate-term low of ATR (Average True Range indicator) may point to a possible growth of volatility in the near future. It doesn’t necessarily point to a pullback, but in the context of the analysis above, can play on the bullish side of the US dollar too.
To sum it up:
The US dollar index is oversold: driving narratives for shorts are weakening;
Strong data for the US can kick it higher from the achieved lows:
Volatility has been low across the board, now it may cyclically increase: that is a bullish factor for the dollar too.

Ai Analysis EURUSD : Price Targets and Bullish MomentumOur AI's analysis, which utilizes real market data, continues to track the bullish momentum on EURUSD. As the price moves in our favor, we have updated our take profit targets to reflect the current market structure.
This trading setup is based on the LSR (Liquidity Sweep & Reversal) strategy, a powerful concept in which a brief price movement is used to clear out a cluster of orders before a strong reversal in the opposite direction. Our AI successfully identified this key reversal point, allowing us to position ourselves to capitalize on the subsequent upward move.
Entry: 1.17950
Stop Loss (SL): 1.17800
Take Profit (TP) Levels:
TP1: 1.17983
TP2: 1.18035 (At this level, we will move our Stop Loss to the entry price to secure the trade)
TP3: 1.18150
We are now actively tracing this trade, managing it according to our predefined plan to maximize potential gains while protecting our capital.

EURUSD: Will Go Down! Short!
My dear friends,
Today we will analyse EURUSD together☺️
The market is at an inflection zone and price has now reached an area around 1.17880 where previous reversals or breakouts have occurred.And a price reaction that we are seeing on multiple timeframes here could signal the next move down so we can enter on confirmation, and target the next key level of 1.17740.Stop-loss is recommended beyond the inflection zone.
❤️Sending you lots of Love and Hugs❤️

EU long with not clear HTF targetEU long with not clear Draw of liquidity as target in the HTF, usually that being our first step for a trade in this time I wasn't sure if I did have one.

EUR/USD | Elliott Wave + 1:3 Correction Setup EUR/USD Day 40 | Elliott Wave + 1:3 Correction Setup 📊
Analyzing a 1:3 correction structure with Elliott Wave on the 30M chart.
🔹 1st Trade: Small SL hit (-0.25%)
🔹 2nd Trade: Clean 1:2 RR win ✅
🔹 Setup: Watching key levels 1.18152 / 1.18034 (resistance) & 1.17758 (support zone)
🔹 Lesson: Risk management + patience = consistency 🚀
#EURUSD #ForexTrading #ElliottWave #TradingChallenge
---

Trading balanceTrading balance The price of the asset has rebounded from the balance zone. With the prospect of growth into the resistance zone.

EURUSDPreferably suitable for scalping and accurate as long as you watch carefully the price action with the drawn areas.
With your likes and comments, you give me enough energy to provide the best analysis on an ongoing basis.
And if you needed any analysis that was not on the page, you can ask me with a comment or a personal message.
Enjoy Trading ;)

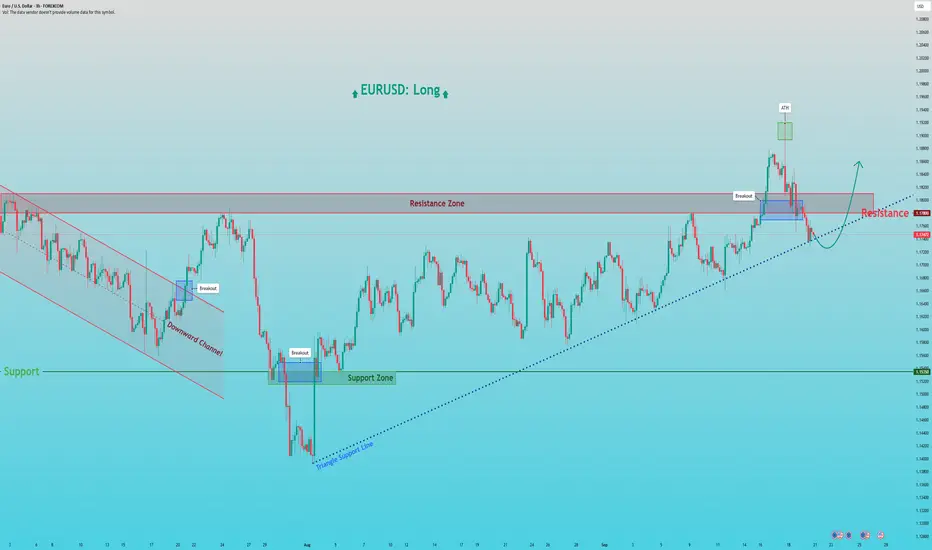
EURUSD: Dip and Bounce from Triangle SupportHello everyone, here is my breakdown of the current Euro setup.
Market Analysis
After reversing from a prior Downward Channel, EURUSD has been consolidating in a large Upward Triangle. This pattern is typically bullish and is defined by a flat horizontal Resistance at the 1.1780 level and an ascending support line, showing that buyers are becoming progressively more aggressive on each dip.
An interesting part of this pattern's history is the 'fake breakout' we saw previously, where the price spiked to a local ATH at 1.1920 before falling back inside. Currently, the price is again in a corrective pullback, heading towards the ascending Triangle Support Line for another test.
My Scenario & Strategy
My scenario is based on the expectation that this Upward Triangle will eventually resolve to the upside. I'm looking for the price to complete its downward movement and find strong support on the ascending Triangle Support Line. A confirmed bounce from this line would be the key signal that buyers are stepping in to defend the trend.
Therefore, the strategy is to watch for this bounce. A successful rebound that finally leads to a decisive breakout above the Resistance Zone would validate the long scenario. The primary target for the subsequent expansion is 1.1860, a logical objective for the move that would follow.
That's the setup I'm tracking. Thank you for your attention, and always manage your risk.
EURUSD: Expecting Bearish Continuation! Here is Why:
It is essential that we apply multitimeframe technical analysis and there is no better example of why that is the case than the current EURUSD chart which, if analyzed properly, clearly points in the downward direction.
Disclosure: I am part of Trade Nation's Influencer program and receive a monthly fee for using their TradingView charts in my analysis.
❤️ Please, support our work with like & comment! ❤️

EURUSD bearshwhat do u think about this weekend chart.... as i draw for uptrend line for the last week but u know ots an liquidiy sweeping so there is down trend to rech the past fvg
type bellow in comments what do you think
