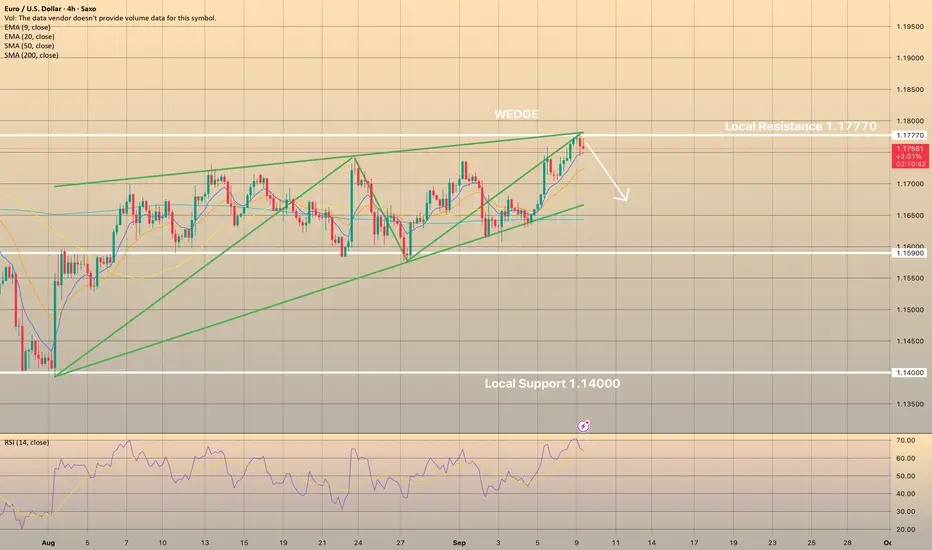
EURO STILL SHOWING SIGNS OF TOPPING? Hey Traders new week new trading game. Back to the Euro still has the 123 top on the charts so you could either respect the formation or ignore it. For me as a techincal analyst I always repect the formation until it is violated.
The economic landscape has suddenly shifted in favor of rate cuts after that latest Unemployment Number but remember always expect the unexpected in this game. Does that mean the Dollar is about to sell off hard?
Maybe or maybe not😁
Seems to me like everytime that Euro gets close to the 3 point it backs off at 1.1788. Also the COT Funds Large Specs are still Long the market. If they become overcrowded on the long side who else will be left to buy?
They might have to start selling.
So therefore Scenarios for today are imo.
Bearish- still seems to me like the charts are showing a top unless market has daily close above 1.1833 I would say that because she already broke support at 1.1554 pullbacks are common before continuing with downtrend. So its a selling opportunity for now also just because the FED cuts int rates that does not mean the Euro will go up if the Economy is in trouble investors might flock to the US dollar as a safe haven!
Bullish- ahhh yes for all you Euro Bulls out there. If it breaks above 1.1833 that would be a strong signal that market wants to move higher. Also it would then cancel the 123 top that is there. Then buy on pullback of retest of 1.1833 but I would make sure that it's a true breakout with daily close above 1.1833. Also watch the COT to add to long side.
COT- They are long not overcrowded yet but they added like 50,000 long contracts since april so normally if they keep buying they could be at risk of a being squeezed out they call it short squeeze or in this case long squeeze. Watch for the new positioning this Friday after market closes.
Good Luck & Always use Risk Management!
(Just in we are wrong in our analysis most experts recommend never to risk more than 2% of your account equity on any given trade.)
Hope This Helps Your Trading 😃
Clifford
RISK DISCLOSURE
TRADING IN THE FUTURES AND FOREX MARKET INVOLVES SIGNIFICANT RISK. ALWAYS CONSULT A FINANCIAL ADVISOR AS HIGH RISK ASSET CLASSES MAY NOT BE SUITABLE FOR ALL INVESTORS. THIS IS NOT A RECOMMENDATION TO BUY OR SELL ANY ASSETS. ALL IDEAS ARE MADE FOR EDUCATIONAL PURPOSES. PAST PERFORMANCE DOES NOT GUARANTEE FUTURE RESULTS.
CFTC RULE 4.41 – HYPOTHETICAL OR SIMULATED PERFORMANCE RESULTS HAVE CERTAIN LIMITATIONS. UNLIKE AN ACTUAL PERFORMANCE RECORD, SIMULATED RESULTS DO NOT REPRESENT ACTUAL TRADING.
USDEUR trade ideas

DeGRAM | EURUSD above the accumulation zone📊 Technical Analysis
● EUR/USD has broken above the long-term resistance line after consolidating in the 1.1650–1.1720 accumulation zone, confirming a bullish breakout.
● Price is now testing 1.1770 resistance; sustained momentum above this level would open the way toward the 1.1950 target, with 1.1700 acting as fresh support.
💡 Fundamental Analysis
● The euro is supported by easing recession fears in the eurozone and improving investor sentiment, while the dollar weakens amid speculation the Fed may pause tightening after softer US inflation data.
✨ Summary
Bullish above 1.1700; targets 1.1770 → 1.1950. Invalidation on a close below 1.1650.
-------------------
Share your opinion in the comments and support the idea with a like. Thanks for your support!

EUR-USD Risky Long! Buy!
Hello,Traders!
EUR-USD made a bearish
Pullback from the horizontal
Resistance just as I predicted
And the pair will soon retest
A local horizontal support
Level of 1.1706 so after
The retest a local bullish
Rebound is to be expected
Buy!
Comment and subscribe to help us grow!
Check out other forecasts below too!
Disclosure: I am part of Trade Nation's Influencer program and receive a monthly fee for using their TradingView charts in my analysis.

My EU 2nd Entry Learn!OHLC CONCEPT or OLHC CONCEPT.
This reversal concept implies that a trader can easily project the move of any higher timeframe Candle by catching the Open of the candle, it's mitigation to an area of Interest or Sweep of Liquidity creating the High/ Low , targeting the next Area of Interest(AOI) or Liquidity (liq) creating the Low/ High and the Closing at Market Price.
This Concept works on any Higher timeframe Candle i.e 4hr, Daily, Weekly & Monthly candles. The aim is to look for your entry setup on the Lower timeframe which is (Sweep of Liquidity while mitigating Area of Interest (AOI), Market Structure shift, and retracement to mitigate Imbalance, OB, or Breaker and targeting AOI's or Liquidities confirming your Bias.
Take continuous entries and stack as price goes in your direction while taking partial profits too.
Go to your charts and practice this. See you all later. :)

EURUSD Sep 09, 2025The information and publications are not meant to be, and do not constitute, financial, investment, trading, or other types of advice or recommendations.

EURUSDFrom what I can see, price looks to be retesting the previous resistance area, now turned support. It also seems to be respecting the market gap at 1.17150. If the support area and market gap hold, I’m looking for bullish momentum until around the 1.18000 area.

EURUSD MORNING SET-UP I've been looking at this setup since yesterday, so today I finally come up with it. A simple daily strategy you can use; just waiting for MSS to the downward after taking the prev week high. Boom I have my sell then I take my tp from daily FVG.
Cool money for you 💙💙💙💙

EURUSD ready to fallWe sell eurusd, and we wait till tomorrow to see if we protect the trade or we close part of it.
follow me for instructions.
blessings
thnks

TP smashed! Bearish continuation in full play!Price triggered my entry just exactly at 5am NY time within the ICT NY kill zone so time and direction of price were in tandem. Next, price is probably headed for the daily candle low and potentially beyond that(unfortunately, I was unable to get a second entry to ride the sell until whenever).

EUR/USD Market WatchEUR/USD is pulling back into a strong support zone. This is exactly where we prepare — not where we predict.
Right now, structure looks good, but we need confirmation before anything else:
✅ Engulfing Candle
✅ Strong Volume
✅ Aligned Momentum
Until those three line up, this is just a setup in progress.
⚔️ War Room Lesson: The market rewards patience. We don’t chase moves — we wait for Structure, Signal, Volume, and Momentum to align before we act.

EURUSD compras STRUCTURE aligned with the trend, waiting for confirmations to enter long positions.
NOT AN INVESTMENT RECOMMENDATION, JUST AN ANALYSIS FROM MY PERSPECTIVE.

EURUSD: Will Keep Falling! Here is Why:
Looking at the chart of EURUSD right now we are seeing some interesting price action on the lower timeframes. Thus a local move down seems to be quite likely.
Disclosure: I am part of Trade Nation's Influencer program and receive a monthly fee for using their TradingView charts in my analysis.
❤️ Please, support our work with like & comment! ❤️


EUR/USD | EUR/USD Breaks 1.17 – Eyes on 1.176+ Targets! (READ)By analyzing the EUR/USD chart on the 4-hour timeframe, we can see that the price held at the 1.16 demand zone as expected and managed to climb above 1.17 with confirmation. Currently, it’s trading around 1.173. If the price can break the 1.174 resistance and close above it, we can expect further upside.
The possible bullish targets are 1.176, 1.177, and 1.179.
Please support me with your likes and comments to motivate me to share more analysis with you and share your opinion about the possible trend of this chart with me !
Best Regards , Arman Shaban

Fed rate cut is certain Based on the latest available economic, political, macroeconomic, and geopolitical data, including the just-released August 2025 nonfarm payrolls report, the probability of a Federal Reserve interest rate cut at the September 16-17, 2025, Federal Open Market Committee (FOMC) meeting is now effectively 100%, with market-implied odds favouring a 25-basis-point (bps) cut but incorporating a small chance (around 10-12%) of a larger 50-bps reduction. Below is a detailed assessment of the factors influencing this probability, grounded in the provided data and broader considerations, with updates reflecting the weak August jobs data.
Key Economic Indicators
1. Inflation: Inflation remains above the Fed’s 2% target, with core Consumer Price Index (CPI) around 3% and Personal Consumption Expenditures (PCE) price index at 2.5% as of mid-2025. Tariff-induced price pressures are expected to push inflation higher in Q3 2025, potentially peaking at 3–3.5%. However, some Fed officials, like Governors Michelle Bowman and Christopher Waller, argue that tariff effects may be one-time adjustments rather than sustained inflationary pressure. The Fed is cautious, as persistent inflation could become embedded in expectations, complicating monetary policy.
2. Labor Market: The August 2025 jobs report showed significant further weakening, with nonfarm payrolls rising by only 22,000—far below the expected 75,000 and continuing a trend of slowdowns.    The unemployment rate rose to 4.3% from 4.2% in July, marking the highest level since 2021 and approaching a 4-year high.    Revisions painted an even bleaker picture: June payrolls were revised to show a net job loss (the first decline since 2020), while July was revised upward slightly but still weak at around 77,000 for private payrolls.   Over the past three months, average monthly job growth was just 29,000, well below the 12-month average of 122,000.  Continuing jobless claims remain elevated, and sectors like manufacturing and temporary help services saw declines, signaling broader labor market deterioration.  Fed officials have noted increased downside risks to employment, and this data strongly supports the case for a rate cut to prevent a potential recession.
3. Economic Growth: Real GDP growth was tepid in H1 2025 (-0.5% in Q1, rebounding to 3.3% in Q2 due to tariff-anticipation spending), but underlying fragility persists due to policy uncertainty. Consumer spending growth slowed to 1.4% in Q2, and real final sales to domestic purchasers grew at a sluggish 1.2%. The Fed views the economy as resilient but is concerned about balancing growth with inflation risks, especially with the latest jobs data flashing warning signs of stall speed.
Market Expectations
• Fed Funds Futures: Following the August jobs report, the CME FedWatch Tool and futures markets now imply a 100% probability of at least a 25-bps rate cut in September 2025, lowering the federal funds rate from its current 4.25–4.50% range.   Odds of a larger 50-bps cut have risen to around 10-12%, up from near zero before the data release, reflecting heightened concerns over labor market weakness.    Markets anticipate a total of about 75-100 bps in cuts by year-end (e.g., three to four 25-bps cuts), with equity markets reacting negatively initially but stabilizing on expectations of Fed action.
• Market Sentiment: Financial markets have priced in aggressive easing, with bond yields falling and credit spreads widening slightly post-report. This weak jobs print has shifted sentiment from cautious optimism to urgency for Fed support.  
Fed Signals
• Jerome Powell’s Comments: At the Jackson Hole symposium on August 22, 2025, Fed Chair Jerome Powell signaled a potential September rate cut, citing rising job market risks while acknowledging persistent inflation. He emphasized a cautious approach, noting that the current federal funds rate (4.25–4.50%) is slightly above the neutral rate (estimated at ~3%). Powell’s shift from a “wait-and-see” stance to indicating action may be warranted suggests openness to easing policy, and the August data reinforces this.
• FOMC Dissent: At the July 2025 meeting, Governors Michelle Bowman and Christopher Waller dissented, advocating for a rate cut, indicating internal support for easing. However, the majority voted to hold rates steady, reflecting caution due to inflation concerns.
• FOMC Projections: The June 2025 FOMC projections estimated a median federal funds rate of 3.9% for year-end 2025, implying 50–75 bps in cuts. The December 2024 projections were more conservative, forecasting only 50 bps in cuts for 2025, down from 100 bps in September 2024, due to elevated inflation expectations (2.5% core PCE).
Political and Geopolitical Factors
• Tariffs: President Trump’s tariff policies, announced in April 2025, have raised inflation concerns, as businesses may pass higher costs to consumers. The Fed is wary of tariff-induced inflation but views it as potentially temporary. Trump’s pressure on the Fed to cut rates adds political complexity, with some FOMC members possibly resisting to maintain independence, while others may see it as aligning with economic needs.
• Fed Independence: Trump’s demands for rate cuts and calls for Powell’s resignation create political pressure, but Powell has emphasized the Fed’s commitment to data-driven decisions. The appointment of Stephen Miran to the Fed’s board may tilt policy toward easing, as he advocates for looser policy.
• Geopolitical Uncertainty: Tariff impacts on global trade (e.g., U.S. curbs on TSMC’s chip shipments to China) and potential immigration policy changes (e.g., deportations reducing labor supply) add uncertainty, potentially affecting inflation and growth.
Expert and Analyst Views
• J.P. Morgan Research: Anticipates a 25-bps cut in September, followed by three additional cuts by early 2026, bringing the rate to 3.25–3.50%, with the weak August data solidifying this path.
• Morgan Stanley: Now sees a higher likelihood of a cut (previously 50-50), citing the stalled labor market and rising unemployment as tipping points, though robust earlier GDP tempers calls for aggressive action.
• Reuters Poll: Over 60% of economists predict one or two rate cuts in 2025, with a September cut as the base case, though confidence is tempered by data uncertainty and political pressures; post-August report, many have upgraded to expecting a cut. 
• Morningstar: Expects two 25-bps cuts in 2025, with the federal funds rate reaching 3.75–4.00%, but notes some analysts predict fewer or no cuts due to uncertainty; the jobs data has increased odds of more easing.
• PIIE: Highlights a contentious September meeting, with some FOMC members on the fence due to mixed data and tariff risks, but market expectations lean heavily toward a cut.
• Additional Post-Report Analysis: Analysts at Invesco and State Street Global Advisors view the soft jobs data as sealing a September cut, with debates emerging on whether to go “big” with 50 bps given the labor slowdown.   
Probability Assessment
The data, particularly the dismal August jobs report, suggests an ironclad case for at least a 25-bps rate cut in September 2025, driven by:
• Severe labor market cooling (+22,000 jobs, 4.3% unemployment, negative revisions), heightening downside risks to employment and aligning with the Fed’s dual mandate.
• Market expectations at 100% for a cut, with 88-90% odds of 25 bps and 10-12% for 50 bps per Fed funds futures.
• Powell’s Jackson Hole remarks signaling openness to easing, supported by dissenting FOMC members and now amplified by fresh evidence of economic fragility.
• The current federal funds rate (4.25–4.50%) being above the neutral rate (~3%), suggesting room for easing.
However, risks tempering the size of the cut include:
• Persistent inflation above the 2% target (core CPI at 3%, PCE at 2.5%), potentially exacerbated by tariffs.
• Political pressure from the Trump administration, which may cause some FOMC members to resist cuts to assert independence.
• Mixed economic signals, with robust Q2 GDP growth (3.3%) reducing urgency for a jumbo cut, though the jobs data overrides this somewhat.
Given these factors, I estimate a 100% probability of a rate cut in September 2025, with 88-90% odds of 25 bps (the most likely outcome) and 10-12% odds of 50 bps, aligning with market pricing and supported by labor market concerns and Fed signals. A hold is now implausible, and a larger cut would require even weaker incoming data.
Critical Considerations
• The Fed’s data-dependent approach means new data releases before September 17 could shift the outcome. For instance, a stronger-than-expected August CPI (due soon) could lower the odds of a 50-bps cut.
• Political pressures and tariff uncertainties add complexity, potentially influencing FOMC dynamics, especially with a new governor (Miran) favoring easing.
• The Fed’s focus on balancing its dual mandate (employment and price stability) suggests a cut is inevitable if labor market weakness persists, but inflation concerns could lead to a measured approach.
Overall
In my opinion the chances of a Federal Reserve rate cut this month is 100%, with approximately 88–90% for 25 basis points and 10–12% for 50 basis points, based on current market expectations, the weak August jobs report, and Fed communications, overriding prior uncertainties around inflation and politics.
Its no longer a case of ‘IF’, it’s now a case of ‘By how much’

EUR/USD to be raised up to 1.82-1.94If we add to the French government the expected vote of no confidence on September 8, EURUSD prices will start to look logical. However, personally, I would buy the fact. The resignation of Michel Bayrou and his team is a reason to increase longs on the euro on the pullback. The initial target marks are 1182 and 1194.

EURUSD Key for the trend is the 1H MA50.The EURUSD pair has been trading within a short-term Channel Up similar to late August's. It's Support is the 1H MA50 (blue trend-line), which is critical, as a candle close below it was what reversed the trend to bearish on the previous Channel Up.
As a result, as long as it holds, we will stay bullish, targeting 1.1800 (the 1.3 Fibonacci extension, which was the peak of the previous Channel Up).
-------------------------------------------------------------------------------
** Please LIKE 👍, FOLLOW ✅, SHARE 🙌 and COMMENT ✍ if you enjoy this idea! Also share your ideas and charts in the comments section below! This is best way to keep it relevant, support us, keep the content here free and allow the idea to reach as many people as possible. **
-------------------------------------------------------------------------------
💸💸💸💸💸💸
👇 👇 👇 👇 👇 👇

Euro extends gains on weak U.S. data – How long can it last?Euro extends gains on weak U.S. data – How long can it last?
The euro hit $1.1779, its highest since late July, as weak U.S. labor data fueled expectations of a Fed rate cut next week. Slowing job growth and rising unemployment pressured the dollar, supporting EUR/USD.
While the Fed is expected to ease policy, the ECB is likely to keep rates steady, reinforcing euro strength. However, political uncertainty in France—after Prime Minister Francois Bayrou lost a confidence vote—may cap gains. Analysts expect a drag on the euro as the outcome was largely priced in.
Markets will focus on the Fed meeting. A confirmed cut could push the dollar lower and lift EUR/USD, but any ECB hints of easing could trigger a correction.
EUR/USD Nears Key Supply Zone Amid Rising Short PositionsThe EUR/USD is currently approaching a significant daily supply zone. This is an area where, in the past, the price briefly touched before reversing and heading downward. Now, the currency pair is nearing a second test of this supply level, which could signal that institutional traders are preparing to add more short positions. Historically, these supply zones tend to act as resistance points, and the repeated testing suggests a potential buildup of selling pressure.
Looking at the recent positioning of different market participants, last week saw an increase in short positions among Non-Commercial traders, indicating that large speculators are betting on a decline in the EUR/USD. Conversely, Commercial traders are at their lowest levels since August 2024, which typically signals that those involved in hedging or commercial transactions are less inclined to support the current price levels. Meanwhile, retail traders continue to add to their positions, often acting as a contrarian indicator.
In tandem, the US dollar itself is entering a demand zone, as evidenced by the increase in Non-Commercial contracts on the dollar index. This suggests that speculative traders are betting on the dollar strengthening, which aligns with the potential for a downside move in EUR/USD.
Given these combined signals—the approaching supply zone, the increase in short positions among large traders, and the dollar entering a demand area—I am looking for a possible shift towards the downside for EUR/USD. This could lead to a strengthening of the US dollar as the market prepares for a potential reversal or continuation of the bearish trend.
Additionally, I will include my analysis of the DXY (US Dollar Index), which remains valid and supports this perspective. The DXY’s current positioning and technical setup reinforce the likelihood of the dollar gaining strength in the near term. Overall, the market is showing signs that favor a downside move, and I will be monitoring these levels closely for confirmation.
✅ My DXY Point of view:
✅ Please share your thoughts about EURUSD index in the comments section below and HIT LIKE if you appreciate my analysis. Don't forget to FOLLOW ME; you will help us a lot with this small contribution.

EURUSD – Market Outlook
🔼 Bullish Scenario:
• If price holds above 1.1735, the bullish momentum will continue.
• Next target: 1.1810 (bullish zone objective).
🔽 Bearish Scenario:
• If price falls and stabilizes below 1.1735, the trend will shift bearish.
• First target: 1.1710 (support level).
• If 1.1710 breaks and the price closes below it, then the bearish trend will extend further (full downside continuation).
📊 EURUSD – Trading Signal
🔔 Entry:
• Above 1.1735
🎯 Target (TP):
• 1.1810
🛡️ Stop Loss (SL):
• Below 1.1710
📌 Note: If the price stays above 1.1735, you can consider a Buy position aiming for 1.1810.

EUR/USD | From Tariffs to Targets – Testing 1.1800EUR/USD has staged a clean rebound since August as soft U.S. data and dovish Fed expectations weighed on the dollar, while Eurozone resilience added support. July’s pullback was tied to U.S.–EU tariff developments, but momentum has since shifted, with RSI showing further room to the upside.
Key resistance at 1.1800 is now under pressure—holding above here opens the path toward the 1.20 multi-month target. If resistance caps price again, we could see another corrective pause.
The story remains centred on U.S. data surprises and rate-cut expectations, alongside Eurozone growth signals.

EUR/USD on the 4-hour chart.EUR/USD on the 4-hour chart.
The price is currently around 1.1770
I have drawn a triangle breakout pattern.
The chart shows a target point around 1.1950.
👉 Based on the pattern drawn, the breakout projection suggests the target zone is near 1.1950.

EURUSD remains rising 🎯 Euro Hunt (EUR/USD)
The Euro is currently trading above the breakout level.
As long as the price holds above 1.1735, 🎯 the direction remains bullish, targeting the upside zone.
⚠️ However, if the price fails to hold and drops back below 1.1735, the bearish hunt begins, aiming for the 1.1710 support. A break of this level will completely shift the outlook into a bearish hunt, with targets extending into the lower zone.
📌 EUR/USD – Hunting Trade Plan
🔼 Bullish Scenario:
• Entry: Above 1.1735
• Target (TP): 1.1760 → 1.1785
🔽 Bearish Scenario:
• Entry: Below 1.1735
• Target (TP): 1.1710 → 1.1685
