EURUSD Wave Analysis – 19 September 2025
- EURUSD reversed from resistance zone
- Likely to fall to support level 1.1640
EURUSD currency pair recently reversed down from the resistance zone between the resistance level 1.1835 (former multi-month high from June), upper daily Bollinger Band and the resistance trendline of the daily up channel from July.
The downward reversal from this resistance zone started the active minor correction 4.
Given the strongly bullish US dollar sentiment seen across the FX markets, EURUSD currency pair can be expected to fall to the next round support level 1.1640.
USDEUR trade ideas

EUR-USD Long From Rising Support! Buy!
Hello,Traders!
EUR-USD is making a
Nice bearish correction
After the FED's decision
Crazy trading but now
The pair is close to the
Rising support line so
After the retest we will
Be expecting a local
Bullish rebound
Buy!
Comment and subscribe to help us grow!
Check out other forecasts below too!
Disclosure: I am part of Trade Nation's Influencer program and receive a monthly fee for using their TradingView charts in my analysis.

EUR/USD BEFORE FOMC VIEWOANDA:EURUSD
Main Trend: The 4-hour chart clearly shows that EURUSD is in a strong uptrend, confirmed by the ascending trendline.
Market Structure: After a breakout above the previous high, the price has created a new demand zone, labelled as "CP - ORDER". This zone is located roughly between 1.17600 and 1.17700.
Footprint Analysis: The 1-hour footprint chart provides confirmation of the bullish momentum. It shows large volumes and significant positive delta (more buy orders than sell orders) being executed on the strong upward candles.
Key Observation: The most recent bullish candle on the footprint chart (around 20:00) has a very large positive delta (+681) and high volume (12.19K), indicating strong buying pressure is driving the price up. This suggests that the uptrend is likely to continue.
Trading Plan (BUY Plan)
Based on this analysis, the primary strategy is to wait for a pullback and look for a buying opportunity, in line with the current upward trend.
Entry: Wait for the price to retrace back to the CP - ORDER demand zone, which is around 1.17600 - 1.17700. This area is expected to contain significant pending orders.
Stop Loss (SL): Place the stop loss below the low of the demand zone, at approximately 1.17100, or as marked on the chart. This position is also below the trendline, providing protection against deeper pullbacks.
Take Profit (TP) Targets:
Target 1: The most recent high, at around 1.18200.
Target 2: You can hold the position to aim for higher levels, following the market's upward momentum. The ultimate target, as indicated by the arrow on the chart, could be the 1.19000 level or even higher.
Conclusion
This trading plan is a clear long setup based on a combination of technical analysis (uptrend and demand zone) and order flow analysis (strong positive volume and delta).
However, you should always keep the following in mind:
Make sure the price actually pulls back to the CP - ORDER zone and shows signs of confirmation (e.g., a bullish pin bar, an increase in volume) before entering a trade.
Practice strict risk management by adhering to the defined stop-loss level.
DXY ANALYSIS IN DONWTREND and High Rate back to Higher OB


EUR/USD still heading to 1.20?The EUR/USD is now on its third down day after the US dollar found good support following the Fed’s dovish rate cut and Powell’s hawkish press conference on Wednesday. The dollar does feel a touch rich after the Fed, and I’d expect some pullback in the coming sessions given the Fed’s pivot. In the bigger picture, with the Fed now in easing mode, it would take a consistent run of stronger-than-expected economic data to materially shift the tide back in favour of the US dollar.
Not much on the euro side to report, except the political situation in France. Data wise, European PMIs will be watched next week. Surgery-based data such as the PMIs are considered to be forwarded looking and can sometimes carry more weight than hard data. Keep an eye on prices paid sub-indices for UK numbers, employment for US and overall headline figures for Eurozone given where the focus is for central banks in each economic regions. The EUR/USD could rebound if Germany’s PMIs show signs of improvement, while the dollar index could resume its own slide should the PMIs reveal further weakness in employment. Later on in the week, next Friday, we will have the Fed's favorite inflation measure, the core PCE price index.
The trend is bullish on the EUR/USD and with rates now testing support here, I wouldn't be surprised to see a recovery. I continue to expect the pair to head to 1.20 in the coming days/weeks.
By Fawad Razaqzada, market analyst with FOREX.com

eurusd longWith capital management, you can be a buyer. The loss limit and profit limit are clear in the image.

EURUSD remains under pressure, potential for further decline?EURUSD remains under pressure as fragile growth in Europe, particularly in Germany, clashes with persistent inflation that keeps the ECB from cutting rates.
Meanwhile, the dollar pared its recent decline due to relative US resilience, though a dovish Fed outlook may limit any gains on the dollar. For now, rallies look capped, with the bias tilted lower until Europe shows clearer signs of recovery.
EURUSD slide lower following a break below the ascending trendline. The pair remains under pressure with lower swings reinforcing the potential for a further decline. If EURUSD breaks the support at 1.1720, the price could extend its decline toward the following support at 1.1680. Conversely, a retracement above 1.1720 may prompt a retest of the resistance at 1.1800.
By Li Xing Gan, Financial Markets Strategist Consultant to Exness

EURUSD: Bullish Forecast & Outlook
It is essential that we apply multitimeframe technical analysis and there is no better example of why that is the case than the current EURUSD chart which, if analyzed properly, clearly points in the upward direction.
Disclosure: I am part of Trade Nation's Influencer program and receive a monthly fee for using their TradingView charts in my analysis.
❤️ Please, support our work with like & comment! ❤️

Approaching support. bearis has taken a substructure correction move looking for longs at the appropriate entry is a wise idea

EUR/USD - Rising Wedge Breakout @ H1 CMCMARKETS:EURUSD EUR/USD - Wedge Pattern Strong breakout - @ H1 with high volume. Expecting Strong Bearish outlook today and Fundamental also play major role today.
"The Fed is still signalling more rate cuts, but at the same time still sees okay growth, which is a positive combination for share markets"
The Fed reduced rates by a quarter point on Wednesday, as expected, and indicated it will steadily lower borrowing costs for the rest of this year, initially sending the dollar plunging.
Support by Likes and Comments.
Thank you.

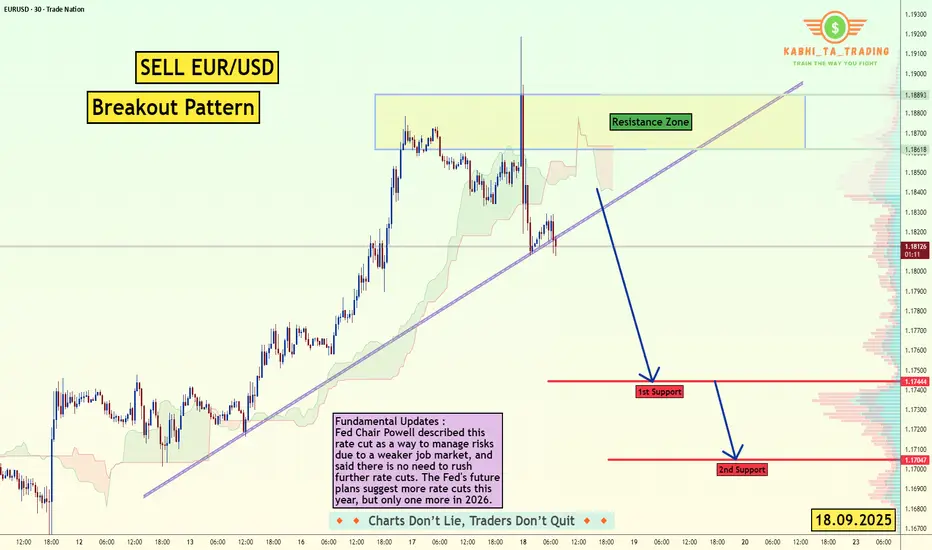
EUR/USD - Fundamental Move (18.09.2025)The EUR/USD Pair on the M30 timeframe presents a Potential Selling Opportunity due to a recent Formation of a Breakout Pattern.
This suggests a shift in momentum towards the downside in the coming hours.
Possible Short Trade:
Entry: Consider Entering A Short Position around Trendline Of The Pattern.
Target Levels:
1st Support – 1.1744
2nd Support – 1.1704
Fundamental Updates :
Fed Chair Powell described this rate cut as a way to manage risks due to a weaker job market, and said there is no need to rush further rate cuts. The Fed's future plans suggest more rate cuts this year, but only one more in 2026.
🎁 Please hit the like button and
🎁 Leave a comment to support for My Post !
Your likes and comments are incredibly motivating and will encourage me to share more analysis with you.
Best Regards, KABHI_TA_TRADING
Thank you.
EURUSD: Absolute Price Collapse Ahead! Short!
My dear friends,
Today we will analyse EURUSD together☺️
The market is at an inflection zone and price has now reached an area around 1.17465 where previous reversals or breakouts have occurred.And a price reaction that we are seeing on multiple timeframes here could signal the next move down so we can enter on confirmation, and target the next key level of 1.17251.Stop-loss is recommended beyond the inflection zone.
❤️Sending you lots of Love and Hugs❤️

EUR/USD Trading Plans EUR/USD Trade Plan
1. Bearish Setup (higher probability right now)
Entry: If price closes below 1.16945 on the daily chart.
Stop Loss (SL): Above 1.1765 (recent resistance).
Take Profit (TP):
TP1 → 1.1500 (psychological level & prior demand)
TP2 → 1.1135 (major demand zone marked on your chart).
📉 Risk/Reward: Good (approx. 1:2 to 1:3 depending on TP).
---
2. Bullish Setup (if support holds)
Entry: If price rejects 1.16945 with a bullish engulfing or strong pin bar.
Stop Loss (SL): Below 1.1640 (under support wick).
Take Profit (TP):
TP1 → 1.1867 (immediate resistance)
TP2 → 1.2191 (major resistance / supply).
📈 Risk/Reward: Decent (1:2 if aiming for 1.2191).
3. Neutral Zone (wait mode)
If price is stuck between 1.16945 – 1.1765, better to wait. That’s a “decision zone” → market could flip either way.
✅ Summary
Bias: Short-term bearish after rejection at 1.2191.
Main level to watch: 1.16945 (support).
Best plan:
Sell below 1.16945 → aim for 1.1500 → 1.1135.
Buy only if bullish rejection candles form at 1.16945.
⚠️ Always use proper risk management (1–2% risk per trade max).

EURUSD – Upcoming Bearish Trend: Seize the Opportunity!Hello traders! Today, we will analyze EURUSD and make a forecast on the bearish trend ahead, based on the chart and key fundamental factors influencing this pair.
The Fed cut interest rates to 4.25% as expected, but it did not exceed expectations, which means USD has not weakened. This creates downward pressure on EURUSD as USD maintains its strength.
The unemployment claims data came in lower than expected, indicating a strong labor market , which supports USD, further increasing pressure on EURUSD.
The chart shows that EURUSD is in an uptrend channel, but it is now showing signs of reversing when encountering resistance at 1.1880. If the price fails to break this level, EURUSD could drop to 1.1830, and continue to fall to lower levels. Specifically, if the price breaks below 1.1830, the next target will be 1.1750.
With a clear downward trend and supporting market factors, EURUSD could continue to adjust downwards in the near term. Keep an eye on support and resistance levels to take advantage of effective trading

EURUSD impacted by hedging the US dollar? The EURUSD remains in a bullish trend, with recent price action showing signs of a breakout within the broader uptrend.
Support Zone: 1.1700 – a key level from previous consolidation. Price is currently testing or approaching this level.
A bullish rebound from 1.1700 would confirm ongoing upside momentum, with potential targets at:
1.1846 – initial resistance
1.1900 – psychological and structural level
1.1933 – extended resistance on the longer-term chart
Bearish Scenario:
A confirmed break and daily close below 1.1700 would weaken the bullish outlook and suggest deeper downside risk toward:
1.1630 – minor support
1.1585 – stronger support and potential demand zone
Outlook:
Bullish bias remains intact while the EURUSD holds above 1.1700 A sustained break below this level could shift momentum to the downside in the short term.
This communication is for informational purposes only and should not be viewed as any form of recommendation as to a particular course of action or as investment advice. It is not intended as an offer or solicitation for the purchase or sale of any financial instrument or as an official confirmation of any transaction. Opinions, estimates and assumptions expressed herein are made as of the date of this communication and are subject to change without notice. This communication has been prepared based upon information, including market prices, data and other information, believed to be reliable; however, Trade Nation does not warrant its completeness or accuracy. All market prices and market data contained in or attached to this communication are indicative and subject to change without notice.

The Day Ahead - The triple witching day!Data
UK: September GfK consumer confidence and August retail sales → signals for household demand momentum; public finances update in focus for fiscal stance.
Japan: August national CPI → key inflation read ahead of today’s BoJ decision.
Germany: August PPI → important for eurozone disinflation trends.
France: September manufacturing confidence → industrial outlook update.
Canada: July retail sales → gauge on household spending.
Central Banks
Bank of Japan: Policy decision today; markets watching for any shift in yield curve control or forward guidance after recent inflation trends.
Trading Impact
FX: JPY volatility likely around BoJ; GBP moves tied to consumer sentiment/retail sales.
Rates: UK gilt yields could react to retail sales/public finances; JGBs in focus on BoJ outcome.
Equities: Japan equities sensitive to BoJ stance; European stocks watching German PPI and French confidence for growth/inflation signals.
Commodities: German PPI a useful read on industrial demand trends across Europe.
This communication is for informational purposes only and should not be viewed as any form of recommendation as to a particular course of action or as investment advice. It is not intended as an offer or solicitation for the purchase or sale of any financial instrument or as an official confirmation of any transaction. Opinions, estimates and assumptions expressed herein are made as of the date of this communication and are subject to change without notice. This communication has been prepared based upon information, including market prices, data and other information, believed to be reliable; however, Trade Nation does not warrant its completeness or accuracy. All market prices and market data contained in or attached to this communication are indicative and subject to change without notice.

Fundamental Market Analysis for September 19, 2025 EURUSDThe US Department of Labor (DOL) reported on Thursday that the number of Americans filing new claims for unemployment benefits fell to 231,000 for the week ending September 13. The latest data was lower than the initial estimate of 240,000 and lower than the previous week's figure of 264,000 (revised from 263,000). Meanwhile, the number of people continuing to claim unemployment benefits fell by 7,000 to 1.920 million for the week ending September 6.
The US dollar remains strong after the Federal Reserve (Fed) announced an expected rate cut on Wednesday but did not indicate that it would rush to lower borrowing costs in the coming months.
The decline in the EUR/USD pair may be limited as the euro (EUR) could be supported by growing expectations that the European Central Bank (ECB) will end its cycle of rate cuts after the release of the latest inflation data.
ECB Vice President Luis de Guindos said the central bank should take a “very cautious” approach given the high uncertainty. Guindos added that the current rate is adequate given inflation trends and monetary policy transmission.
Trade recommendation: SELL 1.1735, SL 1.1765, TP 1.1685

Euro Falls Near $1.18 as Dollar Strengthens and ECB Policy HoldsThe euro is trading around $ 1.18, just less than its highest levels in the four years reached earlier in the week, as the dollar rose after the decision of the Federal Reserve Policy. While in Europe, the European Central Bank left interest rates unchanged for the second meeting in a row last week, indicating that the interest rate reduction course may have ended.
Technically, the dollar recovery left the opportunity for the strength of the bears to dominate the momentum indicators for the 4-hour interval on the EURUSD pair, so the pair is likely to continue to decline during today's trading, targeting the next support levels around 1.1715, especially in case the support levels around 1.1735 do not succeed in stopping the price slippage

Sell EUR/USD to Fib level retracements.There is a clear short term reversal in EUR/USD usually to the Fib levels. 38.2 retracement is around 1.1717 so we might be in a 3 wave correction. There's a good chance wave B might spike into my Sell Limit entry.
Sell Limit : 1.1870 Approx Fib retracement
Stop : 1.19128
Profit : 1.1720 before 38.2% Fib retracement
Risk 1 : 3.5 stop is 43 pips

EURUSDHello Traders! 👋
What are your thoughts on EURUSD?
The pair is moving within an ascending channel, but after reaching a resistance zone, it has entered a corrective phase.
We expect the correction and sideways range to continue until the price reaches the support area.
From there, a bullish reaction could trigger the next upward move toward higher resistance levels.
As long as EUR/USD trades inside the channel and above the support, the bullish outlook remains valid.
Don’t forget to like and share your thoughts in the comments! ❤️

EURUSD Daily Forecast -Q3 | W38 | D19 | Y25|📅 Q3 | W38 | D19 | Y25|
📊 EURUSD Daily Forecast
🔍 Analysis Approach:
I’m applying Smart Money Concepts, focusing on:
Identifying Points of Interest on the Higher Time Frames (HTFs) 🕰️
Using those POIs to define a clear trading range 📐
Refining those zones on Lower Time Frames (LTFs) 🔎
Waiting for a Break of Structure (BoS) for confirmation ✅
This method allows me to stay precise, disciplined, and aligned with the market narrative, rather than chasing price.
💡 My Motto:
"Capital management, discipline, and consistency in your trading edge."
A positive risk-to-reward ratio, paired with a high win rate, is the backbone of any solid trading plan 📈🔐
⚠️ Losses?
They’re part of the mathematical game of trading 🎲
They don’t define you — they’re necessary, they happen, and we move forward 📊➡️
🙏 I appreciate you taking the time to review my Daily Forecast.
Stay sharp, stay consistent, and protect your capital
— FRNGT 🚀
FX:EURUSD

Price movement of the EUR/USD currency pairEUR/USD (Euro / US Dollar) Chart Analysis
This chart shows the price movement for the EUR/USD currency pair on a 1-hour (1H) timeframe. The data is from the OANDA broker, with a timestamp of 06:38 UTC on September 19, 2025.
1. Price Analysis (Top Chart)
Short-Term Trend: The price is in a downtrend since reaching its peak around 1.1900 on September 17.
Rebound Zone: There is a zone marked as "RETEST AREA" in the price range of 1.17993 to 1.18200. This area likely corresponds to the 50% and 61.8% Fibonacci Retracement levels. This is a critical area where the price previously dropped and then rose to test that resistance level.
Possible Scenarios:
If the price successfully rises and breaks through this "RETEST AREA," the downtrend could weaken or reverse.
Conversely, if the price touches this area and fails to break through, then moves back down, it would be a strong confirmation that the downtrend will continue. The dashed line pointing down indicates this potential movement.
2. Indicator Analysis (Bottom Chart)
RSI (Relative Strength Index) Indicator: The bottom chart displays the RSI indicator.
RSI Condition: The RSI line is currently below the 50 level, at 39.66. This indicates that market momentum is bearish, meaning selling pressure is more dominant than buying pressure.
Caution: The blue arrow points to a flattening or leveling of the RSI movement. This could suggest that the downtrend may be losing momentum, but there are no strong signs of a reversal yet.
Analysis Summary
Overall, the chart indicates that the EUR/USD pair is in a downtrend. Traders or investors looking at this chart would likely monitor the "RETEST AREA" (around 1.1800) as a key point. A break of this area or a failure to break it will provide clues for the next direction of price movement.
This analysis is technical and does not consider fundamental economic factors. Always perform a comprehensive analysis before making any trading decisions.

EURGBP Daily Forecast -Q3 | W38 | D19 | Y25|📅 Q3 | W38 | D19 | Y25|
📊 EURGBP Daily Forecast
🔍 Analysis Approach:
I’m applying Smart Money Concepts, focusing on:
Identifying Points of Interest on the Higher Time Frames (HTFs) 🕰️
Using those POIs to define a clear trading range 📐
Refining those zones on Lower Time Frames (LTFs) 🔎
Waiting for a Break of Structure (BoS) for confirmation ✅
This method allows me to stay precise, disciplined, and aligned with the market narrative, rather than chasing price.
💡 My Motto:
"Capital management, discipline, and consistency in your trading edge."
A positive risk-to-reward ratio, paired with a high win rate, is the backbone of any solid trading plan 📈🔐
⚠️ Losses?
They’re part of the mathematical game of trading 🎲
They don’t define you — they’re necessary, they happen, and we move forward 📊➡️
🙏 I appreciate you taking the time to review my Daily Forecast.
Stay sharp, stay consistent, and protect your capital
— FRNGT 🚀
FX:EURGBP
