EURUSD: ABC corrective moveEURUSD is likely to hold above the support of 1.1700 and extend the gains towards 1.18200 in the coming days.
USDEUR trade ideas

uptrend It is expected that we will witness the beginning of an upward trend within the current support level and will advance to the resistance trend line.
With the resistance level being broken, the upward trend will be confirmed.

EUR/USD – Buyers Holding the Mid-Channel SupportHello guys!
EUR/USD is still moving inside a clean ascending channel on the 4H chart. Price just bounced off the 1.1690–1.1700 support zone, which also lines up with the channel’s midline; a pretty solid area for buyers to step in.
As long as this zone holds, the bias stays bullish. If momentum continues, I’m looking for a move toward the 1.1760–1.1780 area, which is the top of the channel.
If price slips back under 1.1680, then this idea gets invalidated, and we could see a deeper pullback toward 1.1620.
For now, structure is intact, buyers are defending key levels, and the path of least resistance is still up.
Disclaimer: As part of ThinkMarkets’ Influencer Program, I am sponsored to share and publish their charts in my analysis.

EURUSD BOUNCE BACK BULLISH SCENARIO Overall Market Structure
The market is currently moving within a descending channel, showing a bearish trend since the last impulse leg.
Price is trading below the trendline, indicating that the sellers are still in control.
However, a short-term retracement (correction) is visible, suggesting a possible pullback before the next drop.
⚙️ Key Technical Areas
Resistance Area: Around 1.16680 – 1.17000
This zone aligns with the upper trendline of the channel.
It’s the next possible retest area before sellers may re-enter the market.
Support Area: Around 1.15000 – 1.15200
🔍 Current Price Action (1.1620)
Price is attempting to form a small corrective wave (shown near the “eye” symbol).
A pullback toward the minor trendline or the 1.1640–1.1668 region is expected.
If the price fails to break above the trendline resistance, a new bearish impulse leg may start toward 1.1550–1.1500.

WEEKLY EUR/USD OUT LOOK 06 TO 10 OCT 2025🧭 Chart Overview
Pair: EUR/USD
Bias: Bearish (structure shows lower highs and lower lows)
Key Zone:
Supply zone: 1.1740 – 1.1760 (on premium side of the dealing range)
Liquidity Sweep (Weekly): around 1.1830 – 1.1850
Targets (TPs):
First TP: 1.1645
Second TP: 1.1608
Third TP: 1.1573
The idea here: Market swept buy-side liquidity above previous weekly highs → tapped into a daily supply zone / FVG → expected to rebalance toward the discount side (below previous weekly lows).
📊 ICT Structure Breakdown
1. Higher-Timeframe (HTF) Context
On the Daily and H4, the trend is bearish.
Price is inside a daily fair value gap (FVG) + supply zone, showing premium conditions (good sell zone).
Weekly liquidity grab confirmed around 1.1850 area, indicating smart money distribution phase.
2. Market Objective
Draw liquidity from sell-side, below recent equal lows & old weekly swing lows.
Targets align with your TP zones (1.1645 / 1.1608 / 1.1573).
🧠 Entry Plan (LTF - 15min to 5min)
Step 1: Wait for LTF Market Structure Shift
Go to 15min or 5min chart.
Wait for price to retrace into the supply zone (1.1740–1.1760).
Inside that zone, identify:
Break of structure (BOS) to downside
A Fair Value Gap (FVG) formed after BOS
Possibly an Order Block (OB) just before the BOS candle.
Step 2: Entry Confirmation
Once BOS confirmed → mark the FVG / OB.
Entry can be:
Limit Entry: at the 50% of bearish OB or top of FVG.
Stop-Loss: just above the swing high / supply zone (≈ 1.1765–1.1770).
Risk:Reward around 1:4 to 1:6 targeting at least TP1 or TP2.
Step 3: Partial TPs
TP Level Price Logic
TP1 1.1645 Weekly sell-side liquidity (SSL)
TP2 1.1608 Next swing low & imbalance fill
TP3 1.1573 Full draw-on-liquidity to deeper discount zone
Step 4: Refinement (Optional)
If price fails to return to 1.1740, look for M5 structure shift below 1.1700 confirming continuation.
Re-entry using new FVGs or OBs on M5 after minor pullbacks.
🧩 Key Confluences
Weekly liquidity sweep ✅
Daily FVG + Supply ✅
Premium pricing ✅
Multiple downside liquidity pools ✅
Aligns with USD strength expectation (based on macro data & risk sentiment) ✅
⚙️ Example Setup Summary
Parameter Plan
Entry Zone 1.1740–1.1760 (5min FVG inside)
Stop Loss Above 1.1770
Targets 1.1645 → 1.1608 → 1.1573
Direction Sell
Risk:Reward ~1:5+
Trigger M5 BOS + FVG entry

EURUSD short Dolllar strength has started this week.
Price got a critical buyers zone and broke through it.
It formed a continuation pattern and broke out of it signalling stronger selling beyond buy zone.

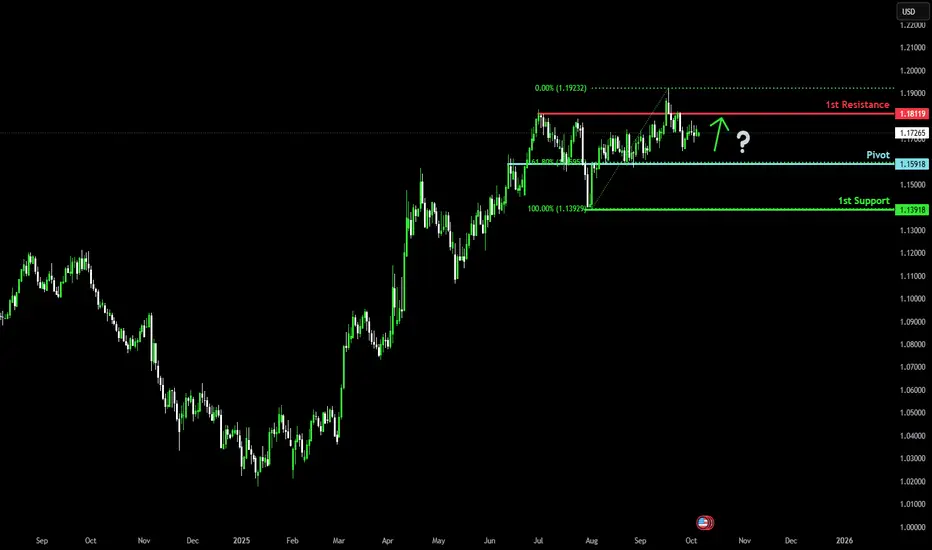
Potential bullish bounce setup?The Fiber (EUR/USD) is falling towards the pivot, which acts as an overlap support and could bounce to the 1st resistance.
Pivot: 1.1591
1st Support: 1.1391
1st Resistance: 1.1811
Disclaimer:
The above opinions given constitute general market commentary, and do not constitute the opinion or advice of IC Markets or any form of personal or investment advice.
Any opinions, news, research, analyses, prices, other information, or links to third-party sites contained on this website are provided on an "as-is" basis, are intended only to be informative, is not an advice nor a recommendation, nor research, or a record of our trading prices, or an offer of, or solicitation for a transaction in any financial instrument and thus should not be treated as such. The information provided does not involve any specific investment objectives, financial situation and needs of any specific person who may receive it. Please be aware, that past performance is not a reliable indicator of future performance and/or results. Past Performance or Forward-looking scenarios based upon the reasonable beliefs of the third-party provider are not a guarantee of future performance. Actual results may differ materially from those anticipated in forward-looking or past performance statements. IC Markets makes no representation or warranty and assumes no liability as to the accuracy or completeness of the information provided, nor any loss arising from any investment based on a recommendation, forecast or any information supplied by any third-party.
Euro may Break the 1.1550 Support LevelHello traders, I want share with you my opinion about Euro. The dominant market pressure for the Euro has been bearish since the price failed to sustain its rally to the 1.1920 high. This reversal initiated a significant downward trend for EURUSD, characterised by the breakdown of several key market structures, including the prior upward channel and the major 1.1740 resistance level. Currently, this bearish impulse has brought the price down to the major horizontal support level at 1.1550, an area which also coincides with a historical buyer zone. The price is now in a consolidation phase, attempting a minor corrective bounce from this support. In my mind, this bounce appears weak and lacks the momentum to signal a true reversal. I expect that this small upward movement will fail to attract significant buying interest and will soon be overcome by the prevailing selling pressure. I think a failure of this bounce will lead to a decisive breakdown below the 1.1550 support level. Therefore, I have placed my TP at 1.1510, targeting a new structural low in what I believe is a continuation of the primary downward trend. Please share this idea with your friends and click Boost 🚀
Disclaimer: As part of ThinkMarkets’ Influencer Program, I am sponsored to share and publish their charts in my analysis.

EUR-USD Bearish Bias! Sell!
Hello,Traders!
EURUSD breaks below the horizontal supply area and is now retesting it as new resistance. Smart Money distribution is evident, and bearish continuation toward the 1.1540 target is expected as inefficiency gets filled. Time Frame 6H.
Sell!
Comment and subscribe to help us grow!
Check out other forecasts below too!
Disclosure: I am part of Trade Nation's Influencer program and receive a monthly fee for using their TradingView charts in my analysis.

EURUSD | BSL Sweep → Bearish Delivery to BPR Target Almost DoneClean Smart Money move — BSL taken, structure shifted, and price delivering straight toward BPR.
After rejecting from the FVG in premium, EURUSD followed a textbook bearish model, aiming for the SSL & BPR zone below.
DXY strength confirms the bearish momentum continuation 📉
📊 Key Points:
BSL liquidity grab ✅
Bearish FVG in premium zone ✅
Structure shift & bearish delivery ✅
Target → BPR / SSL zone 🎯
Smart Money in full control — patience pays 🧠💰
This setup aligns with the DXY bullish projection, confirming inverse correlation and directional confluence.
#EURUSD #AliyanFX #SMC #ICT #PriceAction #Liquidity #FVG #BPR #Forex #TradingViewIdeas

EUR/USD — bearish trend continues.Market Overview:
The euro remains under pressure, trading below the 144 EMA within a descending channel. After a pullback toward 1.1750, the pair resumed its decline, forming lower highs and lower lows.
Technical Highlights:
144 EMA (1.1709) acts as dynamic resistance.
A break below 1.1610 will open the way toward 1.1530 support.
Downside potential extends to 1.1470–1.1500 (Fibonacci 1.382–1.618 extension zone).
Key Levels:
Resistance: 1.1700 – 1.1750
Support: 1.1530 – 1.1470
Scenario:
The base scenario suggests a continued decline toward the 1.1530 area, where buying interest may appear. Alternatively, a move above 1.1700 could trigger a correction to 1.1780.

EURUSD SHORTS IDEAIve entered EUR/USD shorts currently , the reason was there was liquidity sweep beside and align with 50percent retracement . Thats All targeted simple 1:2 Risk to Reward Ratio

EUR/USD Price Outlook – Trade Setup (EUR/USD)📊 Technical Structure
CMCMARKETS:EURUSD EUR/USD is trading near 1.1616, struggling to recover after breaking below the short-term trendline. Price action shows rejection from the 1.1636–1.1647 resistance zone, while downside momentum is supported by a descending channel structure. Sellers remain in control unless bulls reclaim resistance.
🎯 Trade Setup
Entry: 1.1636 – 1.1647 (Resistance Rejection Zone)
Stop Loss: 1.1652
Take Profit 1: 1.1583
Take Profit 2: 1.1571
Risk-to-Reward (R:R): ~1 : 4.12
🗝 Key Technical Levels
Resistance Zone: 1.1636 – 1.1647
Support Zone: 1.1571 – 1.1583
Current Price: 1.1616
🌍 Macro Background
Markets are increasingly concerned with G10 government debt sustainability, particularly France, the UK, and the US. The US Congressional Budget Office estimates the deficit at $1.8 trillion, while weak economic data continues to raise expectations for more Fed rate cuts this year. However, political instability in Europe (e.g., French government crisis) is keeping pressure on the euro. A cautious ECB stance, alongside market fears of fiscal slippage, may limit EUR/USD upside.
📌 Trade Summary
EUR/USD remains bearish below 1.1647 resistance. A rejection in this area could extend the decline toward 1.1571 support, in line with debt concerns and risk-off flows supporting USD.
⚠️ Disclaimer
This analysis is for reference only and does not constitute trading advice. Trading involves significant risk, and proper risk management is essential.

EURUSDI open the Long Position in EURUSD
15m TF
CHOCH
TP and Sl are Mentions
Follow the Risk Management

OCT 8: MMT + VOLUME PROFILE LOL LET'S SEE HOW IT GOESOCT 8: MMT + VOLUME PROFILE LOL LET'S SEE HOW IT GOES
Kinda getting lazy putting these descriptions here, or maybe I just don't want to at this point in time. just check the latest long position I made here and check it for yourself why I came to that conclusion lol.
but if not then here's the idea:
- TARGET/BIAS = WEEK TARGET + LVN + FVG (that price didn't fully mitigate/take over/ breakthrough etc)]
- NARRATIVE = FVA coming off of previous high breakout and continuation supported by RSI & CVD, + AVWAP FLIP
- ENTRY = FVA RE-TEST
That's it.

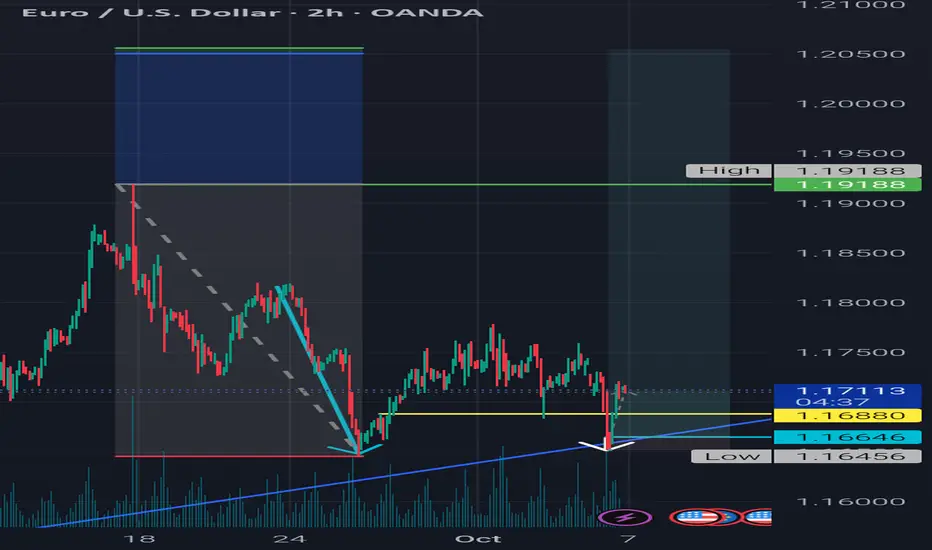
Momentum-Backed Retracement + Volume Retest | BadgerFX 📊 This setup establishes directional bias from the monthly chart (Current Bias: 📈 Bullish). The trade idea integrates momentum-driven retracements in line with this bias and validates continuation through structure and volume on the 15m.
📍 1.16880 confirmed the shift in structure, supported by volume, reinforcing alignment with the monthly trend. Final execution 🎯 relies on candlestick precision for entry timing.
⚠️ Disclaimer: The information shared here is for educational and entertainment purposes only and should not be considered financial advice.
BadgerFX 🦡 – Honey Badger Don’t Care
EURUSD: Next Move Is Up! Long!
My dear friends,
Today we will analyse EURUSD together☺️
The price is near a wide key level
and the pair is approaching a significant decision level of 1.16777 Therefore, a strong bullish reaction here could determine the next move up.We will watch for a confirmation candle, and then target the next key level of 1.17025.Recommend Stop-loss is beyond the current level.
❤️Sending you lots of Love and Hugs❤️

EURUSD 1H🔹 Overall Outlook and Potential Price Movements
In the charts above, we have outlined the overall outlook and possible price movement paths.
As shown, each analysis highlights a key support or resistance zone near the current market price. The market’s reaction to these zones — whether a breakout or rejection — will likely determine the next direction of the price toward the specified levels.
⚠️ Important Note:
The purpose of these trading perspectives is to identify key upcoming price levels and assess potential market reactions. The provided analyses are not trading signals in any way.
✅ Recommendation for Use:
To make effective use of these analyses, it is advised to manually draw the marked zones on your chart. Then, on the 15-minute time frame, monitor the candlestick behavior and look for valid entry triggers before making any trading decisions.

EURUSD H4 | Bearish Drop OffEUR/USD is rising towards the sell entry which is a pullback resistance and could reverse from this level to the downside.
Sell entry is at 1.1612, whichis a pullback resistance.
Stop loss is at 1.1664, whichis a pullback resistance that aligns with the 50% Fibonacci retracement.
Take profit is at 1.1530, which is a pullback support.
High Risk Investment Warning
Trading Forex/CFDs on margin carries a high level of risk and may not be suitable for all investors. Leverage can work against you.
Stratos Markets Limited (tradu.com ):
CFDs are complex instruments and come with a high risk of losing money rapidly due to leverage. 65% of retail investor accounts lose money when trading CFDs with this provider. You should consider whether you understand how CFDs work and whether you can afford to take the high risk of losing your money.
Stratos Europe Ltd (tradu.com ):
CFDs are complex instruments and come with a high risk of losing money rapidly due to leverage. 66% of retail investor accounts lose money when trading CFDs with this provider. You should consider whether you understand how CFDs work and whether you can afford to take the high risk of losing your money.
Stratos Global LLC (tradu.com ):
Losses can exceed deposits.
Please be advised that the information presented on TradingView is provided to Tradu (‘Company’, ‘we’) by a third-party provider (‘TFA Global Pte Ltd’). Please be reminded that you are solely responsible for the trading decisions on your account. There is a very high degree of risk involved in trading. Any information and/or content is intended entirely for research, educational and informational purposes only and does not constitute investment or consultation advice or investment strategy. The information is not tailored to the investment needs of any specific person and therefore does not involve a consideration of any of the investment objectives, financial situation or needs of any viewer that may receive it. Kindly also note that past performance is not a reliable indicator of future results. Actual results may differ materially from those anticipated in forward-looking or past performance statements. We assume no liability as to the accuracy or completeness of any of the information and/or content provided herein and the Company cannot be held responsible for any omission, mistake nor for any loss or damage including without limitation to any loss of profit which may arise from reliance on any information supplied by TFA Global Pte Ltd.
The speaker(s) is neither an employee, agent nor representative of Tradu and is therefore acting independently. The opinions given are their own, constitute general market commentary, and do not constitute the opinion or advice of Tradu or any form of personal or investment advice. Tradu neither endorses nor guarantees offerings of third-party speakers, nor is Tradu responsible for the content, veracity or opinions of third-party speakers, presenters or participants.

Is Your Money Safe in the Global Market?Introduction: Understanding Global Market Safety
In today’s interconnected financial world, investors from all corners of the globe participate in markets that span continents, currencies, and asset classes. From equities in New York and bonds in London to commodities in Dubai and emerging market funds in Asia — the global marketplace offers immense opportunities for growth. However, with great opportunity comes great risk. The question that often arises is: “How do I know my money is safe in the global market?”
Financial safety doesn’t mean avoiding risks entirely — it means understanding, managing, and minimizing them while ensuring that your wealth is protected from volatility, fraud, inflation, and geopolitical uncertainty. In this comprehensive guide, we’ll explore how to assess the safety of your investments, the factors influencing market stability, and practical steps to safeguard your money in the international financial system.
1. The Concept of Financial Safety in a Global Context
Before diving into protection strategies, it’s crucial to understand what “safety” means in the context of global markets. Investment safety can be broken down into several layers:
Capital Preservation: Ensuring your principal investment is not lost due to volatility or fraud.
Liquidity: Having the ability to convert your investments into cash without excessive losses.
Diversification: Spreading investments across regions and asset classes to minimize exposure to localized risks.
Regulatory Security: Investing under well-regulated jurisdictions that protect investors through strong legal frameworks.
Transparency: Having access to reliable information about the companies, governments, or institutions managing your money.
Safety doesn’t imply zero risk — it’s about making informed, balanced decisions in a world where both risks and rewards coexist.
2. Identifying Risks in the Global Market
Understanding where potential threats lie is the first step toward protecting your capital. Key global market risks include:
a. Market Volatility
Prices of stocks, commodities, and currencies fluctuate due to investor sentiment, economic data, and political events. Sudden crashes or corrections can erode investment value.
b. Currency Risk
Exchange rate fluctuations can significantly impact returns for investors holding assets denominated in foreign currencies.
c. Geopolitical Risk
Wars, sanctions, trade restrictions, and political instability can destabilize entire regions, affecting investments globally.
d. Inflation and Interest Rate Risk
Central banks across the world control monetary policy, and their decisions on interest rates can influence global asset prices and investor returns.
e. Corporate and Credit Risk
When investing in international bonds or equities, there’s a possibility that companies or governments might default or underperform.
f. Cybersecurity and Fraud Risk
In the digital age, online trading and fintech platforms are vulnerable to hacking and scams. Protecting your accounts and verifying platforms are critical steps.
By understanding these threats, investors can take strategic steps to defend against them.
3. How to Assess the Safety of Global Investments
To determine whether your money is safe, use a multi-dimensional approach. Ask yourself the following questions before investing:
a. Who Regulates the Platform or Institution?
Ensure the financial institution is licensed under credible authorities like the U.S. SEC, UK FCA, or Monetary Authority of Singapore (MAS). These regulators impose strict rules to protect investors.
b. What is the Level of Transparency?
Trustworthy institutions publish audited financial statements and disclose their operations clearly. Lack of transparency is a red flag.
c. How Liquid Are My Investments?
Can you easily sell your assets or withdraw your funds? Illiquid markets can trap investors during crises.
d. What is the Risk Profile of the Asset Class?
Stocks, bonds, commodities, and cryptocurrencies all carry different risk levels. Balancing them according to your goals ensures stability.
e. How Diversified Is My Portfolio?
Investing across regions, sectors, and asset types minimizes exposure to localized risks.
f. Is There Insurance or Protection?
Check if your investments are covered by schemes like FDIC insurance (U.S.), Investor Compensation Scheme (U.K.), or equivalent programs in other countries.
4. The Role of Diversification in Safeguarding Money
Diversification is the cornerstone of global financial safety. By spreading investments across:
Geographies (U.S., Europe, Asia, Emerging Markets)
Asset Classes (Stocks, Bonds, Gold, Real Estate, Mutual Funds, ETFs)
Currencies (USD, EUR, GBP, JPY, INR, etc.)
…you can reduce the impact of any one region or market downturn. For example, when U.S. stocks fall, gold or Asian markets may rise, balancing your portfolio.
A well-diversified portfolio doesn’t guarantee profits, but it reduces the likelihood of catastrophic losses — ensuring long-term sustainability.
5. Importance of Financial Regulation and Investor Protection
Global financial safety relies heavily on regulatory systems. Reputable markets have robust laws to ensure:
Transparency and disclosure
Investor compensation in case of fraud
Clear operational standards for brokers and fund managers
Protection against insider trading and manipulation
When choosing a platform or institution, verify its regulatory license. Always invest through brokers and fund houses that are registered with major global regulatory authorities.
Avoid unregulated platforms that promise unrealistic returns — these are often scams or Ponzi schemes.
6. The Role of Technology and Cybersecurity in Financial Safety
Modern investing heavily depends on online trading platforms, mobile apps, and digital wallets. While technology provides convenience, it also introduces cyber risks.
To keep your investments safe:
Use two-factor authentication (2FA) on all trading accounts.
Never share passwords or OTPs.
Avoid public Wi-Fi while accessing trading apps.
Regularly monitor account statements for suspicious activities.
Ensure your broker uses end-to-end encryption and regulated payment gateways.
Financial cybersecurity is not just a company’s responsibility — it’s also a personal discipline.
7. Safe Haven Assets and Hedging Strategies
During global uncertainty — such as recessions, wars, or inflation spikes — investors often move their capital into safe haven assets, which tend to retain value.
These include:
Gold: A timeless hedge against inflation and currency devaluation.
U.S. Treasury Bonds: Considered among the safest investments globally.
Swiss Franc (CHF): A historically stable currency.
Blue-chip Stocks: Established multinational companies with strong fundamentals.
Hedging techniques like currency hedging, options, and futures can also protect against downside risks in volatile markets.
8. Evaluating the Global Economic Environment
Keeping your money safe requires staying informed about macroeconomic trends. Watch for:
Central bank policies (interest rates, quantitative easing)
Inflation data and GDP growth rates
Trade balances and foreign exchange reserves
Corporate earnings reports
A global investor must think beyond local borders — a policy shift in Washington or Beijing can influence markets from Mumbai to London.
9. Psychological Safety: The Human Element in Investing
Emotional decision-making often leads to poor investment choices. Fear and greed drive volatility more than data does. To ensure your money remains safe:
Avoid impulsive trading during market crashes.
Stick to a disciplined investment plan.
Set clear stop-loss levels and profit targets.
Regularly review and rebalance your portfolio.
Remember, the most dangerous element in investing isn’t the market — it’s the investor’s reaction to it.
10. Long-Term vs. Short-Term Safety
Short-term safety focuses on liquidity and minimizing volatility — ideal for emergency funds or near-term goals.
Long-term safety depends on inflation-beating growth through strategic diversification.
Balancing both ensures you don’t just protect your money — you grow it steadily over time.
11. The Future of Financial Safety: AI, Blockchain, and Transparency
Emerging technologies are redefining investment safety:
Blockchain ensures transparent and tamper-proof transactions.
Artificial Intelligence (AI) helps in fraud detection and portfolio optimization.
Decentralized Finance (DeFi) platforms are creating new ways for secure global investments — though they carry new types of risks.
The future of financial safety will be shaped by technology-led transparency, enabling investors to make more secure decisions globally.
12. Steps to Ensure Your Money Is Safe in the Global Market
Here’s a practical checklist every investor should follow:
Choose regulated brokers or financial institutions.
Diversify across asset classes and regions.
Use strong cybersecurity measures.
Avoid high-return, low-transparency schemes.
Monitor your investments regularly.
Stay informed about global macroeconomic trends.
Have an exit strategy and emergency plan.
Seek advice from certified financial advisors.
Financial safety is not a one-time act — it’s a continuous process of education, vigilance, and adaptation.
Conclusion: Security Through Knowledge and Strategy
The global financial market will always carry a mix of risk and reward. True safety doesn’t lie in avoiding risk entirely but in understanding and managing it wisely. By staying informed, diversifying strategically, using regulated platforms, and leveraging technology responsibly, investors can ensure that their money remains protected — no matter how volatile or uncertain the global landscape becomes.
In essence, your money’s safety depends not just on where you invest, but how you invest. With discipline, awareness, and smart planning, your wealth can thrive securely in the ever-evolving global marketplace.

Bulls Coiled at Fortress Support - Bears Last Stand📊 **To view my confluences and linework:**
Step 1️⃣: Grab the chart
Step 2️⃣: Unhide Group 1 in the object tree
Step 3️⃣: Hide and unhide specific confluences one by one
💡 **Pro tip:** Double-click the screen to reveal RSI, MFI, CVD, and OBV indicators alongside divergence markings! 🎯
Title: 🎯 EURUSD: Bulls Coiled at Fortress Support - Bears' Last Stand
The Market Participant Battle:
In the theater of forex war, bears have systematically pushed EURUSD from the September highs at 1.1918 down to critical daily support at 1.1610-1.1620. The ongoing US government shutdown has created a data blackout for the Federal Reserve, with markets now pricing in a 100% probability of another rate cut on October 28-29. While French Prime Minister Lecornu's resignation initially pressured EUR, that news is three days old and absorbed.
Bears have driven price into a proven support zone where institutional buyers previously stepped in (Point 2 in the analysis). Point 3's close above Point 1 established this level as battle-tested, and now at Point 4, we're witnessing the return to these proven market participants. The setup is elegant: bears have exhausted their ammunition pushing into this fortress, while bulls are loading up with fresh conviction at precisely the level where they previously won decisively.
The higher timeframe context is crucial: while EURUSD is in a short-term downtrend, on the daily timeframe we've returned to major support around 1.1686-1.1663. This isn't just any support - it's where the tide turned before, and technical indicators combined with order flow analysis confirm that history is about to repeat itself.
Confluences:
Confluence 1: Bullish Divergence - The Silent Alarm
The 1-hour chart reveals a textbook bullish divergence setup. From Point 2 to Point 4, price has carved out a higher low structure - bulls refusing to give up ground. Meanwhile, both RSI and MFI have made lower lows, creating a widening gap between price action and momentum indicators. Current technical analysis shows RSI approaching oversold territory with readings near 40, while analysts note that further losses have pushed indicators toward oversold levels.
This divergence is particularly potent because it's occurring at a proven support zone, not in no-man's land. The RSI and MFI aren't just oversold - they're coiled like springs ready to snap back. When momentum indicators refuse to confirm new lows while price makes marginal new lows, it's the market's way of telegraphing exhaustion. Bears are running on fumes.
**Analysis**: This confluence AGREES ✓ with the bullish thesis. Divergence at support is one of the highest-probability setups in technical analysis, especially when confirmed by multiple momentum indicators.
Confluence 2: Andrews Pitchfork #1 - The Geometric Truth
Using Points 1, 2, and 3 as anchors, the reverse Andrews Pitchfork reveals Point 4 sitting precisely on the median line - a gravitational center where price naturally seeks equilibrium. Pitchfork analysis works because it maps the natural rhythm of price movement, and the median line acts as a magnet.
The significance here is profound: institutional algorithms and professional traders use pitchfork analysis to identify high-probability reversal zones. When price touches the median line of a properly constructed pitchfork at a support level while showing divergence, it's like having three confirming votes for a reversal.
**Analysis**: This confluence AGREES ✓ with the bullish thesis. The median line touch at a proven support zone dramatically increases the probability of a bounce.
Confluence 3: Andrews Pitchfork #2 - Double Confirmation
The second pitchfork, constructed using an alternative pivot set, independently confirms Point 4 as a turning point. When two separate geometric analyses converge on the same price level, it's no longer coincidence - it's confluence. This is where market geometry and price action align.
The power of this double pitchfork setup is that it removes doubt. One pitchfork might be subjective, but two pitchforks from different pivot sets pointing to the same reversal zone? That's mathematical confirmation that we're at a significant structural level.
**Analysis**: This confluence AGREES ✓ with the bullish thesis. Independent geometric confirmation strengthens the reversal case significantly.
Confluence 4: Anchored VWAP - Volume's Verdict
The Anchored VWAP reveals institutional positioning with surgical precision. Price rejected at the 1st standard deviation and has already shown bullish movement from this level. The current pullback to Point 4 represents a second chance entry - a gift from the market to latecomers.
VWAP is the institutional trader's compass. When price pulls back to AVWAP standard deviations at support zones, it's institutions giving you a second bite at the apple. The fact that we've already seen one bullish reaction from this level tells us buyers are active and willing.
**Analysis**: This confluence AGREES ✓ with the bullish thesis. AVWAP rejection at support with prior bullish reaction is a high-conviction signal.
Confluence 5: Order Flow Reversal - Footprint Confirmation
The volume footprint reveals the critical story that price action alone cannot tell. The order flow sequence shows a textbook reversal pattern:
Phase 1 - False Start: Initial bounce attempt showed negative delta on green candles (sellers absorbing buying pressure) - a warning sign that the first reversal attempt failed.
Phase 2 - Capitulation: Heavy selling pressure culminated in Delta -250 on 6.11K volume - this represents seller exhaustion, the "puke" moment where weak hands exit. This was followed by diminishing negative delta (-68 on 5.3K volume), showing selling pressure waning.
Phase 3 - Order Flow Flip: The most recent significant candle showed Delta +133 on 5.54K volume - buyers aggressively lifting offers. This represents the critical flip from seller control to buyer control.
Phase 4 - Low Volume Consolidation: Current tiny positive delta (+10 on 266 volume) reflects low-liquidity period between Asian close and European open, not buyer exhaustion.
This creates a bullish delta divergence: price tested similar lows multiple times, but delta improved progressively from -250 to -68 to +133. Each test of support showed less seller aggression and more buyer interest. This is exactly what you want to see before a reversal - diminishing selling pressure followed by aggressive buying.
**Analysis**: This confluence STRONGLY AGREES ✓✓ with the bullish thesis. The order flow reversal from heavy negative delta to strong positive delta at support is textbook reversal behavior and provides real-time confirmation that the technical setup is valid.
Confluence 6: Daily Support Zone - The Institutional Floor
Multiple technical analysts have confirmed support at 1.1590-1.1663 as a critical zone, with the broader bullish structure remaining intact as long as 1.1390 support holds, and the 200-day SMA sitting at 1.1208. Current price action at 1.1610-1.1620 sits directly within this proven institutional support zone.
The daily timeframe provides crucial context that the 1-hour chart cannot: we're at a level where institutions previously accumulated positions. Historical seasonality shows October has been a bullish month for EURUSD, adding another layer of probabilistic advantage.
**Analysis**: This confluence AGREES ✓ with the bullish thesis. Multi-timeframe support alignment is a cornerstone of high-probability setups.
Confluence 7: Proven Market Participants at Point 2
The analysis correctly identifies Point 2 as a set of "proven market participants" - buyers who stepped in decisively and pushed price up to close Point 3 above Point 1. This established a higher low structure and proved that this price level has institutional support.
Now at Point 4, we're returning to these exact same buyers. This is the market's memory in action: institutions that accumulated at Point 2 are likely to defend that level again, as it represents their average entry price and a zone they've already validated through action.
**Analysis**: This confluence AGREES ✓ with the bullish thesis. Market memory and institutional positioning strongly favor a bounce from this zone.
Web Research Findings:
- Technical Analysis: EURUSD trading at confirmed support zone 1.1663-1.1686, with medium-term uptrend intact above 1.1390. Technical indicators showing bearish divergence on daily charts but oversold conditions on lower timeframes. Resistance at 1.1918 (2025 high), with key support at 1.1390 (August lows).
- Recent News/Earnings: French Prime Minister Sebastien Lecornu resigned October 6 after only 27 days in office, making him the shortest-serving PM in modern French history. The resignation followed a failed cabinet announcement and has deepened France's political crisis. France's deficit stands at 5.8% of GDP with debt at 114% of GDP. The euro fell 0.5-0.7% on the resignation news, with French CAC 40 dropping 1.6-2%. This news is now three days old and largely priced in.
- Analyst Sentiment: Mixed views from analysts. Some analysts calling for bearish bias with targets toward 1.1450-1.1500, while others recommend buying from support levels at 1.1540-1.1590 with targets toward 1.1700-1.1780. Some analysts issued bullish signals in early October with take-profit at 1.1850. No overwhelming consensus (not 80%+ either direction), suggesting this is a legitimate contrarian opportunity.
- Data Releases & Economic Calendar: US government shutdown began October 1 and has halted release of key economic data including jobs reports, CPI, and other BLS data. The Fed will potentially make its October 28-29 rate decision "flying blind" without updated labor market data. Jerome Powell spoke October 9 but remained dovish amid shutdown chaos. Initial jobless claims and other private data still being released.
- Interest Rate Impact: Markets pricing in 100% probability of 25bps Fed rate cut at October 28-29 meeting, with 88% probability of December cut. Fed officials showed 10-9 split at September meeting, with slight majority favoring two more quarter-point cuts by year-end. ECB expected to maintain rates steady as inflation has remained near 2% target. This rate differential strongly favors EUR strength.
Layman's Summary:
Here's the situation in plain English: The US government is shutdown, which means the Federal Reserve doesn't have the economic data it normally uses to make decisions. This is actually GOOD for the Euro because it means the Fed is almost certainly going to cut interest rates at their meeting on October 28-29 (the market says there's a 100% chance). When the Fed cuts rates, it makes the US Dollar weaker, which makes the Euro stronger.
Yes, France is having political problems - their Prime Minister just quit after less than a month on the job, which is embarrassing and caused the Euro to drop initially. BUT that news is already three days old and mostly priced in. The Euro fell about 0.5-0.7% on that news and has stabilized.
The bigger story is the US shutdown and Fed rate cuts. Every analyst agrees more rate cuts are coming from the Fed, while Europe's central bank is holding steady. That interest rate difference favors the Euro going up.
The order flow (the real-time buying and selling data) shows that sellers just exhausted themselves with heavy selling (Delta -250), and now buyers are taking control (Delta +133). This is exactly what happens at major turning points - sellers puke out their positions, then buyers step in aggressively.
Technical analysts are split - some say go down, some say go up from here. But here's the key: we're sitting at a major support level that has held multiple times. October is historically a good month for the Euro. And all the technical indicators (divergence, geometric patterns, volume analysis, AND order flow) are saying "this is where buyers show up."
Bottom line: The Euro took a hit from French politics, but that's old news. The fresh catalyst is US dollar weakness from the shutdown and upcoming Fed cuts. You're buying at a proven support level with multiple technical confirmations AND order flow confirmation. Risk/reward looks excellent.
Machine Derived Information:
- Image 1 (1H Chart with Parallel Channels): Shows price action contained within descending parallel channels with numbered reference points 1-4. Point 2 represents a low, Point 3 a high closing above Point 1, and Point 4 the current potential reversal zone within the channel support. Significance: Establishes the geometric framework and shows price respecting channel boundaries, suggesting Point 4 as a high-probability bounce zone at channel support. **AGREES ✓**
- Image 2 (Zoomed Pattern Analysis): Displays detailed pattern structure with black trendlines highlighting the higher low formation from Point 2 to Point 4. Shows consolidation and price coiling at support. Significance: Reveals the micro-structure of price compression at support, indicating diminishing bearish momentum and potential energy buildup for reversal. **AGREES ✓**
- Image 3 (Descending Trendlines with Pitchfork): Shows broader descending trendline structure with the same 1-2-3-4 pattern highlighted. Displays geometric resistance overhead. Significance: Provides higher timeframe context showing Point 4 as a confluence of channel support, horizontal support, and geometric turning point within a larger downtrend structure. **AGREES ✓**
- Image 4 (Full Indicator Suite): Comprehensive view showing OBV (declining), RSI (with bullish divergence marked), MFI (oversold), and CVD Candles (mixed but showing recent buying). Key observation: RSI shows clear bullish divergence labels at Point 2 and Point 4, while MFI also confirms oversold conditions. Significance: Multi-indicator confirmation of momentum divergence at support - RSI and MFI both show oversold readings with positive divergence against price action. This is textbook reversal setup confirmation. **AGREES ✓**
- Image 5 (Clean Pattern View): Stripped-down view showing the 1-2-3-4 pattern formation with horizontal support clearly marked. Shows Point 4 sitting precisely at horizontal support level. Significance: Removes noise to highlight the core setup - a clear higher low at proven support with geometric and structural confluence. **AGREES ✓**
- Image 6 (Higher Timeframe Structure): Daily/4H chart showing the broader context with Points 2-3-13/14. Displays horizontal support line that aligns with 1H Point 4. Text notes indicate hidden bullish divergence on this timeframe as well. Significance: Confirms multi-timeframe alignment - the 1H support at Point 4 coincides with higher timeframe support at Points 13/14, dramatically increasing reversal probability. **AGREES ✓**
- Image 7 (Volume Footprint): Real-time order flow analysis showing the evolution from seller capitulation (Delta -250) to buyer aggression (Delta +133). Displays the complete sequence: false start with negative delta, heavy capitulation selling, diminishing pressure, then order flow flip to positive. Significance: Provides the missing piece that price action alone cannot show - WHO is in control at the microstructure level. The progression from -250 to +133 delta confirms that sellers exhausted and buyers took control, validating all technical confluences with real-time market behavior. **STRONGLY AGREES ✓✓**
Actionable Machine Summary:
All seven images unanimously support the bullish reversal thesis. The machine analysis reveals a textbook setup where:
1. **Geometric Patterns**: Multiple pitchfork and channel analyses independently confirm Point 4 as a high-probability turning point
2. **Momentum Indicators**: Clear bullish divergence on both RSI and MFI, with both indicators in oversold territory
3. **Volume Analysis**: While OBV shows some decline (indicating distribution), CVD shows recent buying interest, and AVWAP confirms institutional support at this level
4. **Pattern Structure**: Clean higher low formation (Point 2 to Point 4) with Point 3 closing above Point 1, establishing proven buyers at this zone
5. **Multi-Timeframe Alignment**: Channel support on 1H aligns with daily support zone (Points 13/14) confirmed by multiple analysts
6. **Order Flow Confirmation**: Footprint analysis shows textbook reversal sequence - capitulation (Delta -250), diminishing selling pressure (Delta -68), then aggressive buying (Delta +133). This is the real-time validation that the technical setup is actively playing out.
The machine-derived conclusion is unequivocal: this is a high-conviction reversal setup with seven independent confluences all pointing to bullish resolution from current levels. The setup quality is enhanced by the fact that we're at a second-chance entry (the pullback) rather than chasing the initial bounce. Most importantly, the order flow has flipped from seller control to buyer control, providing real-time confirmation that the reversal is underway.
Conclusion:
**Trade Prediction: SUCCESS ✅**
**Confidence: HIGH**
Key Reasons for Success:
1. **Seven Strong Confluences Aligned**: Bullish divergence (RSI + MFI), two independent Andrews Pitchforks, AVWAP support, order flow reversal (footprint), daily support zone, and proven market participants at Point 2 - all converging at Point 4. This level of confluence is rare and powerful.
2. **Order Flow Reversal Confirmed**: The volume footprint shows the textbook sequence every trader wants to see: seller capitulation (Delta -250) followed by buyer aggression (Delta +133). This bullish delta divergence - where delta improved from -250 to -68 to +133 as price tested similar lows - is the real-time confirmation that the technical setup is valid and actively reversing.
3. **Fundamental Backdrop Supports EUR Strength**: US government shutdown forcing Fed into rate cuts (100% probability priced for Oct 28-29), which weakens USD. ECB holding rates steady, creating favorable interest rate differential for EUR. Fed officials split but majority favoring continued cuts through year-end.
4. **French Political Crisis Already Priced**: Lecornu resignation occurred October 6, EUR already dropped 0.5-0.7% and has stabilized. Three-day-old news is largely digested by the market. Market has moved on to focus on USD weakness.
5. **Technical Structure Intact**: EURUSD bullish structure remains intact above 1.1390, with 200-day SMA at 1.1208 providing major support. Current price at 1.1610-1.1620 is well within the bullish framework. Multiple timeframe support alignment at this level.
6. **Seasonality Favorable**: October historically bullish month for EURUSD, adding probabilistic tailwind to the setup.
7. **Second-Chance Entry**: Price already bounced once from AVWAP level and is now offering a second entry opportunity - lower risk entry point with proven buyers present. Stop order at 1.1620 ensures entry only on momentum confirmation.
Key Risks (Managed by Stop Loss):
1. **French Political Contagion**: If France's political crisis escalates dramatically or triggers broader European instability, EUR could face renewed selling pressure. However, markets have shown resilience to political chaos so far.
2. **Unexpected Hawkish Fed Pivot**: While unlikely given shutdown and data blackout, if new Fed communications signal unexpected hawkishness, USD could strengthen temporarily.
3. **Support Break**: If price closes below 1.1590 on daily timeframe, the bullish structure would be compromised and invalidate the setup. Order flow would also need to flip back to negative delta.
4. **New Negative Catalyst**: Unforeseen geopolitical or economic shock could override technical setup and fundamental backdrop.
5. **Order Flow Fake-Out**: While current delta shows +133 reversal, if subsequent candles flip back to heavy negative delta on increased volume, the reversal attempt would be invalidated.
Risk/Reward Assessment:
With entry via stop order at 1.1620 and stops below 1.1585 (35 pips), targets toward prior resistance at 1.1750-1.1800 (130-180 pips) offer 3.7:1 to 5.1:1 risk/reward. The confluence density at this support level dramatically improves the probability of at least partial profit-taking at 1.1680-1.1700 levels (60-80 pips, or 1.7:1 to 2.3:1 R/R).
Given seven aligned confluences, order flow reversal confirmation, favorable fundamental backdrop (Fed cuts vs ECB steady), confirmed daily support, and excellent risk/reward, this trade setup exceeds the quality threshold for execution.
Final Recommendation: TAKE THE TRADE ✅
The market participant battle is clear: bears have pushed into fortress support where proven institutional buyers reside. With Fed rate cuts incoming, French political news absorbed, multiple technical confirmations, order flow reversal validated via footprint, and historical seasonality as tailwinds, bulls are positioned to reclaim control. The setup offers high conviction with manageable risk.
**Suggested Execution**:
- Entry: Stop order at 1.1620 (momentum confirmation) OR market order at current 1.1610-1.1615
- Stop Loss: 1.1585 (below daily support and capitulation low)
- Target 1: 1.1680-1.1700 (take 30-40% profits, ~2:1 R/R)
- Target 2: 1.1750 (take another 30-40%, ~4:1 R/R)
- Target 3: 1.1800-1.1850 (final position target, ~5-7:1 R/R)
Position sizing should reflect your risk tolerance, but this setup warrants standard to slightly increased size given confluence quality, order flow confirmation, and favorable risk/reward profile. The stop order at 1.1620 is prudent as it waits for momentum confirmation while still capturing the majority of the move.
**Monitor order flow closely**: As European session opens and volume increases, watch for continued positive delta expansion (+150, +200, +250). This will confirm buyers are maintaining control. Any flip back to heavy negative delta would be a warning sign to tighten stops or exit.

Key levels on EURUSDYesterday, EURUSD moved down to test the first support level and bounced off.
It’s still possible we’ll see another dip into the support zone and a reaction from lower levels.
The overall target remains a continuation of the uptrend!

EUR/USD Bullish SetupEURUSD has successfully taken daily SSL, so there is a good chance to get a long possition after taking BMS on 1h timeframe .
