Timeline - Ruble Surpases Pre-Invastion Standing Against USDRUB/USD Ruble Surpases Pre-Invastion Standing Against USD
The chart breaks down a timeline of major events on daily chart. Feel free to comment with events that could be added.
Trade ideas


My longterm view at USDRUB pair: STRONG short.Looks like there is no chance to see 90-100 area soon in this pair. Be carefully if you are playing againts the Rubble.

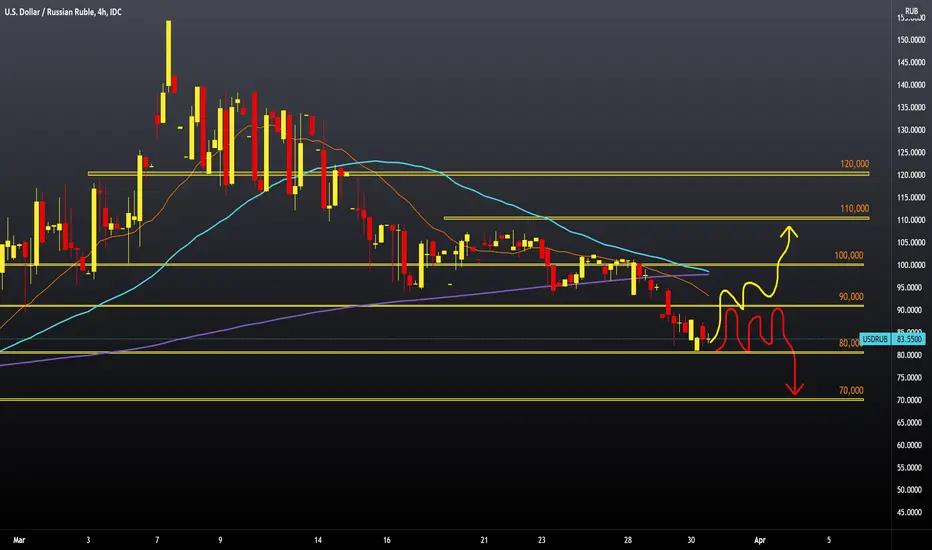
Looks like a flag. Let's see if ABCD pattern happens or not. I prefer to short USDRUB pair in shortterm based on fact that probable flag was almost broken downside. However, a break could be a false one. That's why Risk management is absolutely mandatory here. Always base only on your own decisions.

RUBUSD: - an opportunity to place a longDespite the unstable political background and the collapse of the Russian stock market (my bonds are not in the best shape now), I think that this is a great opportunity to buy the ruble cheaper. All the fuss about Ukraine will be temporary, because Putin is not an idiot.
The nearest price corridor is 0.0132 and the main part of the trades will take place there.

USDRUB at support zonePair USDRUB tested 75,000 levels again on Friday, while today, we see a return above 80,000 levels. Moving averages of MA20 and MA50 range around 80,000 levels. The ruble is now at the level before the invasion of Ukraine. The sanctions imposed by the EU, America and their allies have failed to overthrow the Russian ruble and destabilize the Russian financial system. In general, the sanctions returned like a boomerang to the Western world's economies, which led to an increase in inflation in all trade segments. We cannot rule out that the ruble will continue to strengthen until the invasion of Ukraine is over. We expect the USDRUB pair in the current zone of around 80,000 to find support and embark on a new bullish boost for our bullish option. Our first important target is the 100,000 level, where the MA200 moving average awaits us as additional resistance. A break above would boost bullish optimism.

Patience on the Ruble with Olmec Strategy ENG / ESP
ENG
The Ruble faces strong resistance at the 0.0121 level and the question remains;
Has it already flipped the previous level for support?
In my opinion this has not yet happened and the entry remains in the same position as in the previous post.
Personally I did not expect such a strong rally after the trend changed. I expected a much more aggressive selling despite the trend change given the combination of events on the ground and changes to natural gas purchasing agreements.
By inverting the Price volume trend we can see more clearly that the current volume is unsustainable.
I am expecting a 10 - 15% price decrease in the Ruble in the next few days.
ESP
El Rublo enfrenta una fuerte resistencia en el nivel de 0.0121 y la pregunta permanece;
¿Ya ha cambiado el nivel anterior por soporte?
En mi opinión esto aún no ha sucedido y la entrada se mantiene en la misma posición que en la publicación anterior.
Personalmente, no esperaba un repunte tan fuerte después del cambio de tendencia. Esperaba una venta mucho más agresiva a pesar del cambio de tendencia dada la combinación de eventos sobre el terreno y cambios en los acuerdos de compra de gas natural.
Al invertir la tendencia del volumen del precio, podemos ver más claramente que el volumen actual es insostenible.
Espero una disminución del precio del rublo del 10 al 15% en los próximos días.


RUS's 5000/RUB/gram of Gold converted to implied USD COMEX valueRussia pegged its Rubles to Gold of 5,000 RUB/gram.
This is the implied value of Gold per troy oz. as shown in the paper Gold market (COMEX) in USD.
Will be the floor price of Gold

KREMLIN PATTERNTotaly new pattern in world trading!!! KREMLIN!!!
All yoy knew before now forget! There is no sense!

Russia is downThere's no reason for RUB to be strong.
Only when people realize what they've done, and they will elect the democracy government.

Russian Ruble on the verge of a devaluation I haven't traded a trend in forex for years - this is the best looking currency chart I've seen in a VERY long time.
50 month MA
Tightening base
Close to a breakout from the pennant
Obviously unsure what the reasoning for this is, but I'd expect a catalyst sometime in 2022 that could send the ruble down double digit %

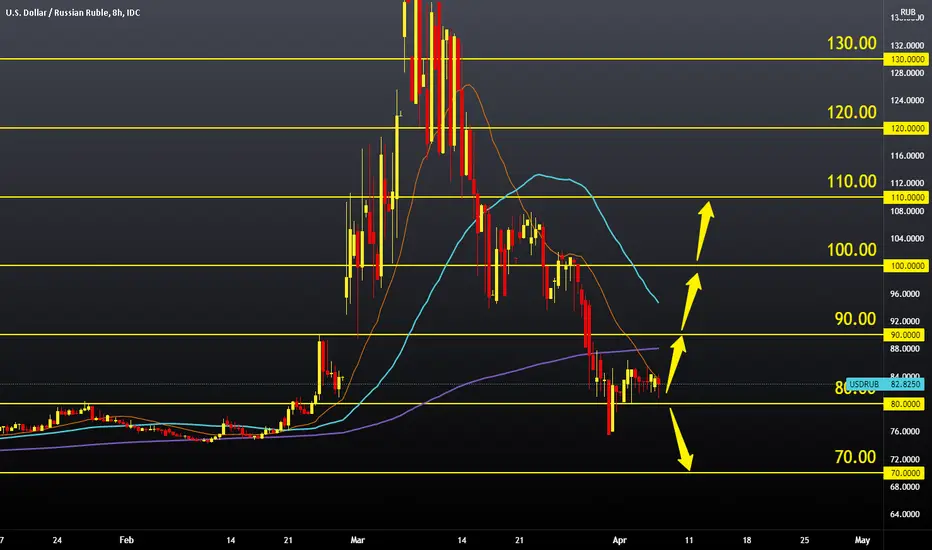
USDRUB at support zoneThe pair fell to a low of 75,600 on March 31, after which it moves this week in the range of 80,000-86,000. We are currently at 83,950, and we can say that the USDRUB is stable for now after a stormy March. Now we are back in the pre-war zone of movement in Ukraine. At the current level, we can expect the pair to continue towards 90,000 and make a new turn to the bullish side. For the bullish option, we need USDURB growth above 90,000, and then we would get support in MA20 and MA50 moving averages. Our next bullish target is the zone at 100,000, and the additional resistance at that level is in the MA200 moving average. A break above would boost bullish optimism. We need a new drag below 80,000 levels for the bearish option, and our first potential support is at 70,000 levels. In the range of 70,000-80,000, the pair moved during 2020 and 2021.


Version 2. The Troy ounce calculation needed correctingThere was a slight error in the troy ounce calculation that has now been updated.

Olmec Strategy in Ruble / USD exampleDescription of Analysis. Context. Thought Process. Profit target & stop loss.
Description;
The ruble / USD is a great place to explain and the Olmec strategy.
The Olmec strategy is a simple and effective way to read price action using Moving Averages and the Price Volume Trend;
Moving averages are used to spot trend reversals, maintain positions open or short and find precise entry and exit points.
The Price Volume Trend is then used to re-affirm the
Context;
Background on the RUB / USD pairing;
For the last 30 years since the fall of the USSR, the USA and the European Union have fulfilled their economic and military agendas.
This is not fiction but rather fact. The USD and Euro have made this a reality by being the preferred medium of exchange at the expense of other currencies and so for the last 30 years we have seen the steady selling of currencies like the Ruble in exchange for Dollars or Euros.
Thought process;
From today the 31st of March 2022 Russia will only accept rubles as payment for Russian natural gas.
While most European countries have opposed this, the chart shows a change in trend for the heavily discounted Ruble.
Current entry is at 0.0106

The world on the brink of tectonic shifts.Not legal and financial advice;
Any information provided here is only the personal opinion of the author.

USDRUB March 20221. Freezing the reserves of the Central Bank of Russia is a stupid move (this is default of western financial values).
2. Freezing the assets of the big oligarchs is an even sillier move.
You can't demand the overthrow of Putin and take money away from those who oppose him. And this is happening right now.
3. Total ban on dissent in Europe and the United States.
4. Reason is lost in the US and of course the Euro-Atlantist puppets in Brussels are also economically killing their peoples in Europe.
Macron said about the ration cards.... Maybe he wants a cake?
5. The migration crisis from Ukraine will still have a negative impact. (The number of crazies there was off the charts before, and it's going to be even worse now.)
6. You can't replace gas supplies to Europe faster than 6-7 years and that would be an inflationary shock.
7. Hunger in Africa is a reality this year.
All of Africa will run to Europe, maybe even with guns.
8. If Russia transfers trade in energy resources to domestic exchanges and for the Russian ruble, it will be the beginning of a new trend.
In this case, I would bet on Russian assets.
9. Let's wait, for a while, until the end of active hostilities and the signing of peace treaties.
TSTW.

USDRUB- BUY strategy I am not condoning or suggesting you trade this currency pair.
I use this pair as a sign for what the financial market is feeling about the ongoing crisis only.
I had suggested some weeks back a sell strategy when we reached levels of $ 120-130 and higher. I suspected it would move back towards 100.00 level, but it even improved itself beyond expectations.
the reason am saying that is not to prove I was right, rather to display the fact that the markets are absolutely irrational. Just think of it, now we are not far away from where the RUB was before the crisis... Crazy right?
So based on that U feel we are not at the right level for good fundamental and technical reasons. I expect the USDRUB to return beyond 110.00 again. DO NOT TRADE IT PLEASE...

The Russian Gold peg to monitorRussia is offering 5000 Rubles for a gram of gold. This chart tracks what is happening in real-time to the implied gold price in USD and the USDRUB fx rate needed to match the global Spot USD price.

USDRUB bearish pressureThis morning during the Asian session, the dollar fell to a new one this year at 81,000. At the beginning of the month, the USDRUB pair reached its peak at 154,300 as a result of Russia's attack on Ukraine and the application of sanctions by the EU, America and other allies. After that, consolidation started, and now we are back to the period before the start of the invasion at 81,000 Russian rubles for one US dollar. Russia's countermeasure was that all enemy countries that buy oil and gas pay their obligations in rubles. This led to the strengthening of the Russian ruble. We need to go back above the 100,000 level and moving averages for the bullish option to get technical support on the chart. After that, we can expect a potential continuation of the bullish trend. We need a continuation of this negative consolidation and a further pullback below the 80,000 support zone for the bearish option. If this zone does not support us, we will continue towards the next lower support zone at 70,000, and the last time we were here was in November last year.