USDT.D 4H Analysis - Key Triggers Ahead☃️ Welcome to the cryptos winter , I hope you’ve started your day well.
⏰ We’re analyzing USDT Dominance on the 4-Hour timeframe .
👀 On the 4-hour timeframe, USDT Dominance has started to recover after its recent drop, bouncing from the support zone at 4.17% and now moving upward, forming a reacti
Key data points
Previous close
—
Open
—
Day's range
—
About Market Cap USDT Dominance, %
Coin
Tether is considered a pioneer of the stablecoin model. As such, it's pegged to an external asset, US dollar, which lets it combine the stability of the real-world investment tools and the earning potential of a cryptocurrency. Looks reliable (if you can call any crypto assets that), which is probably why its share on the market has been growing since its launch way back in 2014. You can see for yourself, just look at the USDT dominance chart we've prepared — it reflects the ratio of Tether market cap to the cumulative market cap of the crypto market.

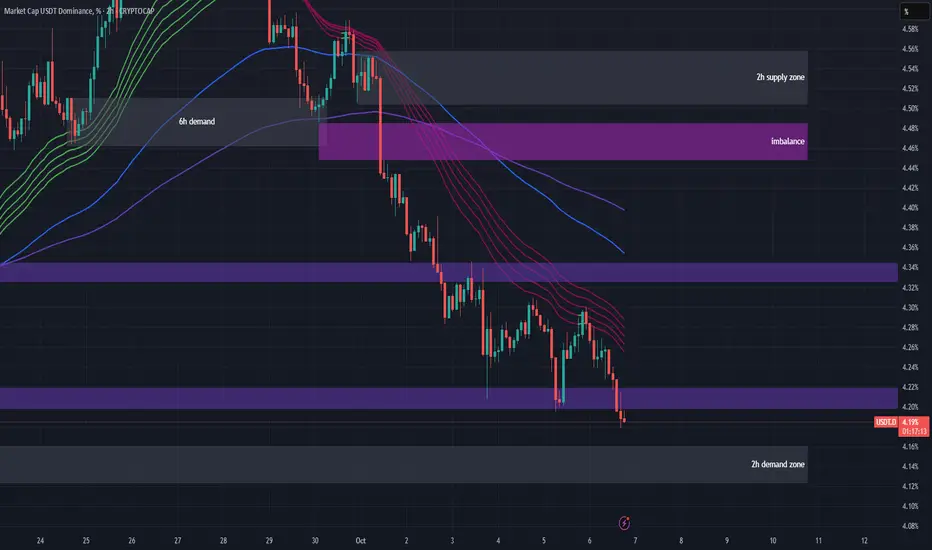
#USDT.D 2H ChartUSDT dominance broke below the support at 4.2% and is still moving downwards. It is expected to tap into the 2h demand at 4.16% before potentially moving up again.
usdt.d 4hHello friends
I am Mehdi and I wanted to say that if you are currently in profit compared to the position we announced
It is better to have a save profit and move the stop loss to the entry point
I would appreciate it if you support me with likes and comments

#USDT.D 4H ChartUSDT dominance bounced off the 6h demand zone perfectly as we predicted. It is currently expected to keep pushing towards the minor supply zone at 4.66%.

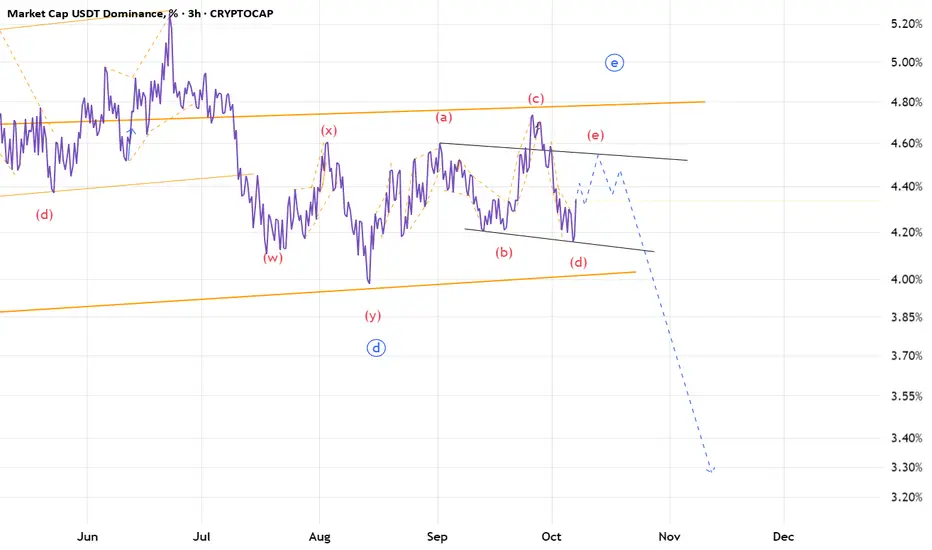
USDT.D(based on NEo wave)the bigger degree is a huge triangle and also wave E is a triangle with abcd waves which all are diametrics.
I hope wave e break the curse and change the pattern.
USDT.D: Possible Take Profit zone for AltcoinsI see the green box as a safe zone to sell the altcoins.
so between 3.27% and 2.76%.
Setting an alert on 3.27% is advisable so you can pay attention.

EPIC alt-season incoming ?For those unfamiliar with dominance, in a nut shell, a move up denotes a bear run in alts and a decline a bull run
On this monthly dominance chart of USDT I have a trendline which has held since 2017
The red arrows mark all negative Octobers and for what its worth so far we have 2 positives in 2015

usdt.dHello, I am Mehdi.
According to the previous analysis, the market has continued to the range we are waiting for. In this area, we should wait for the formation of a pattern to continue the path.
Therefore, it is recommended to keep an eye on the market with a 70% profit margin.

usdt.d 30minHello friends
I am Mehdi, according to the Tether Dominance chart and the full targeting of the previous analysis in the 4-hour timeframe
According to the new analysis, I think the price is expected to reach the range of 4.49
1 Because the 4.57 level was broken with a strong candle in the 4-hour tim

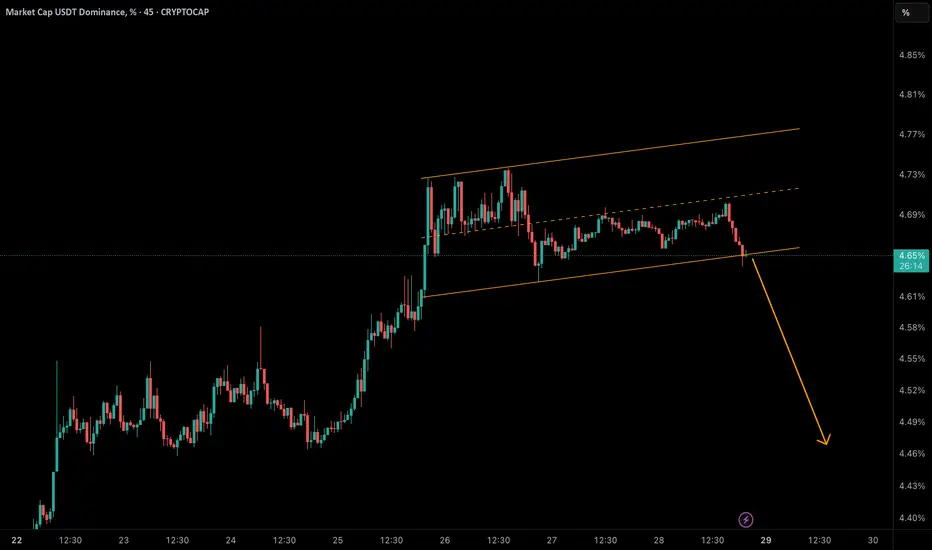
USDT Dominance at a Critical Breakout Point!USDT dominance has touched the bottom of its rising channel near 4.65%.
• 🔻 A breakdown below this support could trigger a correction toward 4.58% → 4.50% → 4.45%.
• 🟢 But if buyers defend this zone and reclaim 4.70%, we may see another push toward 4.75% – 4.77%.
📈 Why it matters: Falling USDT do
See all ideas
Summarizing what the indicators are suggesting.
Oscillators
Neutral
SellBuy
Strong sellStrong buy
Strong sellSellNeutralBuyStrong buy
Oscillators
Neutral
SellBuy
Strong sellStrong buy
Strong sellSellNeutralBuyStrong buy
Summary
Neutral
SellBuy
Strong sellStrong buy
Strong sellSellNeutralBuyStrong buy
Summary
Neutral
SellBuy
Strong sellStrong buy
Strong sellSellNeutralBuyStrong buy
Summary
Neutral
SellBuy
Strong sellStrong buy
Strong sellSellNeutralBuyStrong buy
Moving Averages
Neutral
SellBuy
Strong sellStrong buy
Strong sellSellNeutralBuyStrong buy
Moving Averages
Neutral
SellBuy
Strong sellStrong buy
Strong sellSellNeutralBuyStrong buy
Displays a symbol's price movements over previous years to identify recurring trends.