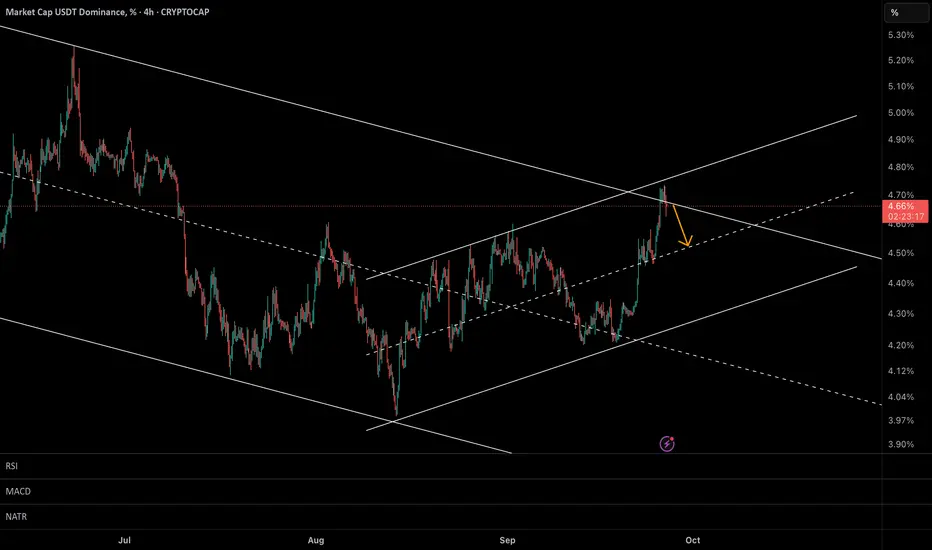
USDT Dominance at a Critical Turning Point–Will Correction BeginIn my previous analysis, I highlighted that USDT dominance had likely completed a 5-wave Elliott structure around 4.60%–4.65%, suggesting that a corrective ABC decline could follow.
That call played out accurately, with dominance stalling right at the projected resistance zone.
🔎 Current Update:
•
Key data points
Previous close
—
Open
—
Day's range
—
About Market Cap USDT Dominance, %
Coin
Tether is considered a pioneer of the stablecoin model. As such, it's pegged to an external asset, US dollar, which lets it combine the stability of the real-world investment tools and the earning potential of a cryptocurrency. Looks reliable (if you can call any crypto assets that), which is probably why its share on the market has been growing since its launch way back in 2014. You can see for yourself, just look at the USDT dominance chart we've prepared — it reflects the ratio of Tether market cap to the cumulative market cap of the crypto market.
Bullish marketAs the chart illustrates, USDT.D lost the major support zone and pushed the market into a bubble.

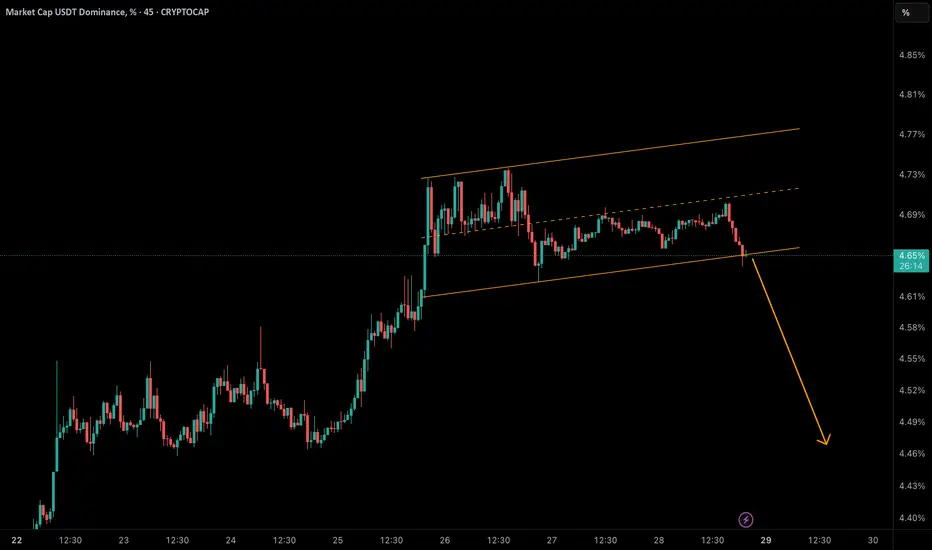
USDT Dominance at a Critical Breakout Point!USDT dominance has touched the bottom of its rising channel near 4.65%.
• 🔻 A breakdown below this support could trigger a correction toward 4.58% → 4.50% → 4.45%.
• 🟢 But if buyers defend this zone and reclaim 4.70%, we may see another push toward 4.75% – 4.77%.
📈 Why it matters: Falling USDT do
usdt.d 4hHello friends
I am Mehdi and I wanted to say that if you are currently in profit compared to the position we announced
It is better to have a save profit and move the stop loss to the entry point
I would appreciate it if you support me with likes and comments

#USDT.D 4H ChartUSDT dominance bounced off the 6h demand zone perfectly as we predicted. It is currently expected to keep pushing towards the minor supply zone at 4.66%.

USDT.D BEARISH MOVE ANTICIPATIONAs observed from experience, when the usdt dominance favors or is about to favor the bears, the entire crypto market breathes a sigh of relief...

Stablecoin Dominance Is Overbought – A Reversal May Be NearUSDT and USDC dominance combined are currently in an overbought region. A reversal could happen soon. Historically, when stablecoin dominance decreases, the broader crypto market tends to rise.
We may be standing at the doorstep of a significant move to the upside in the crypto market, especially

USDT.D - Watch the Blue Zone: Break = Bullish for CryptoUSDT dominance ripped into the 4.55–4.60 supply and stalled. Price is hovering on the blue support zone at 4.44–4.48.
This area is key 🔑. If the blue zone breaks down and holds below 4.44–4.48, that’s bullish for crypto (alts + BTC) as dominance rotates lower toward 4.30–4.25, even 4.22.
If the zo

USDT.D 1H Analysis - Key Triggers Ahead❄️ Welcome to the cryptos winter , I hope you’ve started your day well.
⏰ We’re analyzing CRYPTOCAP:USDT.D on the 1-Hour timeframe .
👀 On the 1-hour timeframe, Tether Dominance moved upward after breaking above the 4.46% level. However, buyers were unable to push through the 4.72% resistance, an

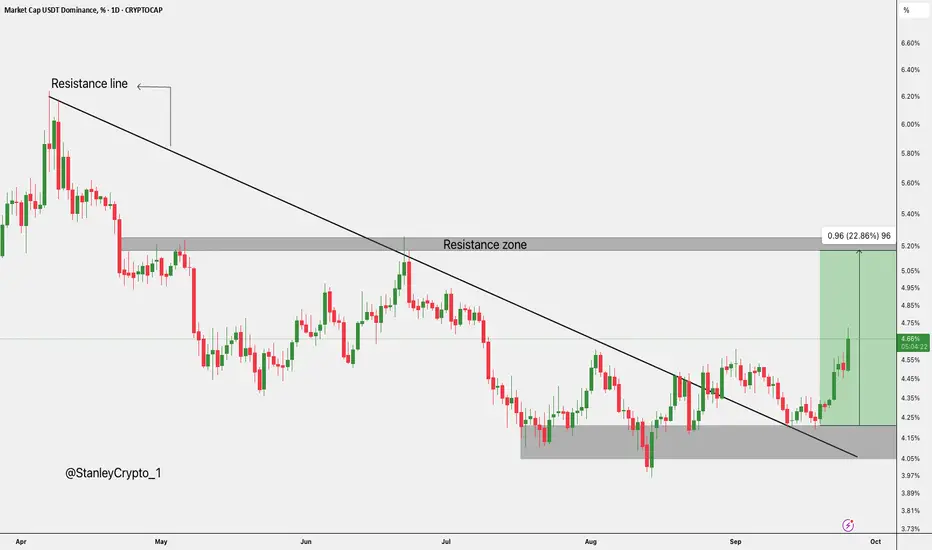
$USDT Dominance: 22% Breakout Potential.CRYPTOCAP:USDT dominance has finally broken free after months of consolidation. It’s now pushing toward the resistance zone around 5% to 5.2%, with a potential 22% upside.
If it holds above that trendline, we could see even more upside in the near future. It’s looking like a solid breakout.
See
See all ideas
Summarizing what the indicators are suggesting.
Oscillators
Neutral
SellBuy
Strong sellStrong buy
Strong sellSellNeutralBuyStrong buy
Oscillators
Neutral
SellBuy
Strong sellStrong buy
Strong sellSellNeutralBuyStrong buy
Summary
Neutral
SellBuy
Strong sellStrong buy
Strong sellSellNeutralBuyStrong buy
Summary
Neutral
SellBuy
Strong sellStrong buy
Strong sellSellNeutralBuyStrong buy
Summary
Neutral
SellBuy
Strong sellStrong buy
Strong sellSellNeutralBuyStrong buy
Moving Averages
Neutral
SellBuy
Strong sellStrong buy
Strong sellSellNeutralBuyStrong buy
Moving Averages
Neutral
SellBuy
Strong sellStrong buy
Strong sellSellNeutralBuyStrong buy
Displays a symbol's price movements over previous years to identify recurring trends.