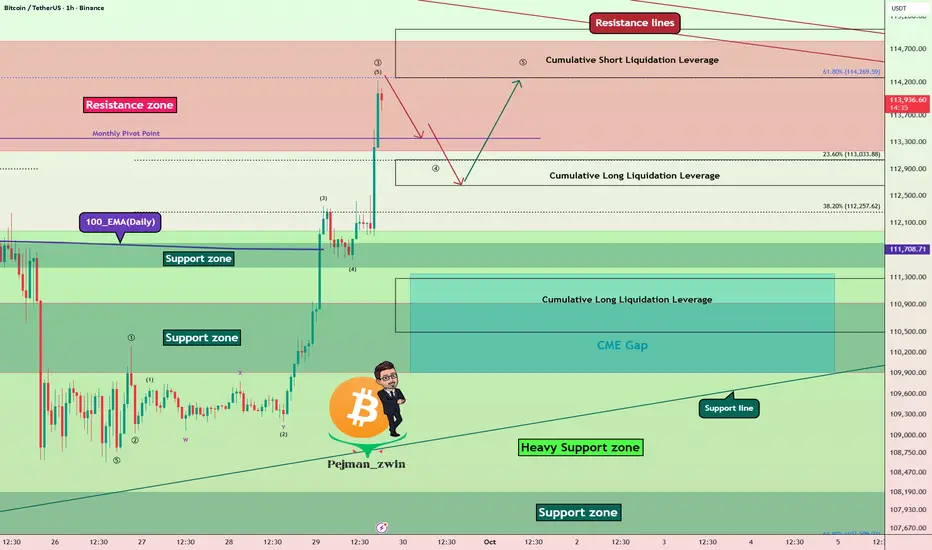
Bitcoin Resistance Zone Battle – ATH or Fakeout?Bitcoin ( BINANCE:BTCUSDT ) has shown strong momentum over the past 5 days , liquidating many traders in both Long and Short positions .
Bitcoin has now entered the Resistance zone($114,820-$113,170) and is moving near the Cumulative Short Liquidation Leverage($115,000-$114,272) and Resistance lines .
From an Elliott Wave Theory perspective, given Bitcoin’s strong bullish momentum over the past 24 hours, it appears to be completing Wave 3. This Wave 3 seems to be of the extended type.
I expect Bitcoin , after a correction , to make another attempt toward the Resistance zone($114,820-$113,170) and potentially test the Resistance lines .
Do you think this bullish move could lead to a new all-time high (ATH) for Bitcoin?
Cumulative Long Liquidation Leverage($113,037-$112,650) + Near Monthly Pivot Point($113,356): An area where Bitcoin could start rising again (if there is a correction, of course).
Cumulative Long Liquidation Leverage: $111,100-$110,500
CME Gap: $111,355-$109,915
Note: Also, Bitcoin approaching the 61.8% golden Fibonacci level could lead to a Bitcoin correction.
Please respect each other's ideas and express them politely if you agree or disagree.
Bitcoin Analysis (BTCUSDT), 1-hour time frame.
Be sure to follow the updated ideas.
Do not forget to put a Stop loss for your positions (For every position you want to open).
Please follow your strategy and updates; this is just my Idea, and I will gladly see your ideas in this post.
Please do not forget the ✅' like'✅ button 🙏😊 & Share it with your friends; thanks, and Trade safe.
USDTBTC.P trade ideas
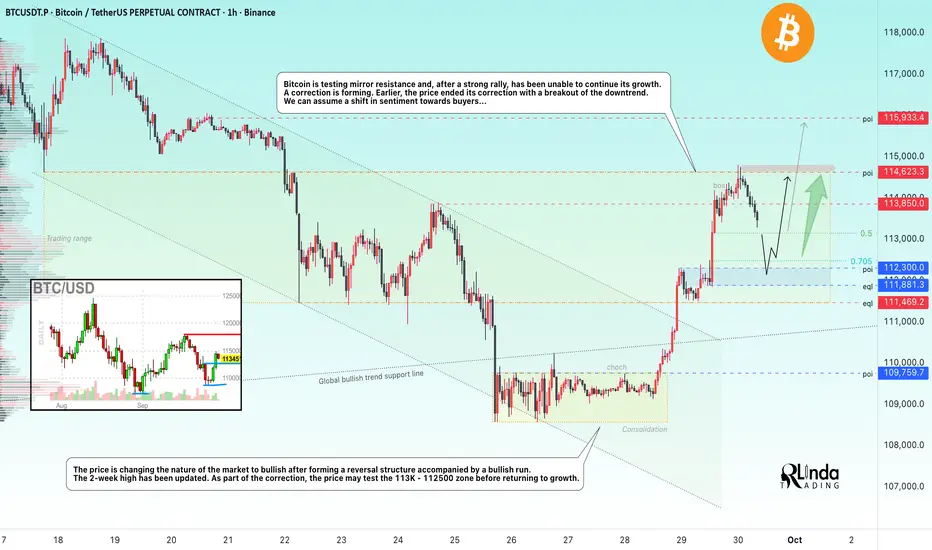
BITCOIN → Correction before the breakout of 114.5KBINANCE:BTCUSDT , after the end of the correction, is forming a 3.5% rally and testing the important milestone of 114,600. It was not possible to break through the level without consolidation and at such a high speed. How long will the correction last?
Bitcoin is testing mirror resistance and, after a strong rally, was unable to continue its growth. The reason for the halt is a huge liquidity pool above 114,600. A pullback is forming. Earlier, the price ended a 3-week correction by breaking through the downward resistance. We can assume a change in sentiment towards the buyer...
Technically, the price is changing the nature of the market to bullish after the formation of a reversal structure accompanied by a bullish run. The 2-week high has been updated.
Resistance levels: 113850, 114620, 115900
Support levels: 113100, 112300, 111800
As part of the correction, the price may test the 113K - 112500 zone before returning to growth. If the market holds the price above 112K - 113K, it will confirm the bullish sentiment, and the positive fundamental background will support further growth.
Best regards, R. Linda!
The day will come which No one would believe BTC towards 222222Here I am expressing my Thought about BTC
if we look at the Previous Data
( TOP 10540 LOW 3621)
(LOW 3621 TOP 69198)
(TOP 69198 LOW 15443)
(LOW 15443 TOP would be 222222) by March 2026
From there we would be having two year downtrend and the LOW would be $76000 around December January 2028.
Those who believe and know this assets from the beginning they will certainly believe this possibilities .
This is not a financial advice so take your decision on your own
However everything is Possible in this world as more and more institutions are getting into it and everyday the tech is improving.
Remember me if this wild Prediction is going to be True.
Thanks,

Bitcoin Roars Above $120K, ATH on the RadarBitcoin just blasted through resistance and is charging straight toward its all-time high.
The beast is alive and moving with power. 🚀
#PEACE

Forecast for BTCUSDT 9th October 2026 (Updated)Forecast for BTC for the next 4 weeks. Quick decline to $120k followed by a bounce to ~$127k followed by continuation down to ~$104k for a bottoming before new all-time-high towards ~$150k-$170k.

BTC - All Important Trendlines and Liquidity ZonesAs of the current Bitcoin trend, I have outlined 3 key trendlines as well as the two major liquidity zones we need to keep an eye on right now.
The "Upper Resistance Trendline" has so far marked our three recent all time highs (red arrows). This has been a series of higher highs, which is normally a good sign in a bull market, the only problem is we are started to see some early signs of bearish divergence.
The "Middle Trendline" has acted as a key level mainly for the candle bodies. It has been a support/resistance flip level, but may have confluence in the future.
The "Lower Support Trendline" has acted as our three recent lows. It has helped to create a series of higher lows which is a good sign in an uptrend. The trend needs to maintain this series of higher lows, once we see the confirmation of this trend broken, the bear market will have begun.
Now let's focus on the two main liquidity zones right now.
The first is our "Important Liquidity Zone". This represents all the resistance that was built up from July-August 2025. Ideally, for this uptrend to continue to make new higher highs, this important liquidity zone is a crucial area to hold as a new support level. It ranges from $119.3k-$120.4k. A flip of this zone into new support would indicate that Bitcoin is ready for new all time highs. That is the first thing to watch for.
However, the "Middle Liquidity Zone" represents the $116k-$118k level. This level marked many support/resistance levels for our current trend. Therefore, if our main liquidity zone is breached this could come in confluence with our middle trendline.

BTC; Aiming For A New (ATH) At $140k ?Bitcoin is set to break this resistance level and scale toward $140k before the year end. it have been moving within this momentum region of $109k-$123k for this couple of weeks, which we experienced a new ATH at $126k this week.
However according this structure our SMA 80 and SMA 200 the chances of this new ATH clearly high, also the "uptober" psychology actually nails the current market movement.
My fellow traders and investors do think we would see a plane climb to $140k by December..?
Like and share your thoughts
Thanks for reading.

BTC Bullish Targets 150k & beyond
Since downward manipulation/support testing leg in April of this year, BTC had shown strength and crossed Weekly swing high.
Targets from that manipulation leg have reached halfway already, and now looking forward to 4th deviation.
2nd dev= $117,340 upto $124,480
4th dev = $145,900 upto 153,000
chart also shows potential targets in case we go higher. upto 190k and 243k.

Bitcoin : Stay heavy on positionsBitcoin : Stay heavy on positions (2x~3x)
Maintaining the same outlook as before.
** This analysis is based solely on the quantification of crowd psychology.
It does not incorporate price action, trading volume, or macroeconomic indicators.

Short BTC to 117,300BTC has broken the ascending channel and I expect a pullback to the next major support at 117,200 which is also the 50% retracement of the rally to ATH

TradeCityPro | Bitcoin Daily Analysis #183👋 Welcome to TradeCity Pro!
Let's dive into today's Bitcoin analysis. The market has had an upward movement. Let's see what's ahead in the market.
⏳ 1-Hour Timeframe
Yesterday, I mentioned that there was a high probability of movement and that it would be a good idea to keep an eye on the chart during the New York session as the market could move.
📊 With the start of the New York session, good buying volume entered the market, and after breaking 109890, Bitcoin started an upward wave.
🔑 The first area where the price could have faced resistance was 111605, which was broken on the first attempt. After a pullback, the next leg started.
🚀 The break of 109890, along with RSI entering Overbuy and the entry of buying volume, was a good trigger for a long position, and we could have opened a position with it.
⭐ Now, the price has reached a very important resistance zone, and the probability of a correction starting is high. For taking profit, I suggest you lock in profits whenever RSI exits the Overbuy zone, as this will reduce the upward momentum and increase the chances of a correction.
📈 For new positions, no triggers are available yet, and it's better to wait until the market gives us a clearer structure. However, if the price reacts several times to the level, we can open a long position in subsequent attempts if it breaks.
❌ Disclaimer ❌
Trading futures is highly risky and dangerous. If you're not an expert, these triggers may not be suitable for you. You should first learn risk and capital management. You can also use the educational content from this channel.
Finally, these triggers reflect my personal opinions on price action, and the market may move completely against this analysis. So, do your own research before opening any position.

BITCOIN BTCUSDT The bitcoin daily loss is part of trading strategy, gains and losses is what comes with trading any instrument.
Macroeconomic Jitters Intensify Crypto Volatility as Global risk sentiment turned sharply negative after the U.S. announced new 100% tariffs on Chinese tech imports, reigniting fears of a prolonged trade conflict.
the current crypto downturn reflects a complex mix of macroeconomic headwinds, leveraged liquidations, and cooling sentiment after record-breaking highs.
key demand floors 107,829-107,500
key demand floor is 100,067 break and close sell into next demand structure.
key demand floor 98,849-98,733
key demand floor 94400-93760
#bitcoin #btc

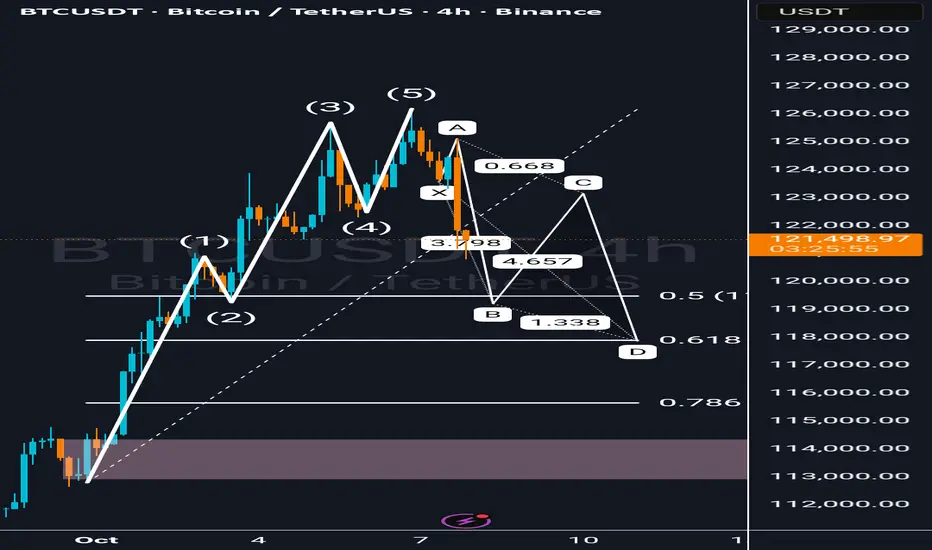
BTC / USDT – Wave 5 Completed, Correction in Progress!
📉 BTCUSDT – Wave 5 Completed, Correction in Progress!
After completing a clear Elliott Wave impulse (1–5), Bitcoin now appears to be entering a complex corrective phase.
The chart shows an emerging ABC pattern that may align with a harmonic XA–BC–D structure, with key Fibonacci confluence zones around:
0.5 retracement: 119,484
0.618 retracement: 117,900
Potential Wave D target: 117K–118K
This correction could offer a buy-the-dip opportunity if BTC holds above the Fibonacci support and shows a strong bullish reaction.
However, if Wave D breaks below the 0.786 zone (around 115K), selling pressure could extend toward the 1.272 extension (around 109K).
📊 Short-term traders: Watch price reactions near 119K–118K.
📈 Long-term investors: Wait for a confirmed reversal signal before entering.
---
💬 What do you think? Is this just a healthy pullback before the next impulsive wave, or the start of a deeper correction?
#BTCUSDT #Bitcoin #ElliottWave #CryptoAnalysis #TradingView
Bitcoin Breaks the 46-Day Downtrend!On the daily chart, BTC has finally broken the downward trendline that held price action down for the past 46 days since August.
This breakout could mark a shift in momentum, with buyers stepping back in.
📍 Key Levels:
Daily Support: $114,720
Stop Loss White level
Fundamentals: Optimism around institutional flows, the upcoming 2026 halving cycle, and easing Fed rate expectations continue to support the bullish case for Bitcoin.
If the breakout holds, momentum could accelerate higher from here.
If you find this content helpful, don’t forget to like & follow for more updates!

BTC short We have a strong MSB at 1/4h with IMB in the high zone and short reactions on imbalances, a good chance for a possible short reaction from this zone
A strong OB with imbalance and the zone above is defended as a possible manipulation of a bigger short, regardless this is a chance for a smaller but safer R, although nothing is certain with BTC . . .

Bitcoin bounce from Support, Bullish Momentum IntactBitcoin continues to show bullish momentum. A recent bounce from support shows the buyers are in charge. Let's take a 1:1 trade here.
Trading Strategy
Hello, fellow traders!
By "Following" us, you'll always receive the latest information quickly.
Have a great day.
-------------------------------------
The conditions that lead people to start trading vary.
Before starting a trade, you should consider a trading strategy.
A trading strategy should include:
1. Investment period
2. Investment size
3. Trading method and profit realization method
You should categorize the coins (tokens) you wish to trade based on items 1-3 above.
1. The investment period is the most important.
While the investment period varies from person to person, BTC and ETH are generally considered long-term investments.
Since BTC and ETH are important coins that support the cryptocurrency market, I recommend investing in either BTC or ETH.
All coins other than BTC are broadly categorized as altcoins. However, among them, BNB, SOL, XRP, TRX, and ADA LINK, which have high market capitalizations and have been around for a long time, are suitable for mid- to long-term investment.
However, since these coins are also broadly categorized as altcoins, it's recommended to increase the number of coins (tokens) that generate income, if possible, for mid- to long-term investment.
This method involves selling the original purchase price (plus transaction fees) when the price rises, leaving the remaining coins (tokens) available for profit.
This allows you to increase the number of coins (tokens) with an average purchase price of zero, making mid- to long-term investment feasible.
While it's certainly advisable to sell your holdings to generate cash profits, this practice is not suitable for mid- to long-term investment.
This is because if you make a mistake, you could end up buying at a high price and incur losses for a long period of time.
-
2. You should determine your investment size based on your investment period.
In other words, if you're making a long-term investment and have already invested all your capital, you could miss out on good opportunities in the future.
Therefore, it's best to invest in the following order: long-term investment < mid- to long-term investment < short-term investment.
Furthermore, you should keep approximately 20% of your total investment in cash.
This allows you to trade when a good opportunity arises.
If you run out of cash after trading, try to sell when the price rises to secure cash.
Furthermore, you should avoid investing in too many coins (tokens).
-
3. Once you've determined your investment period and size, you need to find the right buy and sell points for actual trading.
Therefore, you need to define your trading method and profit-making method.
The basic trading strategy is to buy in the DOM(-60) ~ HA-Low range and sell in the HA-High ~ DOM(60) range.
However, if the price rises in the HA-High ~ DOM(60) range, a stepwise upward trend is likely, while if the price falls in the DOM(-60) ~ HA-Low range, a stepwise downward trend is likely.
Therefore, the basic trading strategy should be a split trading strategy.
In other words, if you buy in the DOM(-60) ~ HA-Low range and the price rises to form the HA-High ~ DOM(60) range, it's best to sell in splits and observe the situation.
This stabilizes your psychological state, allowing you to re-analyze the charts.
Maintaining a stable psychological state is crucial for trading.
If your psychological state is unstable, you're more likely to make unexpected trades.
Therefore, it's important to have a basic trading strategy that suits your investment style.
As mentioned earlier, to maintain a mid- to long-term investment, you need to decide whether to increase the number of coins (tokens) that generate profits or to generate cash returns. Before conducting a trade, you need to decide whether to do so.
Since the coin market is increasingly interconnected with the stock market, you can try to interpret it using the same method as the stock market.
In other words, rather than examining the flow of funds within the coin market itself, you should prioritize assessing the stock market, social issues, the economy, and politics to determine market trends.
I believe this problem stems from a lack of understanding of the coin market.
While some external factors may influence the flow of funds within the coin market, they are not suitable for predicting it.
Therefore, you should check the USDT, USDC, USDT.D, and BTC.D charts to confirm the flow of funds within the coin market.
Next, you should check the charts of the coin (token) you wish to trade to determine if it fits your basic trading strategy and develop a trading strategy.
Finally, by examining issues beyond the coin market, you can make an objective decision about your trading.
Otherwise, you will likely make inappropriate trades based on subjective opinions stemming from issues outside the coin market.
To analyze and interpret the coin market like the traditional stock market, the two markets must be integrated.
Otherwise, I believe the coin market should not be analyzed or interpreted like the stock market.
-
Thank you for reading to the end.
I wish you successful trading.
--------------------------------------------------

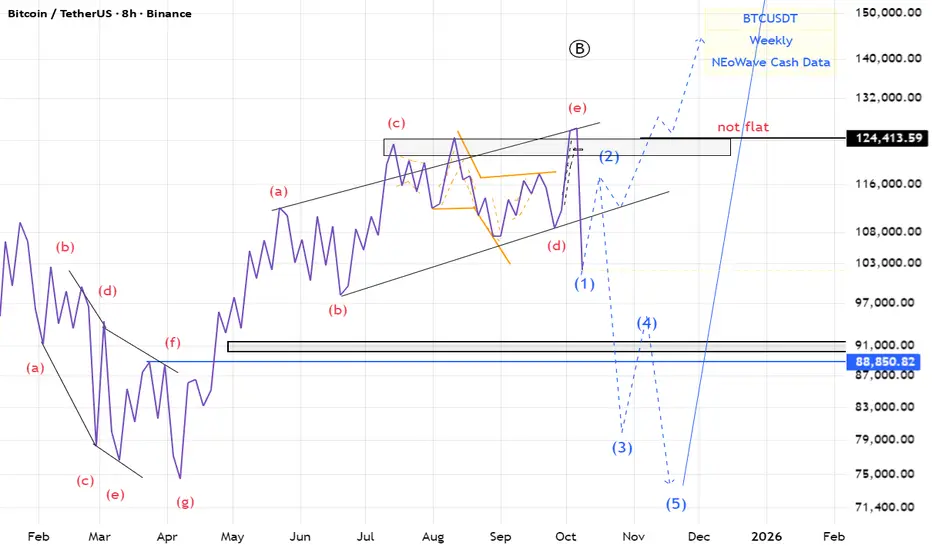
BTC(based on NEo wave)there is a good possibility for the irregular flat.
I think 2-3 month we will see the red market
DXY, EUR/USD, GBP/USD, and Bitcoin Daily Analysis for 07/10/25Today we see how price delivered lower as projected yesterday and i have also mapped out the areas to look into on price ahead of tomorrow price delivery. the bearish bitcoin incoming explained

BTCUSD BITCOIN ADVANCED STRUCTURE BITCOIN OVERSIGHT AND CORRECTIONS FOR EDUCATIONAL PURPOSE ONLY
(1)DEMAND FLOOR AT 109,060.77 was a retest to the neckline of double bottom a bullish price action signal on daily candle close as illustrated from our line chart and it came with another confluence from an ascending trendline to add more impetus to the buy rally and many missed and lost money too.
(2) SUPPLY ROOF 117,383.70 a previous demand floor on daily after break of structure it became supply roof and stopped upswing twice ,but due to buy rally that key level is broken after 2 retested attempt ,on technical a broken supply roof is now our demand floor except the sell order exceed buy order that zone 117,383.70 holds support on daily candle close .
(3) 123,387-124,478.66-125k daily supply roof and our current all time high .
this zone has an ascending trendline connecting the two highs and on technical the next high should be 127,071-128k for sell in the direction of the previous two all time highs(123,387-124,478.66)
my ideal zone to attempt sell should be 127,071-128k zone
note ;you can avoid selling and wait for buy zone 117,383.70 and its possible tat price wont return to this level.
trading is 100% a game of probability.(win/loss) comes with it.
No holy gril,nothing like best strategy.
what we have is masters in RISK MANAGEMENT,THE BEST TRADERS ARE EXPERTS IN RISK MANAGEMENT,THEY ALL HAVE ZERO EMOTION,THEY DONT CHASE WHAT IS LOST.
GOODLUCK
#BITCOIN #BTCUSDT #BTC #CRYTO

The Global Payments Revolution Transforming the Way the World Transacts.
1. Introduction: The Digital Transformation of Money
The world is witnessing a monumental shift in how value moves across borders, industries, and individuals. What was once a slow, paper-based, and regionally confined system of payments has evolved into a fast, borderless, digital ecosystem that connects billions of people, devices, and businesses in real time.
This transformation — often called the Global Payments Revolution — is driven by the convergence of technology, regulation, innovation, and consumer demand. From mobile wallets in rural villages to real-time payment rails across continents, the revolution is reshaping not just finance but the entire economic structure of the 21st century.
Money has always been central to human civilization — a store of value, a medium of exchange, and a unit of account. But today, money itself is becoming information — moving through networks, not banks; powered by code, not paper. The global payments revolution is essentially the internet of money in motion.
2. The Evolution of Payments: From Coins to Code
To understand today’s revolution, we must trace the journey of payments.
a. The Physical Era (Before 1970s)
Transactions were largely manual — cash, cheques, money orders. International trade relied on cumbersome processes like letters of credit and SWIFT messages. Payments could take days or even weeks to settle, especially across borders.
b. The Card Era (1970s–1990s)
Credit and debit cards introduced electronic payments to the masses. Networks like Visa, Mastercard, and American Express transformed commerce by linking banks globally. Yet, these systems were still centralized, costly, and dependent on intermediaries.
c. The Internet Era (1990s–2010s)
The rise of the internet gave birth to online banking and digital wallets such as PayPal, Alipay, and Skrill. E-commerce exploded, and people could now send money or shop across the globe instantly. Still, most transactions were routed through traditional banks and card rails, limiting speed and inclusivity.
d. The Real-Time and Blockchain Era (2010s–Present)
The 2010s saw the emergence of real-time payment systems (like India’s UPI, Europe’s SEPA Instant, and the UK’s Faster Payments). At the same time, blockchain and cryptocurrency introduced the idea of decentralized, peer-to-peer payments without intermediaries. Together, these technologies laid the foundation for instant, global, programmable money.
3. The Core Drivers of the Payments Revolution
Several forces are pushing this transformation forward.
a. Digitalization of Commerce
As consumers move online, payments have followed. In 2025, over 75% of global retail transactions involve a digital element — from QR codes to BNPL (Buy Now, Pay Later) models.
b. Smartphone Penetration
Over 6.9 billion smartphones worldwide have made it possible for anyone, anywhere, to send or receive money — even without a bank account. Mobile wallets like M-Pesa (Kenya) and PhonePe (India) have proven how financial inclusion can scale digitally.
c. Rise of FinTech Innovation
Thousands of FinTech startups are building innovative solutions for cross-border transfers, merchant payments, and digital currencies. They’re faster, cheaper, and more user-friendly than banks.
d. Regulatory Push
Governments and central banks are embracing open banking, instant settlements, and central bank digital currencies (CBDCs) to modernize financial infrastructure.
e. Consumer Expectations
Modern consumers expect the same instant experience in finance that they get from social media or messaging — speed, convenience, and transparency.
4. The Rise of Real-Time Payments (RTPs)
One of the cornerstones of the global payments revolution is real-time payments — systems that settle transactions instantly, 24/7.
Countries across the world have implemented these systems:
India: Unified Payments Interface (UPI)
United Kingdom: Faster Payments Service (FPS)
European Union: SEPA Instant
Brazil: Pix
Singapore: FAST and PayNow
Australia: New Payments Platform (NPP)
These systems eliminate intermediaries, reduce costs, and enhance transparency and liquidity. India’s UPI, for instance, processes over 12 billion transactions a month, becoming a global benchmark for instant payments.
The interoperability between banks, wallets, and merchants has made RTPs a backbone for everything from small peer transfers to corporate disbursements.
5. Blockchain, Cryptocurrencies, and the Tokenization Era
The next major leap in payments is decentralization. Blockchain technology introduced trustless, peer-to-peer value exchange — meaning people can transact directly, without intermediaries.
a. Cryptocurrencies
Bitcoin started it all in 2009 as a digital alternative to money. Since then, thousands of cryptocurrencies have emerged, enabling borderless and programmable transactions.
b. Stablecoins
Unlike volatile cryptocurrencies, stablecoins (like USDC, USDT) are pegged to fiat currencies. They are becoming a bridge between traditional finance and decentralized finance (DeFi). Stablecoins now power over $1 trillion in annual payments, used by merchants, exchanges, and remittance platforms.
c. Central Bank Digital Currencies (CBDCs)
Governments are experimenting with digital versions of national currencies. Over 130 countries are researching or piloting CBDCs.
China’s Digital Yuan (e-CNY) and India’s Digital Rupee are leading examples. CBDCs could make payments more efficient while giving central banks control over digital money supply.
d. Tokenization and Smart Contracts
Payments are evolving beyond money transfers. With tokenization, assets (stocks, real estate, art) can be represented digitally and traded instantly. Smart contracts automate transactions based on conditions — enabling innovations like programmable payrolls, automated lending, and decentralized insurance.
6. The Revolution in Cross-Border Payments
Cross-border payments have traditionally been slow, expensive, and opaque. It could take days to send money abroad due to multiple intermediaries.
The revolution is solving this problem through:
Blockchain-based networks like Ripple and Stellar, which move money in seconds.
FinTech platforms like Wise, Revolut, and Remitly, offering low-cost, real-time transfers.
Interlinking of domestic payment systems, like UPI-PayNow (India-Singapore), creating a global instant payment network.
According to the Bank for International Settlements (BIS), global cross-border payments could reach $300 trillion annually by 2030, with instant, transparent transfers becoming the norm.
7. The Role of FinTech and Big Tech in Shaping the Revolution
a. FinTech Startups
Startups have disrupted the legacy systems with agile technology and customer-first models. Companies like Stripe, Square, Razorpay, and Adyen have built global platforms for online and offline payments.
b. Big Tech Ecosystems
Tech giants like Apple (Apple Pay), Google (Google Pay), Amazon Pay, and Alibaba’s Alipay have turned digital payments into lifestyle ecosystems — blending shopping, banking, and social networking.
Their influence has blurred the line between commerce and finance, leading to “super apps” — platforms that offer everything from ride-booking to investments within one interface.
8. Financial Inclusion: The Human Side of the Revolution
Perhaps the most powerful outcome of the global payments revolution is financial inclusion.
Over 1.4 billion people globally were unbanked as of 2022. But mobile payments and digital identity systems have brought millions into the formal economy.
In Africa, M-Pesa enabled farmers and small merchants to transact digitally without banks.
In India, UPI and Aadhaar have created the world’s largest financial inclusion network.
In Latin America, platforms like MercadoPago and Nubank have democratized access to digital finance.
The payments revolution isn’t just about faster transactions — it’s about empowering people, reducing poverty, and fueling entrepreneurship.
9. Security, Regulation, and the Future of Trust
As payments become digital and global, security and regulation have become critical.
a. Cybersecurity and Fraud Prevention
With billions of digital transactions daily, threats like phishing, identity theft, and fraud are rising. Technologies such as biometric authentication, AI-based risk scoring, and blockchain transparency are strengthening trust.
b. Data Privacy and Regulation
Governments worldwide are enforcing data protection laws (like GDPR in Europe) and open banking standards. The challenge is balancing innovation with consumer protection.
c. Global Cooperation
Organizations like SWIFT, IMF, and the Financial Stability Board (FSB) are working on global interoperability standards to make cross-border payments seamless while maintaining compliance with anti-money laundering (AML) and KYC norms.
Trust is the new currency in a digital economy — and it must be built on transparency, accountability, and user control.
10. The Future: What Lies Ahead for Global Payments
The global payments landscape is evolving faster than ever. The future will be defined by five megatrends:
a. Embedded Finance
Payments will be integrated invisibly into apps, vehicles, and smart devices — making transactions seamless and contextual.
b. Digital Currencies & Token Economy
CBDCs and tokenized assets will coexist with traditional money, creating a multi-currency digital ecosystem.
c. AI-Driven Payment Intelligence
Artificial Intelligence will optimize transaction routing, fraud detection, and personalized offers — making payments smarter and predictive.
d. Cross-Network Interoperability
We’ll see greater interlinking of payment systems — from UPI to PayNow to SEPA — enabling global instant money movement.
e. Sustainability and Green Payments
The next revolution will also be environmental — where digital payments reduce paper use, travel emissions, and support carbon-neutral finance.
11. Conclusion: The Internet of Value Has Arrived
The Global Payments Revolution is not just a financial story — it’s a societal transformation. It’s redefining how humans, machines, and institutions exchange value in real time, anywhere in the world.
From the farmer in Kenya paying by mobile phone to a global corporation settling invoices instantly across continents, payments are becoming frictionless, inclusive, and intelligent.
In the coming decade, the distinction between money, data, and technology will blur completely. Payments will not just move value — they will move opportunity, empowerment, and innovation.
We are standing at the edge of a world where money flows as freely as information, and that is the true essence of the Global Payments Revolution.
Hmmm BitcoinfulBe careful. Bitcoin may have reached heavy resistance. If so, price may drop as low as the strong support. Time will tell.
My previous prediction on crypto as a whole is quite bullish but bear season may be in. I think especially if Bitcoin breaks below $107,000

Forecasting the Cycle High... And Next Bear Market Low?This is an interesting study I originally did 2 years ago.
What started as a conversation with a student, who asked me if we could somenow 'project the next Bear market low'...
It got me thinking, and experimenting.
In this video I share the nearly 'accidental' discovery we made, and I think people might finding interesting (albeit pure speculation and most probably wrong).
Any comments welcome.
PS> Apologies for the rambling, it's been a long day.
