Bitcoin Parallel Channel Master Analysis🟦 Parallel Channel Overview
The chart reveals a well-established ascending parallel channel, guiding Bitcoin’s price action over an extended period.
The upper and lower bounds have been respected multiple times, validating the strength and consistency of this trend structure.
Price currently hovers near the midline, following a bounce from the lower boundary, indicating the channel remains intact and bullish momentum is supported.
🧭 Current Price Action
A recent dip tested the lower boundary and was met with strong buying interest — a bullish sign.
Price is now pressing up against the midline, which acts as a crucial pivot:
A successful flip of the midline to support could propel the price toward the upper channel boundary.
A failure here may trigger another retest of the lower support.
📌 Key Structural Levels
Lower Channel Support: The primary demand zone; a breakdown here could suggest a broader structural change.
Midline (Median): The dynamic pivot — the battleground for bulls and bears.
Upper Channel Resistance: Where profit-taking or breakout acceleration typically occurs.
🔁 Repeating Breakout Pattern: Timeline & Insights
🔹 1st Breakout – February 2024
Price breaks above the channel and sets a new high.
Eventually retraces back into the channel.
In August 2024, the break out area from February becomes midline support, validating the zone.
🔹 2nd Breakout – November 2024
Another breakout occurs, reaching a peak roughly equal to the first breakout.
In April 2025, price once again retests the midline, mimicking the previous August retest behavior.
🟡 Pattern Recognized
Breakout → Peak → Pullback to Midline Support → Reaccumulation → Breakout
With this repeating structure, a 3rd breakout is likely, assuming midline support holds.
Based on historical intervals:
Feb to Nov 2024 = ~9 months
Aug to Nov = ~3 months
This positions the next breakout for June 2025, following the April retest.
🔮 Projected Outcome: 3rd Breakout
If the vertical breakout range repeats:
3rd breakout peak could mirror the height of previous breakouts.
⚖️ Summary & Strategic Implications
✅ Structure is bullish as long as Bitcoin trades within or above the channel.
✅ Midline bounces have reliably preceded breakouts — current April 2025 retest strengthens that thesis.
✅ June 2025 becomes a critical breakout watch window.
❌ Break below the midline would invalidate the repeating breakout structure and shift focus to lower support zones.
USDTBTC.P trade ideas

Buy Stop ideaThe liquidity grab caused by trumps 100% tariffs on china has fueled enough liquidity for price to revert back to 120k.
If price doesn’t trigger our stop order before 21st of October then price has more liquidity inducement to carry out before the move so we delete the untriggered order

Outlook on BTCLooking at the chart #btc is currently retracing to mitigate some key areas in the bullish trend. I have indicated where I think #btc could reach by tomorrow.

Bitcoin Breaks Through Key Resistance – Eyes on 127K and Beyond
📈 Bitcoin Technical Analysis – Breakout Above Key Resistance Zone
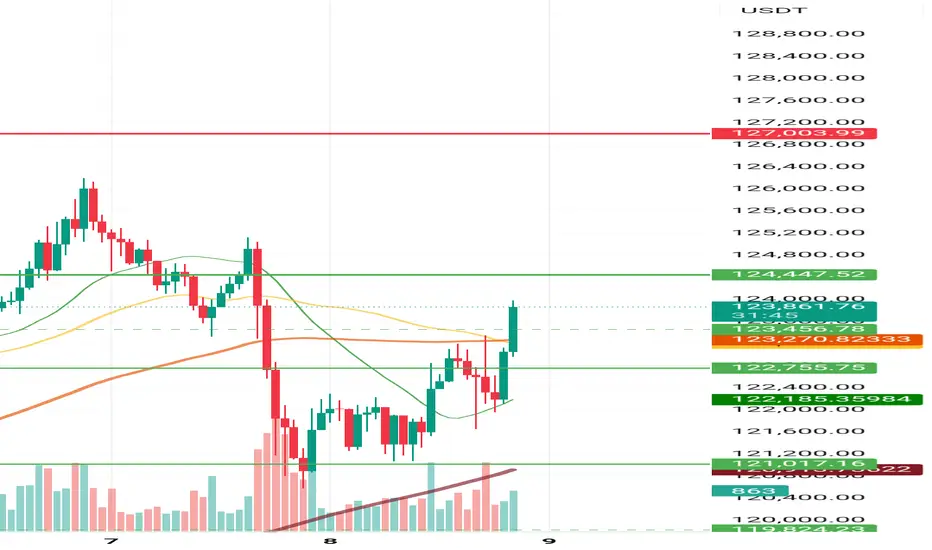
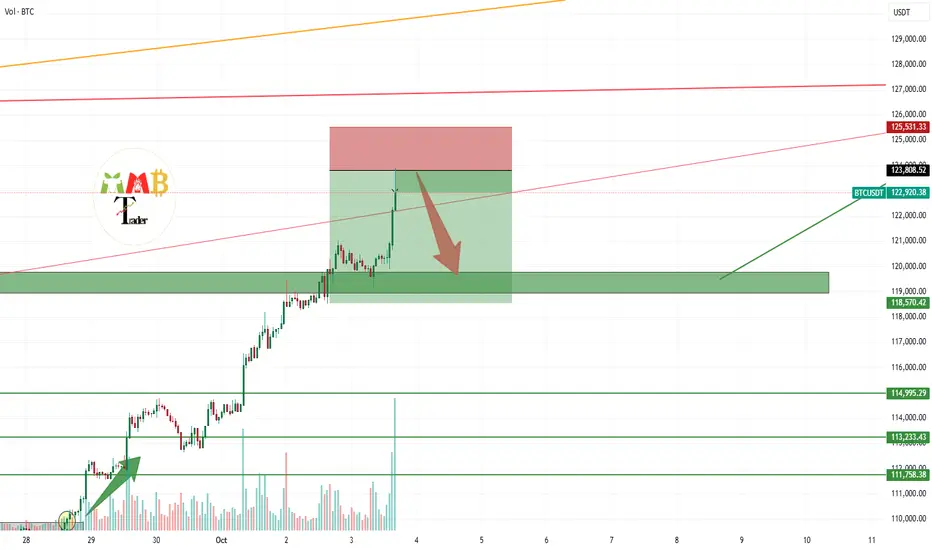
After a healthy correction, Bitcoin found strong support around the 121,000 USDT level, where it formed a solid base and initiated a bullish reversal. This support zone has historically acted as a pivotal level, and the recent reaction confirms its continued relevance.
The price successfully broke through the 122,755–123,000 USDT resistance range, which had previously taken over 34 hours to breach. This time, the breakout was more decisive, backed by a surge in volume and reinforced by the 50-hour and 100-hour moving averages, both converging near the resistance zone and adding to its significance.
🔍 Key Observations:
- Volume Spike: A noticeable increase in trading volume accompanied the breakout, suggesting strong buying interest.
- Trend Line Support: The ascending maroon trend line continues to hold, indicating sustained bullish momentum.
- Moving Averages: The alignment of short- and medium-term MAs below the price adds further confirmation to the breakout.
- Historical Context: The previous struggle to break this resistance highlights the strength of the current move.
🚀 Outlook: With this resistance now flipped into support, we anticipate a more aggressive rally in the coming sessions. The next potential targets lie at 127,000 USDT and 136,000 USDT, which align with previous swing highs and psychological levels.
Traders should watch for consolidation above the breakout zone and monitor volume for signs of continuation. A retest of the 123K level could offer a secondary entry opportunity for those waiting on confirmation.
This will shock you, BTCUSDT Cup and Handle on WeeklyJust tested the built-in indicator, it is interesting, on Weekly chart Bitcoin seems that it formed a Cup and Handle Pattern. This could mean 2x from this level lol. Not financial advise, just interesting what the indicator shows as an educational idea.

Forecast for BTCUSDT 4th October 2026 (Updated)Forecast for BTC for the next 4 weeks. Continuation to ~$125k followed by a retrace to ~$113k and a bounce, followed by continuation down to ~$104k for a bottoming before new all-time-high towards ~$150k-$170k.

Beginning of the bearmarket for $BTC?I don’t want to be the negative voice claiming this is the start of a #bearmarket for CRYPTOCAP:BTC and #Crypto, but this scenario deserves attention. Looking at #Bitcoin on the weekly timeframe, we’re seeing another significant bearish divergence, followed by a capitulation candle.
So you tell me: is this the beginning of a bear market, or was it a black swan event with a V-shape recovery?
BITSTAMP:BTCUSD BINANCE:BTCUSDT COINBASE:BTCUSD INDEX:BTCUSD CRYPTO:BTCUSD BINANCE:BTCUSD

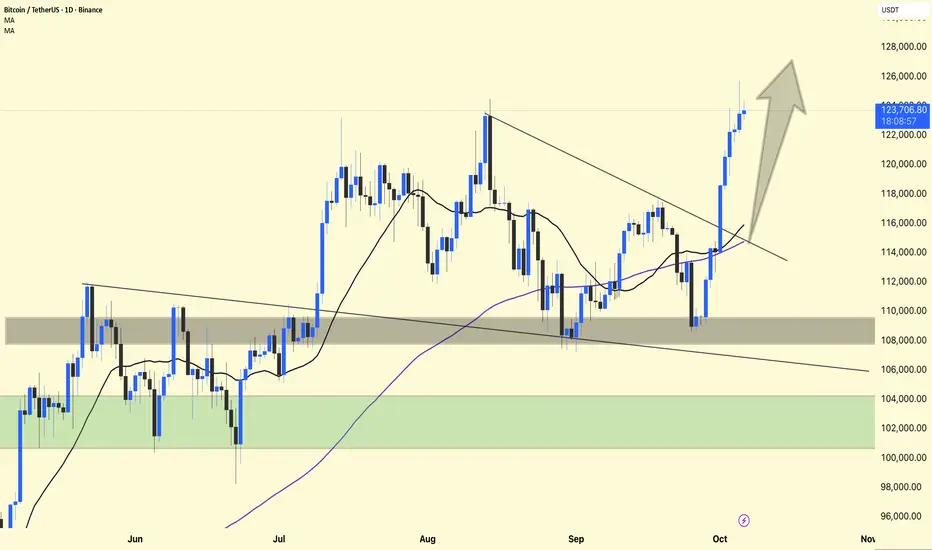
Bitcoin Technical Update – Strong Breakout!Bitcoin has successfully broken out of the descending trendline that had been holding the price down for several weeks. This breakout confirms a shift in market structure from bearish to bullish.
After finding strong support around the $110,000-$112,000 area, BTC bounced sharply and reclaimed both the 21-day and 100-day moving averages – a powerful bullish signal. As long as the price remains above $115,000 to $116,000, we can expect continued upward momentum.
The current move shows healthy strength with volume support, indicating strong buyer interest. If momentum persists, the next potential target is around the $125,000-$128,000 area, where some profit-taking could occur.
Support: $115,000 – $116,000 (previous resistance turned support)
Resistance: $125,000 – $128,000 (short-term target area)
Currently, the upside remains in bullish favor. If the market structure remains stable, any decline towards $116,000-$118,000 could provide a potential buying opportunity.
Remember: Avoid blindly chasing breakouts. Allow the price to retest or consolidate before entering — patience pays off in trend trades.
Bitcoin Roars Above $120K, ATH on the RadarBitcoin just blasted through resistance and is charging straight toward its all-time high.
The beast is alive and moving with power. 🚀
#PEACE

BTCUSD
🔎 Market context:
• Price swept the liquidity below support (~122,700) with long wicks.
• Instead of continuing lower, it quickly reclaimed the range → classic liquidity grab + absorption.
• This often signals a bullish reversa

BTC: Growth from $109KOn September 28, Bitcoin turned into an upward movement on the 1-hour chart from the $109,804 zone. From this level, the market went through all four stages of profit-taking and reached $120,999, giving a potential difference of more than $11,000 per coin. Those who followed the system were able to capture the maximum from this trend.
The key point here is how the movement was managed. The algorithm highlighted important zones, helped secure the position in time, and reduced risks. No emotions, no guessing—just a step-by-step process where every action was clear in advance and confirmed by market structure.
For beginners, such a tool works like a navigator: it shows where it’s safer to lock in profits and when it makes sense to hold longer. In conditions of high volatility, discipline, automation, and technical analysis become the main advantage. That’s what turns the market from a chaotic game into a structured process. An interesting fact I’ve noticed is that this indicator shows an 84% win rate on Bitcoin trades.

BITCOIN’S PUMP BEFORE THE DUMP — CRYPTO ABOUT TO CRASHTRADERS, WE ARE STARING RIGHT INTO THE EYE OF THE STORM. BITCOIN’S “TOO GOOD TO BE TRUE” RALLY IS BEING PROPPED UP BY LEVERAGED PERPS, NOT REAL SPOT BUYING. THE CHART IS SCREAMING EXHAUSTION: AVWAP BANDS COLLIDING, ORDER FLOW MAXED OUT WITH AGGRESSIVE LONGS, AND A DANGEROUS IMBALANCE AROUND 118K. THIS IS THE PERFECT BREEDING GROUND FOR A MEGA LONG SQUEEZE THAT WILL NOT ONLY RIP THROUGH BITCOIN BUT DRAG THE ENTIRE CRYPTO MARKET DOWN WITH IT. THE PUMP IS THE TRAP. THE DUMP IS LOADING
TLDR;
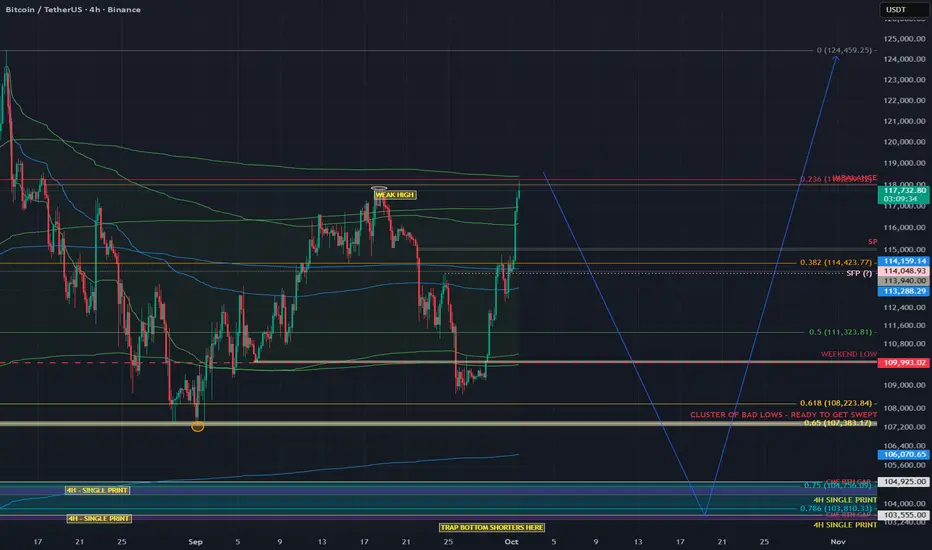
This leg looks futures-driven, not spot-backed. We’re pushing into AVWAP outer-band confluence with imbalances near 118k while leveraged longs pile in. Base case: sweep the mid-Sept Weak High, fail, rotate down toward 104k (and maybe 98.5k). I’ll flip only if spot CVD takes the lead and price accepts above the AVWAP band cluster.
Why I think the “mega long squeeze” is loading
1) Who’s actually buying? (Spot CVD vs Futures CVD)
Spot CVD: still negative/underwhelming across the push → real buyers (spot) aren’t lifting.
Futures CVD (stablecoin-margined): rising with Open Interest → perps are doing the heavy lifting.
Translation: Leverage is pushing price, not genuine spot accumulation. These moves are fragile and unwind hard when OI compresses.
2) AVWAP confluence (the auction math)
I’m tagging anchored VWAPs from opposing pivots (swing low→high and swing high→low).
The outer bands from these anchors are overlapping in the same zone → both bottom-anchored longs see it as expensive (profit-taking), and top-anchored shorts defend their break-even.
That overlap = double-sided supply. Historically, these reject unless fresh spot demand blows through (which we don’t have… yet).
Still have bad September lows that are likely to be swept at 107k~
3) 118k imbalance
There’s an inefficient push / imbalance around 118k. Thin structure often gets tapped/swept, then mean-reverts if the follow-through is purely leveraged.
4) Order flow is too aggressive (late longs)
OI up + positive delta into resistance = new longs chasing.
On footprint, you can see buy-side aggression meeting absorption near the top of the move. That’s classic trap fuel if we print an SFP.
Trade idea (conceptual, not financial advice)
Base case path (bearish):
✅ Sweep the Weak High (mid-Sept) into 117.8–118.8k (imbalance + AVWAP band confluence).
✅ Print a Swing-Fail Pattern (SFP) / rejection wick on 5–15m with:
Spot CVD NOT confirming (stays flat/negative),
OI spikes while delta stalls (late longs absorbed).
Short after the reclaim/failure back below the swept high; stop above the SFP high.
Targets / magnets:
113.2–114.1k (0.382 zone / local AVWAP midlines)
111.3k (0.5 retrace / prior balance edge)
109.9–109.3k (weekend low / prior node)
106.0–104.9k (SP + LVN cluster, high-prob test area)
Stretch: 103.5k (4H single print) → 98.5k if liquidation cascade extends.
validation / flip criteria:
Acceptance above the AVWAP outer-band cluster and 118.8k with:
Spot CVD turning positive and making higher highs,
OI stable or down on further upside (less leverage dependence).
If that happens, I stand down on the short idea and reassess for continuation

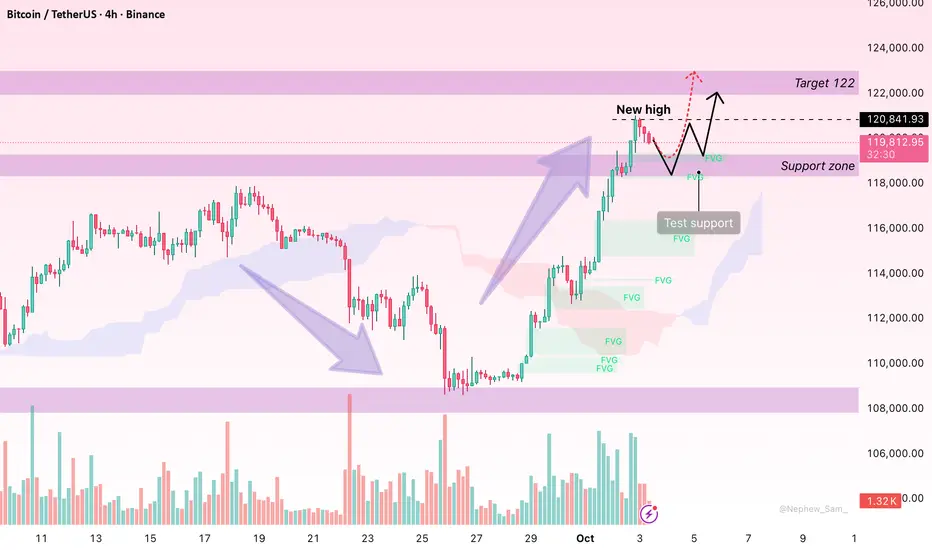
Bitcoin: Mild Pullback Before Eyeing Fresh HighsHello everyone, Bitcoin continues to capture attention after reaching a peak of 120,324 USD before easing slightly to around 119,793 USD. This pullback is viewed as a technical pause within a broader uptrend rather than a sign of reversal.
From a technical perspective, BTC remains above the Ichimoku cloud and is supported by FVG zones around 119,000–118,500 USD. Trading volume surged at the 120,000 USD level, highlighting strong institutional buying and reinforcing the bullish outlook.
On the news front, the US dollar is weakening due to the risk of a government shutdown, while capital inflows from ETFs and major institutions continue to flow into the market. Combined with the current low interest rate environment, Bitcoin increasingly stands out as an attractive safe-haven asset.
In the near term, Bitcoin is expected to hold support at 119,000–118,500 USD and rebound towards 122,000 USD, with extended targets at 125,000 USD and even 128,000 USD if momentum remains strong.
Only a break below 118,500 USD would open the door for a deeper correction towards 117,800–116,500 USD before recovery attempts resume.
What’s your view? Will BTC/USDT hold the line and move on to conquer 125,000 USD?
Trading Strategy
Hello, fellow traders!
By "Following" us, you'll always receive the latest information quickly.
Have a great day.
-------------------------------------
The conditions that lead people to start trading vary.
Before starting a trade, you should consider a trading strategy.
A trading strategy should include:
1. Investment period
2. Investment size
3. Trading method and profit realization method
You should categorize the coins (tokens) you wish to trade based on items 1-3 above.
1. The investment period is the most important.
While the investment period varies from person to person, BTC and ETH are generally considered long-term investments.
Since BTC and ETH are important coins that support the cryptocurrency market, I recommend investing in either BTC or ETH.
All coins other than BTC are broadly categorized as altcoins. However, among them, BNB, SOL, XRP, TRX, and ADA LINK, which have high market capitalizations and have been around for a long time, are suitable for mid- to long-term investment.
However, since these coins are also broadly categorized as altcoins, it's recommended to increase the number of coins (tokens) that generate income, if possible, for mid- to long-term investment.
This method involves selling the original purchase price (plus transaction fees) when the price rises, leaving the remaining coins (tokens) available for profit.
This allows you to increase the number of coins (tokens) with an average purchase price of zero, making mid- to long-term investment feasible.
While it's certainly advisable to sell your holdings to generate cash profits, this practice is not suitable for mid- to long-term investment.
This is because if you make a mistake, you could end up buying at a high price and incur losses for a long period of time.
-
2. You should determine your investment size based on your investment period.
In other words, if you're making a long-term investment and have already invested all your capital, you could miss out on good opportunities in the future.
Therefore, it's best to invest in the following order: long-term investment < mid- to long-term investment < short-term investment.
Furthermore, you should keep approximately 20% of your total investment in cash.
This allows you to trade when a good opportunity arises.
If you run out of cash after trading, try to sell when the price rises to secure cash.
Furthermore, you should avoid investing in too many coins (tokens).
-
3. Once you've determined your investment period and size, you need to find the right buy and sell points for actual trading.
Therefore, you need to define your trading method and profit-making method.
The basic trading strategy is to buy in the DOM(-60) ~ HA-Low range and sell in the HA-High ~ DOM(60) range.
However, if the price rises in the HA-High ~ DOM(60) range, a stepwise upward trend is likely, while if the price falls in the DOM(-60) ~ HA-Low range, a stepwise downward trend is likely.
Therefore, the basic trading strategy should be a split trading strategy.
In other words, if you buy in the DOM(-60) ~ HA-Low range and the price rises to form the HA-High ~ DOM(60) range, it's best to sell in splits and observe the situation.
This stabilizes your psychological state, allowing you to re-analyze the charts.
Maintaining a stable psychological state is crucial for trading.
If your psychological state is unstable, you're more likely to make unexpected trades.
Therefore, it's important to have a basic trading strategy that suits your investment style.
As mentioned earlier, to maintain a mid- to long-term investment, you need to decide whether to increase the number of coins (tokens) that generate profits or to generate cash returns. Before conducting a trade, you need to decide whether to do so.
Since the coin market is increasingly interconnected with the stock market, you can try to interpret it using the same method as the stock market.
In other words, rather than examining the flow of funds within the coin market itself, you should prioritize assessing the stock market, social issues, the economy, and politics to determine market trends.
I believe this problem stems from a lack of understanding of the coin market.
While some external factors may influence the flow of funds within the coin market, they are not suitable for predicting it.
Therefore, you should check the USDT, USDC, USDT.D, and BTC.D charts to confirm the flow of funds within the coin market.
Next, you should check the charts of the coin (token) you wish to trade to determine if it fits your basic trading strategy and develop a trading strategy.
Finally, by examining issues beyond the coin market, you can make an objective decision about your trading.
Otherwise, you will likely make inappropriate trades based on subjective opinions stemming from issues outside the coin market.
To analyze and interpret the coin market like the traditional stock market, the two markets must be integrated.
Otherwise, I believe the coin market should not be analyzed or interpreted like the stock market.
-
Thank you for reading to the end.
I wish you successful trading.
--------------------------------------------------

New sell above 123K$ with low risk setupWe are long-term bullish yet and looking for at least targets like 130K in this market but also remember that price had huge amount of rise and gain and now short-term correction is needed.
so we are looking for dump and correction to one of the major support zones mentioned on the chart.
Bitcoin: Possible ScenariosBTC daily has closed above 119k, keeping the probability of a breakout to a new high.
I suggest possible scenarios:
Failure to break above 124k from current levels and the formation of a Head & Shoulders right shoulder.
Reasons: monthly timeframe divergence, overbought conditions, open interest imbalance, longs clearly outnumber shorts.
Move to 130k from current levels.
Reasons: crypto hype is still very strong, global recognition, government reserves, ETFs, strong pressure toward the 120k level, higher lows being formed.
Breakout to a new high via a short squeeze, but sustained growth will be lacking.
In this case, buyers will mostly be short-sellers being liquidated, with insufficient real demand to support price at higher levels. The move would wipe out the remaining weak shorts, after which a correction back to 108k–100k could follow.
Reasons: monthly timeframe divergence, overbought conditions, open interest imbalance, excessive number of longs, too much hype and euphoria, political chaos in the US, overheated markets in general, especially the stock market.
Crypto can surprise, but the technical picture still suggests a correction is approaching. This does not change my belief in Bitcoin’s long-term growth to seven-digit valuations — but not in a single rocket move, and not tomorrow.

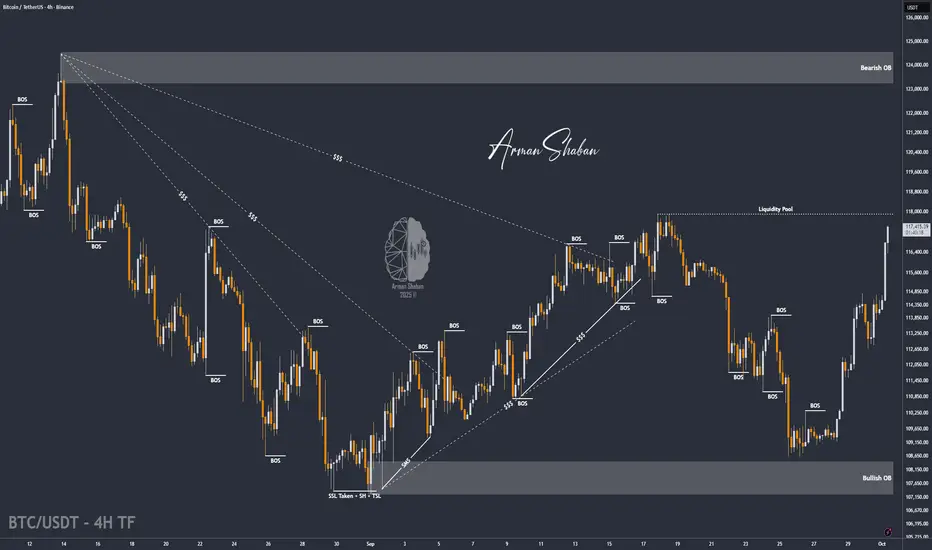
BTC/USDT | BTC Rally +7% Gains – Bulls Still in Control (READ)By analyzing the Bitcoin chart on the 4-hour timeframe, we can see that the price continued its rally as expected, hitting the $115K target and now reaching up to $117,200, just one step away from the next target at $118K. So far, this analysis has delivered more than 7% gains. I hope you made the most out of it!
Please support me with your likes and comments to motivate me to share more analysis with you and share your opinion about the possible trend of this chart with me !
Best Regards , Arman Shaban
Bitcoin Faces $120K Resistance – Bull Trap or Breakout?Bitcoin ( BINANCE:BTCUSDT ) continued its uptrend of the last 2-3 days as I expected in my previous idea . Today, the announcement of the ADP Non-Farm Employment Change index worked like a catalyst for Bitcoin .
Bitcoin is currently surrounded by Resistance zones and a Potential Reversal Zone (PRZ) , and is near the important price of $118,400(Volumetric importance) and the $120,000(Round Number) .
From the perspective of Elliott Wave theory , it seems that Bitcoin could be in corrective waves and that the increase of the last few days could only serve as a Bull Trap .
I expect Bitcoin to decline at least to the Support lines .
Cumulative Long Liquidation Leverage: $113,590-$111,900
Cumulative Long Liquidation Leverage: $115,823-$115,087
Cumulative Short Liquidation Leverage: $120,000-$118,000
Note: If Bitcoin falls below the Support zone($114,820-$113,180), we should expect further declines.
CME Gap: $111,355-$109,915
Stop Loss(SL): $120,103
Please respect each other's ideas and express them politely if you agree or disagree.
Bitcoin Analysis (BTCUSDT), 1-hour time frame.
Be sure to follow the updated ideas.
Do not forget to put a Stop loss for your positions (For every position you want to open).
Please follow your strategy and updates; this is just my Idea, and I will gladly see your ideas in this post.
Please do not forget the ✅' like '✅ button 🙏😊 & Share it with your friends; thanks, and Trade safe.

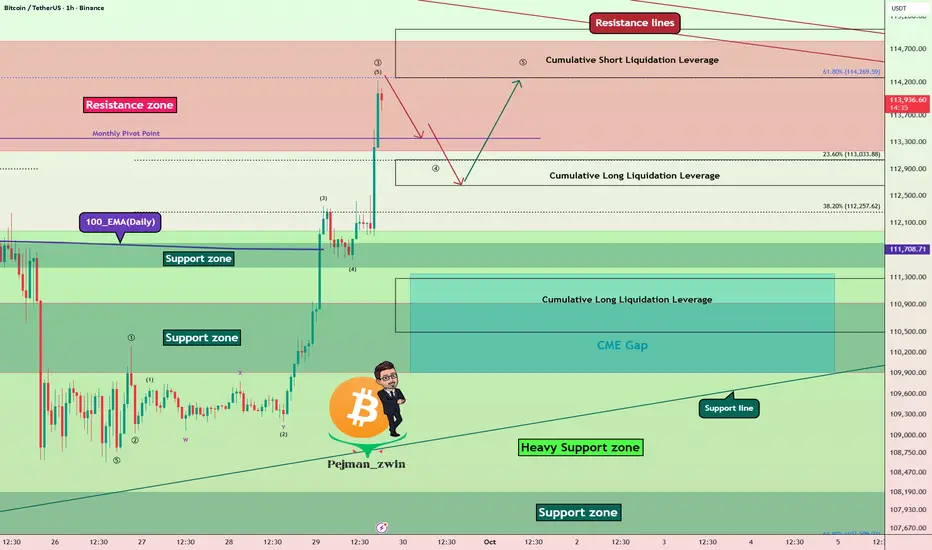
Bitcoin Resistance Zone Battle – ATH or Fakeout?Bitcoin ( BINANCE:BTCUSDT ) has shown strong momentum over the past 5 days , liquidating many traders in both Long and Short positions .
Bitcoin has now entered the Resistance zone($114,820-$113,170) and is moving near the Cumulative Short Liquidation Leverage($115,000-$114,272) and Resistance lines .
From an Elliott Wave Theory perspective, given Bitcoin’s strong bullish momentum over the past 24 hours, it appears to be completing Wave 3. This Wave 3 seems to be of the extended type.
I expect Bitcoin , after a correction , to make another attempt toward the Resistance zone($114,820-$113,170) and potentially test the Resistance lines .
Do you think this bullish move could lead to a new all-time high (ATH) for Bitcoin?
Cumulative Long Liquidation Leverage($113,037-$112,650) + Near Monthly Pivot Point($113,356): An area where Bitcoin could start rising again (if there is a correction, of course).
Cumulative Long Liquidation Leverage: $111,100-$110,500
CME Gap: $111,355-$109,915
Note: Also, Bitcoin approaching the 61.8% golden Fibonacci level could lead to a Bitcoin correction.
Please respect each other's ideas and express them politely if you agree or disagree.
Bitcoin Analysis (BTCUSDT), 1-hour time frame.
Be sure to follow the updated ideas.
Do not forget to put a Stop loss for your positions (For every position you want to open).
Please follow your strategy and updates; this is just my Idea, and I will gladly see your ideas in this post.
Please do not forget the ✅' like'✅ button 🙏😊 & Share it with your friends; thanks, and Trade safe.
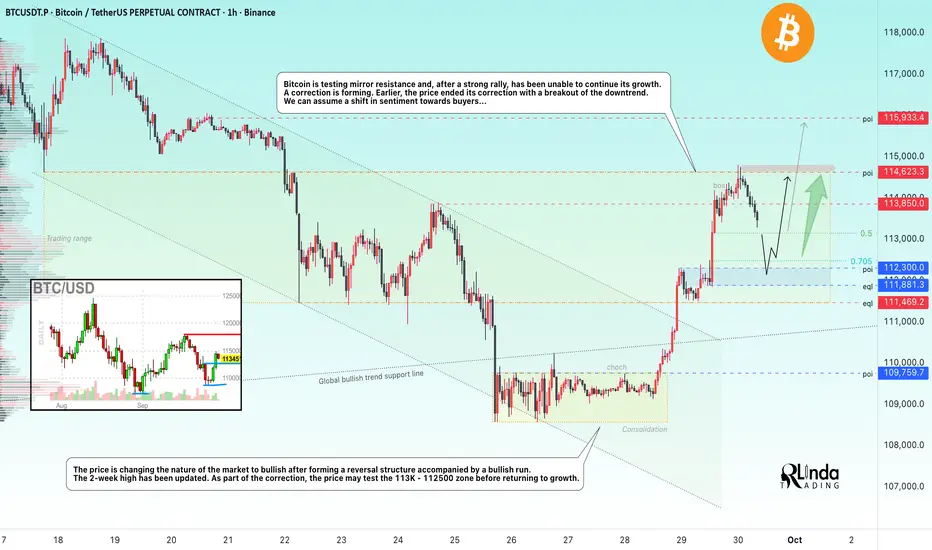
BITCOIN → Correction before the breakout of 114.5KBINANCE:BTCUSDT , after the end of the correction, is forming a 3.5% rally and testing the important milestone of 114,600. It was not possible to break through the level without consolidation and at such a high speed. How long will the correction last?
Bitcoin is testing mirror resistance and, after a strong rally, was unable to continue its growth. The reason for the halt is a huge liquidity pool above 114,600. A pullback is forming. Earlier, the price ended a 3-week correction by breaking through the downward resistance. We can assume a change in sentiment towards the buyer...
Technically, the price is changing the nature of the market to bullish after the formation of a reversal structure accompanied by a bullish run. The 2-week high has been updated.
Resistance levels: 113850, 114620, 115900
Support levels: 113100, 112300, 111800
As part of the correction, the price may test the 113K - 112500 zone before returning to growth. If the market holds the price above 112K - 113K, it will confirm the bullish sentiment, and the positive fundamental background will support further growth.
Best regards, R. Linda!
BTCUSDT: Potential Reversal at Key Support👋Hello everyone, what do you think about the trend of BINANCE:BTCUSDT ?
Bitcoin is currently undergoing a short-term correction after forming a peak above $114,500. The price is now heading toward a key support zone around $110,000, which is also seen as an important confluence zone.
If Bitcoin stabilizes here and confirms the support level, we could see another potential bounce, pushing it back towards previous resistance levels. Pay attention to the possibility of a price reversal from this support zone, as it might create a buying opportunity.
What do you think about BTCUSDT? Let me know your thoughts in the comments below!
Good luck!

