Bitcoin growthlook this chart
whithout tecnical
auto_awesome
Translate from: Persian
Just a simple look.4How is it possible that this chart does not grow?
USDTBTC.P trade ideas

$BTC BULL RUN RALLY & Showing a WOLF PATTERN 2025Road to Bull Run 2025, price Growing upward movement starting at $108K — $115K — $122K — 128K — $136K Who Entry at $111K and using $100K stoploss.
Bitcoin trades near $116,200, rebounding from $109,000. A close above $117,500 may boost buying, while rejection could trigger profit-taking. Key support is at $113,000. Traders are anticipating a 99% chance of a 25 basis points rate cut at the next Federal Open Market Committee meeting, which is viewed as favorable for Bitcoin. Bitcoin surged past $116,000, rising nearly 3% in a single day, following the U.S. government shutdown.
Key facts: Bitcoin trades near $116,200, rebounding from $109,000. A close above $117,500 may boost buying, while rejection could trigger profit-taking. Key support is at $113,000.
#Write2Earn #BinanceSquareFamily #Binance #BTC☀ #SUBROOFFICIAL
Disclaimer: This article is for informational purposes only and does not constitute financial advice. Always conduct your own research before making any investment decisions. Digital asset prices are subject to high market risk and price volatility. The value of your investment may go down or up, and you may not get back the amount invested. You are solely responsible for your investment decisions and Binance is not available for any losses you may incur. Past performance is not a reliable predictor of future performance. You should only invest in products you are familiar with and where you understand the risks. You should carefully consider your investment experience, financial situation, investment objectives and risk tolerance and consult an independent financial adviser prior to making any investment.

Continue uptrend if..."Continue the uptrend as the price remains strong after breaking through the zone."

BTC Game Plan – (LDMD Model)BTC Game Plan – (LDMD Model)
📊 Market Sentiment
FED has resumed its rate-cutting cycle, starting with a 0.25% cut in September, with two more expected. Institutional liquidity inflows have accelerated as the U.S. officially adopts crypto as part of its reserves. Despite elevated inflation, a weakening labor market is forcing the FED to ease, pushing more capital into risk-on assets.
📈 Technical Analysis
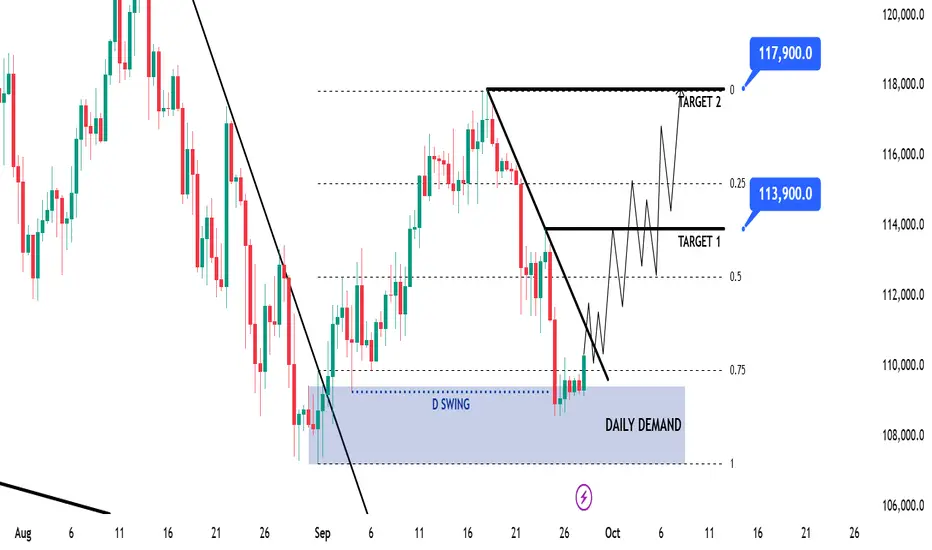
BTC is trending strongly bullish on the HTF, so long setups remain the priority. Recently, price broke the bearish trendline that had capped price action since August 13, signaling a shift in momentum. That breakout created a Daily Demand zone, which was tapped once before price moved higher — confirming liquidity inside the zone.
Currently, BTC ran the daily swing low (the first tap of that demand), revisited the Daily Demand, and repriced into the 0.75 Fibonacci max discount level. This strong confluence suggests accumulation and potential continuation higher.
📘 Model to be used – LDMD (Liquidity Run inside Daily Demand w/ Max Discount Zone)
In this model, I start by confirming the HTF trend to set directional bias. Then, I identify key Demand/Supply zones that carry significant liquidity. A sweep of HTF swing lows adds confluence by trapping liquidity. Finally, I align this with the 0.75 max discount retracement zone for a high-probability entry point.
📌 Game Plan
1-Wait for a daily close above the bearish trendline.
2-Enter long on confirmation.
🎯 Setup Trigger
Daily close above the bearish trendline.
📋 Trade Management
Stoploss: 108,500$
Targets:
TP1: 113,900$
TP2: 117,900$
After TP1, move SL to breakeven to secure profits.
💬 Like, follow, and comment if this breakdown supports your trading! More setups and insights coming soon — stay connected!
⚠️ Disclaimer: This content is for informational and educational purposes only and does not constitute financial, investment, or trading advice. Always DYOR before making any financial decisions.
BTCUSDTHello Traders! 👋
What are your thoughts on BITCOIN?
Bitcoin is still moving inside an upward channel.
After its strong rally, the price has entered a corrective phase and is now positioned around the midline of the channel.
We expect the correction to extend toward the support zone and the lower boundary of the channel after some short-term fluctuations.
From that area, a potential rebound could trigger the next bullish wave.
If support holds, Bitcoin is likely to resume its upward movement toward the upper boundary of the channel.
As long as the price stays above the key support area, the medium-term outlook remains bullish.
What do you think? Will Bitcoin bounce from the channel bottom and head for the top again?
Don’t forget to like and share your thoughts in the comments! ❤️

btc shortWe had a 4H buy-side sweep above 118.1k followed by rejection. This confirmed the short idea from earlier.
What Happened:
Price ran external liquidity above the 4H high (118.1k).
Immediate rejection → confirmed it was a liquidity grab, not continuation.
A Fair Value Gap (FVG) formed on the 15m during the rejection. Price traded back into it and respected it, offering optimal short entry.
Now we’re breaking lower, with sell-side liquidity levels in sight.
Current View:
Structure: Bearish on 15m after sweep + BOS (Break of Structure).
Order Flow: Premium short entry confirmed with FVG mitigation.
Bias: Looking for price to seek lower inefficiencies and equal lows.
Targets Ahead:
🥇 116.8k → first liquidity pool (just got tagged).
🥈 115.8k → inefficiency fill.
🥉 115.5k → deeper liquidity run.
Invalidation:
If BTC reclaims 118.2k, the bearish thesis is invalid.
⚡This is textbook ICT: 4H BSL sweep → M15 market structure shift → FVG entry → downside targets.

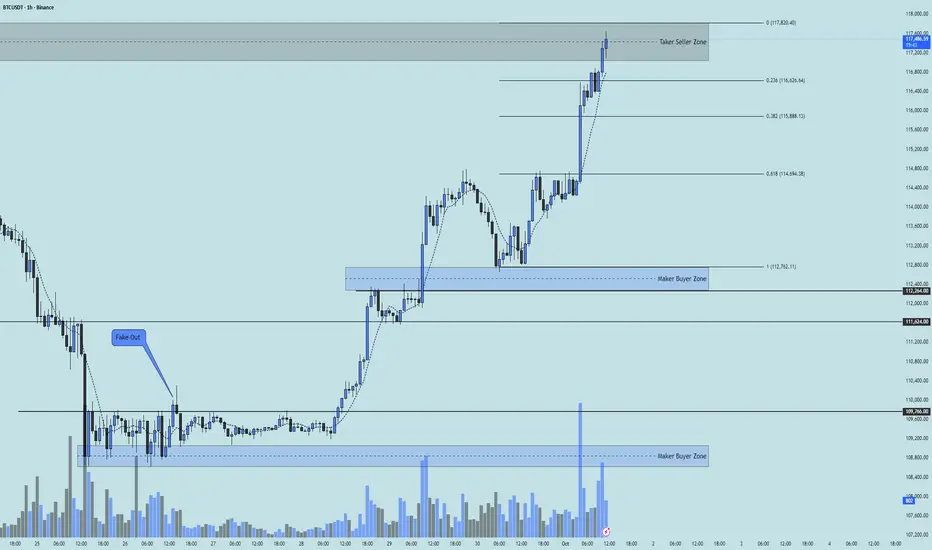
BTC 1H Analysis - Key Triggers Ahead | Day 49❄️ Welcome to the cryptos winter , I hope you’ve started your day well.
⏰ We’re analyzing BTC on the 1-Hour timeframe .
👀 On the 1-hour chart , After a strong bullish rally and breaking the $109,766 zone, BTC managed to move toward $117,000. This level is considered a multi–timeframe daily resistance, and personally I expect a correction here. The second bullish leg, which started after breaking the $111,624 resistance and buyers' micro support at $112,762, is now facing weakness. RSI is also showing reversal signals. The current BTC scenario is a correction toward the marked Fibonacci zones. The upcoming resistance is extremely important, and if it breaks, Bitcoin can continue upward.
🧮 Looking at the RSI oscillator, during both bullish legs it managed to stay firmly in overbought territory, and long-position volatility has significantly increased along with rising buy volume. On the 1H timeframe, RSI doesn’t have a specific key level right now because it has hit a significant swing resistance on the daily timeframe. Breaking out of the marked zone can push BTC higher. This key swing level on the daily RSI is around 61.
🕯 Volume, count, and size of bullish candles have sharply increased. Considering we are sitting at a resistance zone, traders are putting in maximum effort to break it, and volume is rising aggressively. Every sell candle that formed was engulfed by buyers immediately as BTC dipped, and buyers created new positions. Our trend is strongly bullish.
🎮 The Fibonacci is drawn from the start of the new bullish leg to the top of the previous 1H candle's wick. It has identified strong support zones in case BTC corrects, and these levels are considered highly reliable.
📊 The Bitcoin liquidation heatmap currently shows the distribution of short positions, and this spread continues up to $119,000. With upward movement and buyer support, these clusters can get absorbed and liquidated, leading to a short squeeze and a strong move up. Note that the cluster of short liquidations down to $113,000 could get triggered with maximum selling pressure, and this scenario isn’t far-fetched.
🧠 If you haven’t entered a BTC position based on previous analyses, you can wait for corrective support zones to form. Buyer tickers will place their orders below these support levels so we can gain full confirmation before making a BTC entry.
↗️ Long Position Scenario: A break above the seller ticker zone and grabbing accounts holding short positions is required to reduce short-position clusters. Then we need confirmation above our seller ticker zone at $117,820. With the start of a new bullish leg and an indecision candle plus a 7 SMA touch from below, we can open a low-risk long position.
📉 Short Position Scenario: If BTC forms a lower high and lower low with maximum selling pressure, negative economic news, and loses key Fibonacci zones — especially the 61% level — we can consider opening a short. However, as I mentioned in previous days, avoiding shorts and focusing on longs is currently much more in our favor.
❤️ Disclaimer : This analysis is purely based on my personal opinion and I only trade if the stated triggers are activated .
BTC/USDT ; Is the shedding over?Hello friends
Due to the price correction we had, the price has bounced back into a good support area where there were many buy orders and has reacted well.
Now it remains to be seen whether it will succeed in defeating the trading pain or not.
If buyers continue to support the price, it could break the range and move towards the specified targets.
*Trade safely with us*

BtcusdtThey just trapped the last late greedy bulls . Haven’t seen the OBV this bad last time it was this bad btc couldn’t keep going up and crashed 17% I will bought sbit the btc inverse down 5% already I would probably close it at 118k but I doubt it will go that high . just my thoughts

Ready for BTC/USDT's Next Big Move?🎉 BTC/USDT: "Bitcoin vs. Tether" Crypto Wealth Heist Map (Swing/Day Trade) 🤑
🚨 Thieves of the Crypto Market, Assemble! 🚨
Ready to pull off a stylish swing/day trade heist on BTC/USDT? This is your Crypto Wealth Strategy Map with a bullish setup that’s screaming opportunity!
📈 Let’s dive into this cheeky yet professional plan with a sprinkle of thief swagger to snatch those profits! 💰
📊 The Setup: Why This Trade is a Steal! 🕵️♂️
Bullish Confirmation: We’ve got a double bottom pattern signaling a potential reversal. ✅
Accumulation Zone: Price action shows buyers stacking up, ready to push BTC higher. 🛒
Heikin Ashi Reversal: Smooth, green Heikin Ashi candles confirm the bullish vibes. 🟢
Market Sentiment: The crypto streets are buzzing with optimism — time to capitalize! 😎
The Thief’s Entry Plan: Layered Limit Orders 💸
This is where our thief strategy shines! We’re using a layering strategy with multiple buy limit orders to sneak into the market like the slick bandits we are. 🕴️
Entry Levels:
🎯 $112,000
🎯 $113,000
🎯 $114,000
🎯 $115,000
🎯 $116,000
Pro Tip: Feel free to add more layers based on your risk appetite! Stack those orders like a master thief planning the perfect heist. 😏
Why Layering?: This approach lets you average into the position, reducing risk if the market pulls a fast one. 🃏
🛑 Stop Loss: Protect Your Loot! 🔒
Thief’s Stop Loss: Set at $110,000. This is our escape hatch if the market turns into a trap. 🕳️
Note: Dear Thief OGs (Ladies & Gentlemen), this SL is just a suggestion. You’re the boss of your own vault — adjust it to your risk tolerance! 💪
🎯 Target: Cash Out Like a Pro! 🏦
Profit Target: Aim for $127,000, where we expect strong resistance and potential overbought conditions. Watch out for a possible trap — don’t get greedy! 😈
Note: Dear Thief OGs, this TP is my take. You decide when to grab your profits and vanish into the crypto night. 🌙 Take the money and run at your own discretion!
🔗 Related Pairs to Watch 👀
Keep an eye on these correlated pairs (all in USD) to confirm the broader market trend:
BITSTAMP:ETHUSD : Ethereum often moves in tandem with Bitcoin. A bullish ETH could reinforce BTC’s upward momentum. 📈
BITSTAMP:XRPUSD : Ripple’s price action can signal broader crypto market strength. Watch for similar bullish patterns. 🌊
COINBASE:LTCUSD : Litecoin tends to follow BTC’s lead. A breakout in LTC could confirm our bullish bias. ⚡
Key Correlation Insight: These pairs often move together due to shared market sentiment in the crypto space. If BTC/USDT pumps, expect ETH, XRP, and LTC to potentially follow suit. Cross-check their charts for confluence! 🧠
🛠️ Technicals Recap: The Thief’s Toolkit 🧰
Double Bottom: A classic reversal pattern signaling bulls are ready to charge. 🐂
Accumulation Zone: Buyers are quietly stacking positions — a sign of strength. 📦
Heikin Ashi: Smooth candles filter out noise, confirming bullish momentum. 🕯️
Resistance Watch: $127,000 is a key level where sellers might step in. Stay sharp! ⚠️
⚠️ Disclaimer: Thief Style, Just for Fun! 😜
This Thief Strategy is for entertainment and educational purposes only. Trading is risky, and the crypto market can be a wild ride. Always do your own research (DYOR) and manage your risk like a seasoned bandit. I’m not a financial advisor, just a cheeky chart enthusiast sharing the vibe! 😎
✨ If you find value in my analysis, a 👍 and 🚀 boost is much appreciated — it helps me share more setups with the community!
#BTCUSDT #CryptoTrading #SwingTrading #DayTrading #ThiefStrategy #Bullish #TechnicalAnalysis #HeikinAshi #DoubleBottom #MakeMoney

BtcusdtBears have the momentum in the weekly , no news other than saylor buying btc 😂 on the monthly bulls buying pressure is getting weak . I think the market will hit 100k in the coming weeks

BTC 4H – Testing 116k, Key Supply AheadBitcoin bounced strongly from the 109k demand zone and broke above 114k.
Now testing the 116k–117.2k supply zone, which is the key area to watch.
✅ Bullish: Break & hold above 117.2k opens the way to 118k – 120k.
❌ Bearish: Rejection from 116k–117.2k could trigger a pullback to 114k → 111k.
Key Levels:
Supports: 114k / 113k / 111k / 109k
Resistances: 116k / 117.2k / 118k / 120k
⚡️ 116k–117.2k is the decision zone for the next move.

BITCOIN BTCUSDTi will be watching the buy power into 115,606-117,430 for possible rejection as seen on weekly time frame double top structure.
the descending trendline will be watched for breakout ,if we break out of the trend then our target will 124k ,break of 124k will be 141k-139K zone
on weekly time frame we are coming for retest into 117k-115,606,pls watch this zone because of bearish reversal..
watch bitcoin on daily time frame and the structure is clear on price action.
if respected then the sell will drop below 107 zone and target will be 100k-98k zone and 93-94k
layer by layer dont rush.
#bitcoin #btc #btcusdt #crypto

Next Volatility Period: Around October 3rd (October 2nd-4th)
Hello, fellow traders!
Please "Follow" to get the latest information quickly.
Have a great day!
-------------------------------------
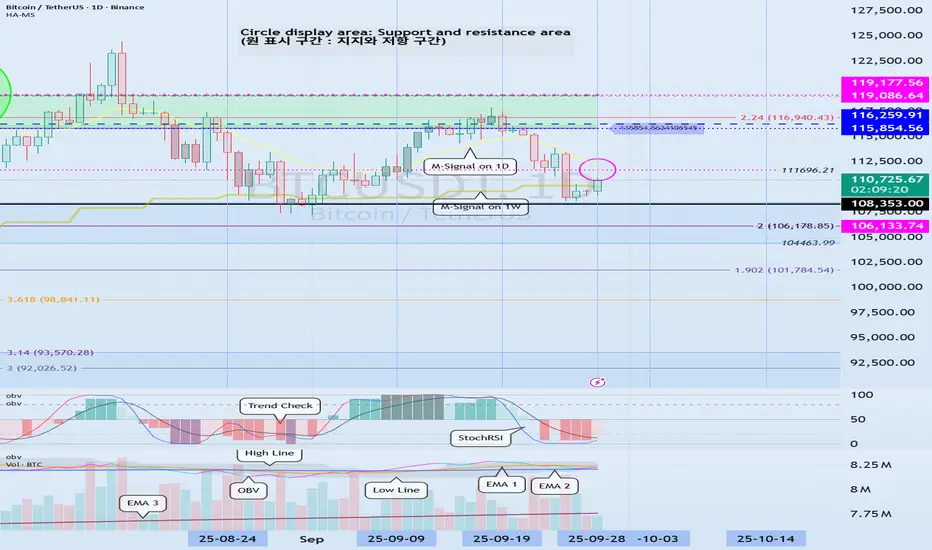
(BTCUSDT 1D Chart)
This volatility period lasts until September 29th, but since the next volatility period is around October 3rd (October 2nd-4th), it's highly likely that the volatility period will continue until October 4th.
Therefore, we need to see if the price can sustain above 11696.21 after the volatility period.
If it fails to do so and falls below the 104463.99-108353.0 range, a sharp decline is likely.
If a sharp decline occurs, we need to check for the formation of new indicators such as the DOM (-60) or HA-Low indicators.
If new support is formed, it's important to determine whether there is support near that area.
If support is not found, a step-down trend is likely.
-
It is currently located near the M-Signal indicator on the 1W chart and the M-Signal indicator on the 1D chart.
Therefore, if the price rises above 111696.21 and holds, further upward movement is likely.
At this point, the key question is whether the price can rise above 115854.56 and hold.
To sustain the uptrend,
- The StochRSI indicator must show an upward trend. It must rise from the oversold zone.
- The On-By-Signal (OBV) indicator must show an upward trend. It must rise above EMA 1 and, if possible, above the High Line and remain there.
- The TC (Trend Check) indicator must show an upward trend. It must rise above the 0 point and remain there.
If the above conditions are met, the uptrend is likely to continue above 111696.21.
-------------------------------------------
The basic trading strategy is to buy in the DOM(-60) ~ HA-Low range and sell in the HA-High ~ DOM(60) range.
However, if the price rises in the HA-High ~ DOM(60) range, a stepwise upward trend is likely, while if the price falls in the DOM(-60) ~ HA-Low range, a stepwise downward trend is likely.
Therefore, the basic trading strategy should be a segmented trading approach.
This basic trading strategy principle was developed for trading on Heikin-Ashi charts.
Adding the M-Signal indicator on the 1M, 1W, and 1D charts allows you to see the overall trend.
The remaining indicators indicate support and resistance points or zones for chart analysis or trading strategies.
Trading is all about reaction, so understanding support and resistance points or zones is crucial.
However, you should interpret the charts based on core fundamental trading strategies.
-
Thank you for reading to the end.
I wish you successful trading.
--------------------------------------------------
- Here's an explanation of the big picture.
(3-year bull market, 1-year bear market pattern)
I'll explain more in detail when the bear market begins.
------------------------------------------------------
BTC market snapshotThe U.S. government has gone into a shutdown, and crypto reacted with growth on the dollar’s weakness. HOWEVER, the short signal is strengthening. The monthly close reinforced the short signal for me personally, which doesn’t mean it will play out tomorrow. From current levels, there’s still a chance to update the highs if we break out above the 116K–117K zone.

Ichimuko talks againAccording to BTC price action based on ichimuko clouds we can see that the last time BTC have crossed the red cloud it leaded to a new Ath
Today is the first day of breaking it again
We expect a new ATH as soon as possible
Stop loss under the cloud around 11k
Tp at least 128k
Dyor

BTC/USDTI think wave 2 of C has completed, I will open a short position for wave 3 of C with this setup.

Forecast for BTCUSDT 1st October 2026 (Updated)Forecast for BTC for the next 4 weeks. Continuation to ~$115k-$117k followed by a retrace to ~$106k then continuation up to ~$115k-$117k retest followed by a huge dump to ~$98k-100k then up to new all time high, ~$150k-$170k

Bitcoin long monthly closeJust went long on bitcoin. Aiming for $116000.
I think the monthly candle likely will close as a bullish engulf or attempt to close bullish on the monthly around $116000 area
Sl: 112952
Tp $116000

Bitcoin to retest the trendline the formation of a third leg on the trendline before a bullish takeoff is expected on the daily TF. Bitcoin on a bullish trend mean we can only anticipate a buy eventually it didn't break the trendline. the price is expected to reach the 130,000 price level.

Where can Bitcoin Go? Part 2🌟 Bitcoin's Breakout Surge: Professor's Big Charts Revealed 🌟
Part1 was a Legendary one with amazing, pin-point precision from miles away:
📈 Live Analysis
Watch thean in-depth journey through Bitcoin's latest surge as we go live on TradingView. Get ready for a session packed with insights and the unveiling of the Professor's big chart. Join us: Live Stream: www.tradingview.com
🚀 The Breakout Chart Breakdown
Witness the bullish momentum as Bitcoin smashes past the $47,650 barrier. With my analysis, we're looking at a bull run targeting $59.9K,
69K
, and the ambitious $79K. 🎯 Stay bullish and watch as the charts unfold the story live!
💹 Historic Patterns: A Roadmap to $79K
Reflect on the last breakout at $31,100 and its staggering rise to $46,000. Our charts have been the compass leading us to these profitable winds. Don't miss out as we dissect the potential climb to $79K, live!
🔍 Last Year's Chart: The Trendline Triumph
Cast your minds back to January 2023, when Bitcoin was a humble $18,000. Fast forward, and we're witnessing a breakout reminiscent of December 2020's rally from $7,500 to $24,000. Could we be on the cusp of reaching new all-time highs? Let's explore together.
⏱️ Halving Cycles: This Time It's Different
Every cycle writes its own story, and this one's no exception. We're approaching the halving with a market more aware and ready to advance. Tune in as we analyze why we might see an all-time high sooner than the previous cycles.
🌐 Join the Live Stream for the Full Picture
There's much more to cover, from halving cycles to breakout patterns. Ensure you're part of the live session for a comprehensive analysis that could redefine your trading strategy.
Catch the full live session and secure your front-row seat to Bitcoin's exciting journey: Join the Live Stream: www.tradingview.com
One Love,
The FXPROFESSOR 💙

Where Can Bitcoin Go? Part 9 – Breakout and History in Motion🌋🚀 Where Can Bitcoin Go? Part 9 – Breakout and History in Motion. 🔓💥
The breakout over 114900 has happened.
After 2 rejections, years of preparation, and countless fakeouts… Bitcoin has finally cleared the $114,921 barrier.
We are now officially in price discovery mode within the upper resistance channel.
📍 As long as BTC stays above $114,900 – we are long.
This level is now our trigger line. Lose it? Flip back to short bias. Hold it? There’s only one word: 🚀
🔑 Context:
We’ve tracked this structure since 2023 using a 1-2-3 model based on macro highs. The third test is always the decider — and this time, we broke through.
✅ Test 1: Rejected (2021)
✅ Test 2: Rejected (2025)
✅ Test 3: Breakout confirmed (July 2025)
Now compare that to previous cycles:
2016 halving → ATH in 2017
2020 halving → ATH in 2021
2024 halving → ATH coming by end of 2025?
🧭 Based on this map, BTC’s next structural targets are:
→ $137K
→ $160K
→ $182K+
But there’s a catch: if we fall back below 114,900, the entire breakout thesis is at risk. This is now a binary zone.
⚠️ What to Watch:
📌 Support Retests:
Expect volatility around the 114.9–116K level. This zone will now be stress-tested.
📌 Media Frenzy vs Structure:
As hype increases, stick to levels — not noise.
📌 Ultimate FOMO vs Breakdown:
Hold structure = ATH potential
Lose structure = Down we go, potentially hard.
🎥 Missed the full structural breakdown?
👉 Watch “Where Can Bitcoin Go? Part 8” for the blueprint
👉 This is now Part 9 – The terminal move has begun
We are now playing for cycle maturity – this could be the final leg before topping out in late 2025.
Let’s trade it with clarity, not emotions.
One Love,
The FXPROFESSOR 💙
Disclosure: I am happy to be part of the Trade Nation's Influencer program and receive a monthly fee for using their TradingView charts in my analysis. Awesome broker, where the trader really comes first! 🌟🤝📈
🚨 BITCOIN HAS BROKEN OUT but keep in mind: under 114900 be OUT!

Trigger: 4h-close above 114,826 (Donch-H20)Snapshot of the last 4h candle + what does it mean
Price: ~114 314.7
VWAP (the entire period): ~114 199.5, z(Price−VWAP) ≈ 0.36 — the price is moderately higher than the "fair" price over 100 candles; there is no overheating according to VWAP, but there is a positive slope.
aVWAP (multiple anchors): start 114 199.5 / 60d 114 096.5 / from swing low 112 682.1 / from swing high 112 128.1 — trading above all aVWAP, trend support from below.
Donchian 20/55:
20: H 114 825.7 / M 111 969.8 / L 109 113.9 — channel of the last 20 candles; exit above H = update of the loc. extremum.
55: H 115 623.8 / M 112 086.9 / L 108 550.0 — wider context of the range.
Volume Profile (~60d): POC ~115 112.5 / VAL ~109 261 / VAH ~120 964 — currently slightly below POC, within the value zone (VAL↔VAH). POC is a magnet; VAH is the top of the demand corridor.
HVN/LVN landmarks: maximum volume nodes near POC ~115k and in the area ~121k (closer to VAH); thin spots (LVN) — ~109–110k.
RSI(14): ~67.5 — close to the overbought zone, bullish momentum.
MFI(14): ~81.1 — overbought by money, the movement was driven by volume inflow.
CMF(20): ~+0.27 — steady positive cash flow (buyers control).
MACD(12,26,9): 838 > 558, hist +280 — bullish momentum persists.
ADX(14): ~41.4; +DI 33 / −DI 15 — the trend is strong and upward.
ATR(14): ~928$ — average true range; used for buffers/stops.
Keltner: Upper 114 202 / Mid(EMA20) 112 377 / Lower 110 553 — we are standing right above the upper edge, a sign of a trend "throw."
Bollinger(20,2): Upper 115 722 / Mid 111 760 / Lower 107 798 — there is still room for the BB-Upper; there is no compression.
z(Price−VWAP) : 0.36 — a small premium to the "fair" price, allows the trend to continue without mandatory unloading.
OBV z-scores: z50 +1.54 / z100 −0.43 / z200 −0.96 — short-term inflow, medium-/long-term — not yet fully confirmed (traces of previous outflow). OBV ROC(10) ≈ −0.28 — the inflow rate has cooled locally.
Open Interest: ~67.44k, z(168) ≈ −0.79, ROC(5/10) ≈ −1% / +4% — OI is below average: some of the growth may have been due to the covering of shorts rather than the addition of fresh longs. For a sustained uptrend, it would be desirable to see a stabilization/growth in OI.
Latest divergences (by auto-detector)
RSI: bullish 22 Sep 07:00 → 22 Sep 19:00, bullish 22 Sep 19:00 → 23 Sep 19:00
MACD: bearish 17 Sep 07:00 → 18 Sep 03:00, bearish 26 Sep 03:00 → 26 Sep 23:00
OBV: bearish 17 Sep 07:00 → 18 Sep 03:00, bearish 26 Sep 03:00 → 26 Sep 23:00
MFI: bullish 23 Sep 19:00 → 25 Sep 23:00, bearish 26 Sep 03:00 → 26 Sep 23:00
How to interpret: a bullish divergence increases the likelihood of a rebound/continuation upwards; a bearish divergence increases the risk of a rotation/correction. Signals are more reliable when confirmed by a candlestick pattern + OBV/CMF.
What does this mean now
The momentum is strong: MACD↑, ADX>40, CMF>0, and the price is in a trending mode at Keltner-Upper.
Position relative to the profile: we are inside the VA and close to POC ~115k, which is an area of equilibrium; the market likes to test/balance around POC.
Risks of "hotness": RSI≈68 and MFI>80 indicate short-term overheating of money; without OI support, there may be откаты к средним значениям перед новым импульсом.
VWAP context: z(Price−VWAP) is low (≈0.36), and all aVWAP are lower, indicating that buyers are in control.
Key levels
Resistances: 114 826 (Donch-H20) → 115 113 (POC) → 115 624 (Donch-H55) → ~118k (inter-nodal zone) → 120 964 (VAH).
Supports: 114 202 (Keltner-Upper/Return boundary) → 114 096 (aVWAP 60D) → 112 377 (EMA20/Keltner-Mid) → 112 087 (Donch-Mid55) → 111 970 (Donch-Mid20) → 109 261 (VAL) → 109 114 / 108 550 (Donch L20/L55).
Scenarios and triggers (not the financial council)
A) Continuation of the upward trend is the basic trend.
Why is it the basic trend: convergence of momentum metrics (MACD+, ADX>40, CMF>0, aVWAP control), moderate z(Price−VWAP), and proximity to POC (often broken by the trend).
Trigger: 4h-close above 114,826 (Donch-H20) with buffer ≈ +0.1·ATR ≈ +93$ → > 114,920, with CMF>0 and OBV z50 ≥ 1.0.
Targets: 115 113 (POC) → 115 624 (H55) → ~118k → 120 964 (VAH) with normalization/growth of OI.
Invalidator: quick rollback and fixing below 114 202 (return to Keltner) and below aVWAP 60d 114 096.
B) Rotation to the averages / reload.
Trigger: 4h-closing below 114 202, RSI < 60 / MFI < 70, weakening of the MACD histogram, while OI↑ on the fall.
Targets: 112 377 (EMA20) → 112 087 / 111 970 (Donch Mid 55/20) → 109 261 (VAL) → 109 114 / 108 550 (L20/L55).
Cancel: return and hold above 114 826 with OBV recovery.
C) Quick short squeeze up.
If a set of shorts (OI↑) starts near POC and the price does not give back, a breakout > 114 920 with a fall in OI on a green candle ⇒ closing shorts and accelerating to 115.6k → 118k → 121k.
Tactics (example of logic)
Impulse long: after fixing > 114 920. Partial fixation at 115 113 and 115 624, then a trawl to the zone 118k → 121k. Stop under 114 202 (or under the retest level).
Reversal long (conservative): zones 112.4k–112.1k (EMA20 / Donch-Mid55) at signs of demand (CMF>0, candle reaction, OBV z50 turns up). Stop — below 111.9k, targets — 114.2k → 114.8k/115.1k.
Contra-trend short: only if 114.8k–115.6k is rejected + RSI/MFI reversal down and weak MACD histogram. Targets are 114.2k → 112.4k → 111.9k, stop at 115.7k.
In short: what to expect
The bullish trend is active, but the money is overheated (MFI>80), and the OI is below average.
If we consolidate above 114.9k, it is logical to break through to 115.1k → 115.6k → 118k, and with a good flow, to 121k (VAH zone).
If we return below 114.2k, a rotation/reboot to 112.4k–112.0k is likely; a deep scenario leads to VAL ~109.3k.
