Let Bitcoin make a new ATHHi traders,
My outlook on Bitcoin last week was wrong and I'm the first to admit it. I can't be 100% right. So we move on to the next possibility.
Last week Bitcoin went up very impulsive from out of nowhere due to fundamental news.
Now let price make a new ATH and wait for the (corrective or impulsive) move down to take a trade.
Let's see what the market does and react.
Trade idea: Let price make a new ATH and wait for the (corrective or impulsive) move down to take a trade bullish or bearish.
If you want to learn more about trading FVG's with wave analysis, please make sure to follow me.
This shared post is only my point of view on what could be the next move in this pair based on my analysis.
Don't be emotional, just trade your plan!
Eduwave
USDTBTC.P trade ideas

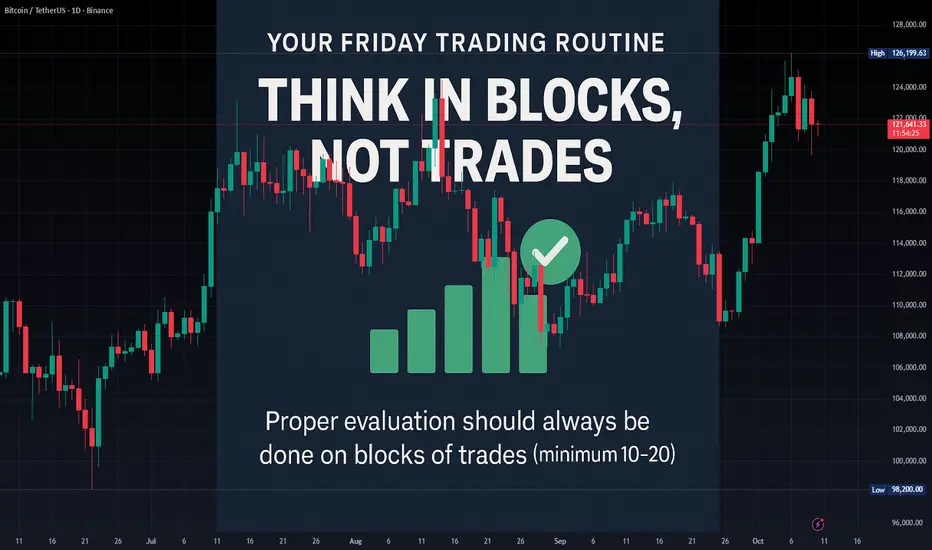
The Process Notebook #1 — The Successful Trader’s RoutineThe Successful Friday's Trader Routine: Evaluate but Think in Blocks, Not Trades
Another trading week is about to end. For most traders, Friday means checking wins and losses. For professional traders, it means evaluating the system.
💡 Remember: a single trade means nothing.
Proper evaluation, to avoid emotional bias caused by variance, should always be done on blocks of trades (minimum 10–20).
But here’s the real twist: If you’re judging your system only by Win Rate (WR) or Reward-to-Risk (RR)… you’re missing the real picture.
A robust trading system needs to be monitored through a small set of key metrics that reflect not just how much you earn, but how consistent and reliable your edge truly is.
Here’s the minimum you should be tracking 👇
📈 Return Metrics (How much your system makes)
Expectancy (average return per trade): quantifies the true profitability of your edge.
CAGR (Compound Annual Growth Rate): shows long-term compounding efficiency.
Payoff Ratio (avg win / avg loss): evaluates quality of your wins vs. losses.
📉 V olatility & Risk Metrics (How stable your system is)
Standard Deviation of Returns: measures the variability of your outcomes.
Max Drawdown: identifies the deepest pain your account can face.
Recovery Factor (Net Profit / Max DD): shows resilience and system efficiency.
⚙️ Consistency Metrics (How repeatable your process is)
Sharpe Ratio: return per unit of volatility — higher = more efficient risk use.
Win/Loss Streak Distribution: reveals your emotional endurance threshold.
Trade Frequency Stability: checks if your system behaves consistently over time.
🧠 Why this matters
When you evaluate your trading in blocks (using statistics, not emotions), you detach from the noise and connect with your system’s real performance.
You stop judging yourself trade by trade… and start thinking like a risk
manager.
How do you evaluate your system — by emotion or by metrics?
BTC new ATH, decision making levelsToday BTC achieved ATH 125,819k.
From the day start bounce from the support zone.
Today BTC went up around 2.6 % .
At the top ATH we have LQ + Res + VAH, at this point we are in Supply zone, but BTC not reacting much.
BTC going uptrend channel, that indicates possible uptrend even higher because there is more liquidation in po levels + Stocks +- 1% .
USA economics dont show weakness and BTC traders are still hyped about new highs.

BTC - Weekly Breakout!📈 BTC has already broken out of its correction phase and is holding strong above $118k.
As long as $118k holds, the next targets sit between $126k–$140k.
Only a drop below $114k would delay the bullish outlook.
Trend remains strongly bullish after the breakout.
⚠️ Disclaimer: Not financial advice. Manage risk properly.
All Strategies Are Good; If Managed Properly!
~Richard Nasr.

Bitcoin Fake Breakout and Potential Long SetupAfter the fake breakout at $120,836, Bitcoin is showing early signs of recovery. A risky long position can be considered if $121,692 breaks, with a stop loss just below $120,836.
If BTC falls back below $120,836, a short position can also be taken — but remember to take quick profits or move to breakeven, as this setup goes against the main bullish trend.
For the long setup, it’s reasonable to keep the position open and accept the stop-loss risk, since there’s strong upside potential if momentum confirms.
Also, if the RSI on the 1-hour chart breaks above 50, it would serve as a confirmation for the long trade.


Where is BTC heading In my previous analysis on #btc I predicted exactly what happened today on the market, and as things look #btc is heading to the $114,000 zone to mitigate all the imbalance left behind in the bullish move. Check my chart for more details on the position to enter the market.

Good moment for Buy BTCGood moment for Buy BTC. We have formed the up trend and now we are on the low level of this trend. It is good moment for try to buy BTC with good risk\reward ratio. The stop to the below local low. Will see...

Seller's waiting for liqudity trap #BitcoinHello traer's
here is your new analysis for bitcoin..
Watch carefully my chart and wait for Liqudity ..
Otherwise wait or Comment If you want to know about intraday move...

Bitcoin getting rejected at all time highBTC is preparing for another BOS; however, it seems that big players want to suppress the price. Momentum remains bullish, and so does the trend, but more importantly, the sentiment is still bullish. A bearish response that fails to produce a lower low is an opportunity to accumulate.
BTC/USDTCRYPTOCAP:BTC has been moving within an ascending channel since April last year. Support has consistently held stronger than resistance has rejected, showing clear strength. I believe we are about to invalidate this bearish structure and break above channel resistance. Bitcoin looks ready to enter all-time-high mode.

TradeCityPro | Bitcoin Daily Analysis #189👋 Welcome to TradeCity Pro!
Let’s move on to the Bitcoin analysis. Yesterday, after setting a new ATH, Bitcoin began its correction — let’s review the market together.
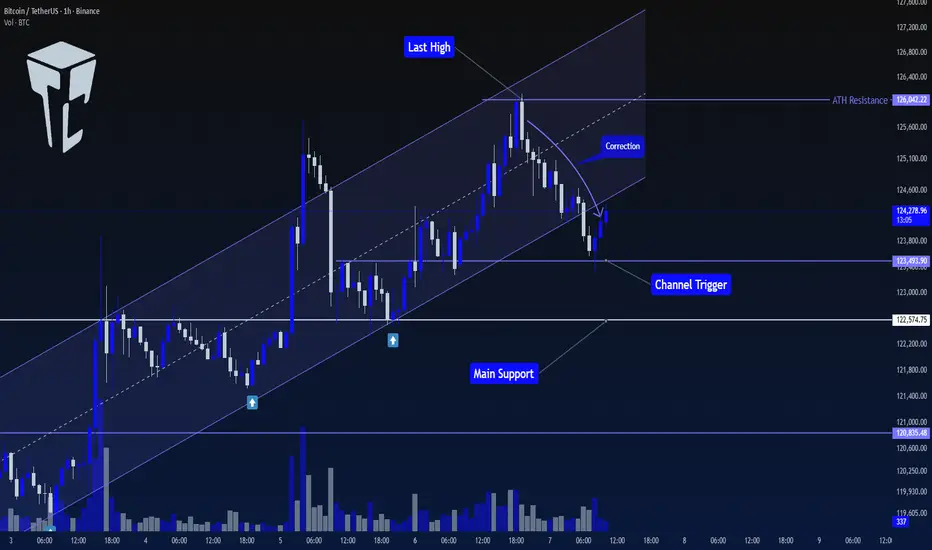
⏳ 1-Hour Timeframe
On the 1-hour timeframe, Bitcoin had been moving inside an ascending channel that had provided multiple supports. However, after being rejected from 126042, the price experienced a downward move and broke the channel to the downside.
⭐ The channel breakout trigger is at 123493, where the price has already reacted once, and it’s now moving slightly upward with very low volume.
📊 If this low-volume bullish movement continues, the likelihood of trigger activation will increase, and in that case, the price could move toward 122574.
🔍 For now, none of these triggers are suitable for short positions, as the market still looks too bullish to consider shorting.
✨ For long positions, the current trigger is 126042. However, if the market consolidates longer and forms a new structure, we might find an opportunity to enter earlier.
❌ Disclaimer ❌
Trading futures is highly risky and dangerous. If you're not an expert, these triggers may not be suitable for you. You should first learn risk and capital management. You can also use the educational content from this channel.
Finally, these triggers reflect my personal opinions on price action, and the market may move completely against this analysis. So, do your own research before opening any position.
TradeCityPro | Bitcoin Daily Analysis #190👋 Welcome to TradeCity Pro!
Let’s dive into today’s Bitcoin analysis. The market, after experiencing a decline, is now ready to resume its primary bullish trend.
⏳ 1-Hour Timeframe
Yesterday, after Bitcoin confirmed a break below the channel, it retested the channel and activated the trigger at 123493, leading to a brief bearish movement.
📊 The first support zone was 122574, but the price didn't react to it, resulting in a break below. The next key support zone was 120835, where the price reacted and formed a low.
✨ After the price found support at 120835, a peak formed at 122084, creating a compression between 120835 and 122084.
📈 Currently, after breaking above the compression range, a bullish movement has started, and the price has reached back above 123491.
⚡️ The good thing about the correction to 120835 is that many long positions that hadn’t taken profit were now closed, reducing selling pressure in the market. This provides Bitcoin a chance to continue its bullish trend with a more structured approach.
🚀 However, if the price fails to break the previous high of 126042, a lower high would form, which is a sign of weakness in the bullish trend.
🎲 If that happens, and if the price stabilizes below 120835, we’ll get confirmation of a bearish shift in this timeframe. But for now, this hasn’t happened, and the market momentum remains bullish.
🔍 For a new position, if you haven’t opened a position after breaking 122084, there is no valid trigger at the moment, and we should wait for the market to create a proper structure for entry. Otherwise, the only trigger we have right now is breaking 126042.
🔽 For a short position, I am waiting for the trend change scenario to unfold before considering any short triggers.
❌ Disclaimer ❌
Trading futures is highly risky and dangerous. If you're not an expert, these triggers may not be suitable for you. You should first learn risk and capital management. You can also use the educational content from this channel.
Finally, these triggers reflect my personal opinions on price action, and the market may move completely against this analysis. So, do your own research before opening any position.

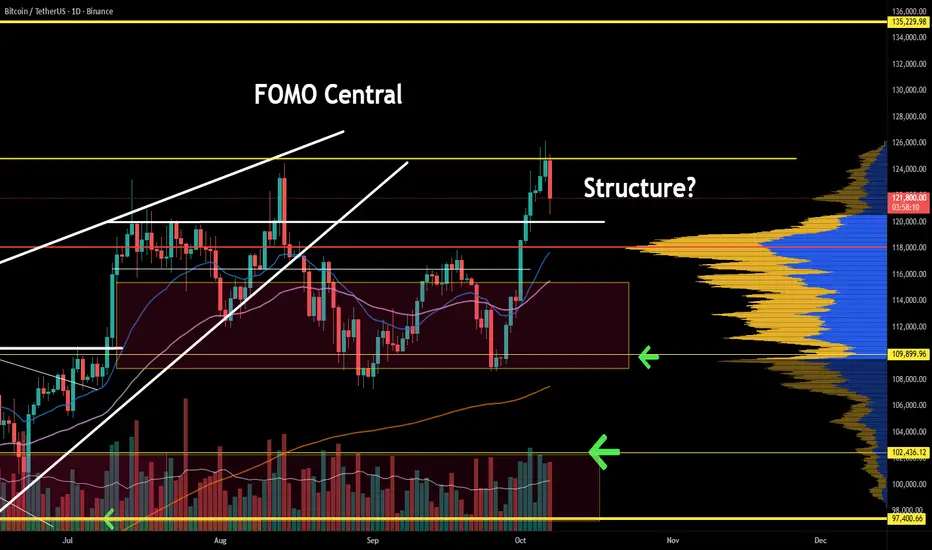
Bitcoin Holds Range Midpoint as Bulls Aim to Reclaim $123KBitcoin continues to consolidate around the key $123,000 level after briefly losing it on the 4-hour chart. Despite short-term weakness, structure still supports the probability of a bullish continuation toward $133,000.
Bitcoin’s recent price action reflects a measured correction following an impulsive advance earlier this month. The market briefly lost the $123,000 handle, registering a bearish engulfing candle on the 4-hour timeframe.
However, price remains positioned around the range midpoint — a structurally significant level that continues to attract bids. This area, which aligns with the lower boundary of the local value area, has historically served as a reliable demand zone that precedes expansion phases.
The consolidation near the midpoint highlights an ongoing equilibrium phase rather than a full-fledged trend reversal. Volume profile analysis shows that liquidity remains concentrated between $121,000 and $123,000, suggesting strong two-way participation.
Should bulls manage to reclaim the $123,000 region with acceptance on higher timeframes, it would confirm renewed momentum toward the channel high near $133,000.
From a structural perspective, Bitcoin continues to maintain its series of higher lows, keeping the broader bullish trend intact. The current correction could form a base of accumulation before the next impulsive move. As long as price does not close below $120,000, the overall bias remains constructive.
What to Expect:
If $123,000 is reclaimed with volume confirmation, a bullish expansion toward $133,000 remains highly probable. Failure to hold $120,000, however, could invite deeper liquidity sweeps before continuation.

BTCUSDTHello Traders! 👋
What are your thoughts on Bitcoin?
Bitcoin continues to move within a valid ascending channel. After a recent correction, price successfully broke above the descending trendline and reclaimed a key resistance area.
Currently, the previous high near the 120,000 level is acting as a resistance barrier. A short-term pullback toward the broken structure is expected. If this area holds as support, the price is likely to resume its upward move and attempt to break the previous high.
As long as the price holds above the support zone and the bottom of the ascending channel — and does not break below the previous low — this bullish scenario remains valid.
The medium-term outlook remains positive, and pullbacks may offer new buying opportunities.
What do you think? Will Bitcoin break above the previous high, or is a deeper correction ahead?
Don’t forget to like and share your thoughts in the comments! ❤️

BTCNEW UPDATE (1D)In the previous analysis, we considered Bitcoin’s scenario as a triangle, which has now failed.
It now appears that this is not a triangle but a diametric pattern. Currently, it seems we are in the middle of wave F. The potential corrections we expect are buying opportunities, and we will look to buy within the green box if a correction occurs.
The target for wave E could be between 138K and 140K.
A daily candle closing below the invalidation level will nullify this analysis.
invalidation level : $106418
For risk management, please don't forget stop loss and capital management
Comment if you have any questions
Thank You

Symmetry <Danger Zones>BTC follow Symmetry
just wait for entry signal
Price symmetry refers to comparing the size of past and current price movements to identify balance or repeating patterns.
It assumes that the market tends to make similar upward and downward moves in terms of price distance (such as wave length or correction size).
Analysts measure previous price swings and compare them with the current move to identify potential reversal or continuation points.

TradeCityPro | Bitcoin Daily Analysis #192👋 Welcome to TradeCity Pro!
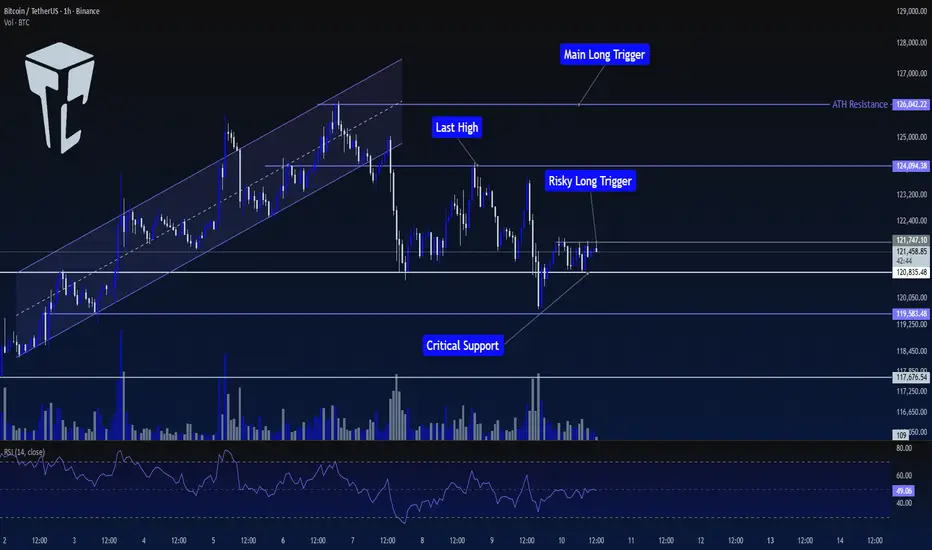
Let's dive into Bitcoin analysis. Today, Bitcoin is still in a consolidation and range-bound phase. Let’s take a look at the current market conditions.
⏳ 1-Hour Timeframe
In yesterday’s analysis, Bitcoin was in the process of breaking the $120,835 level. I mentioned that I wasn't opening any short positions yet, but a rejection of this downward movement could be a good sign for a potential upward move.
⭐ This scenario played out, and the price has now moved back above $120,835, which gives us an opportunity to look for long triggers.
✔️ One trigger that has formed is $121,747, which can be used as a risky trigger for a long position.
📊 Market volume has decreased slightly, so it’s better to wait for an increase in volume when this level is broken, as that would raise the likelihood of an upward move.
📈 The next reliable long triggers we have are $124,094 and $126,042. These triggers are more reliable for a position, but they are currently farther from the price, so the chance of them activating today is lower.
💥 For short positions, I'm still not focusing on them and prefer to focus on long positions. Therefore, I currently don’t have any short triggers to provide.
❌ Disclaimer ❌
Trading futures is highly risky and dangerous. If you're not an expert, these triggers may not be suitable for you. You should first learn risk and capital management. You can also use the educational content from this channel.
Finally, these triggers reflect my personal opinions on price action, and the market may move completely against this analysis. So, do your own research before opening any position.
BTCUSDTThe price has formed an "S" pattern and has once again declined to around $117,000. Therefore, the horizontal support level of $117,000, which the price has touched multiple times, is considered a significant level. The overall trend appears to be upward, with the price respecting an ascending channel (diagonal lines). The recent drop from the peak suggests a potential correction or profit-taking, with the price currently testing the support level. This indicates a volatile period that may lead to consolidation or a further decline if the support breaks, or a recovery if it holds.

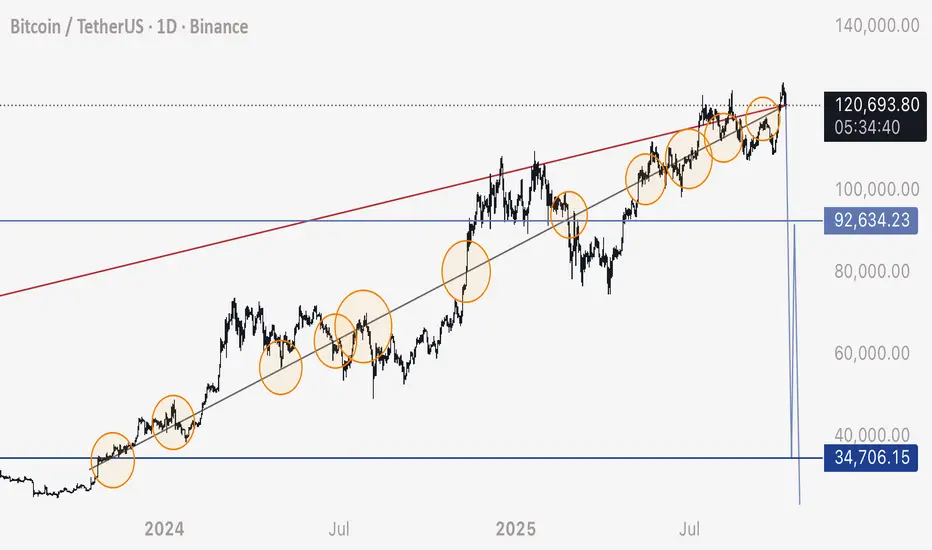
BTC - Explanation of My 35,000 Drop Prediction Here is a broken down explanation of why I’ve been predicting Bitcoin dropping to 35,000
1. We can see this diagonal ascending trendline and how price has been respecting it by looking at the various contact points circled in orange.
2. Bitcoin has been consolidating on either side of this trendline since the beginning of it.
3. Liquidity has been building and building in the form of sell orders / long stop losses all the way down as price has made no substantial recovery of these zones.
4. Eventually Bitcoin will stick it as resistance and as soon as those order blocks are hit, there is enough orders in place (stop losses and liquidations) to drop the price to 35,000 in a very short time period. Essentially, the limit orders are in place like a staircase all the way down, they will fill one after the next and the chart has all the fuel and propellant needed to make a wick to that level.
5. The only reason we would see price consolidate so truly to a bearish line like this is to attract buys and longs as it slowly moves up - this mechanic of the market makes it not only possible but highly likely to happen and we don’t need any sort of black swan or bad news. The orders are ready to set off.
6. This is way more likely than people seem to think. Every long opened has a stop loss order or liquidation order for the entire position size. We can CLEARLY see, just by looking at the chart, these wide open gaps on the chart are filled with these orders. They have been left intact PURPOSELY in order to design a natural, fast wick of a movement.
7. This wick will reclaim all of the market makers and liquidity providers liquidity to them, and de-leverage all open positions.
I truly believe this will happen exactly as I say it will.
- Drop to 35,000
- Very fast drop (2-12 hours for the whole movement - if not, 1 hour)
I’d encourage readers to at least be mindful of the rational behind this analysis and take proper precautions to protect yourselves.
Respectfully,
- DD
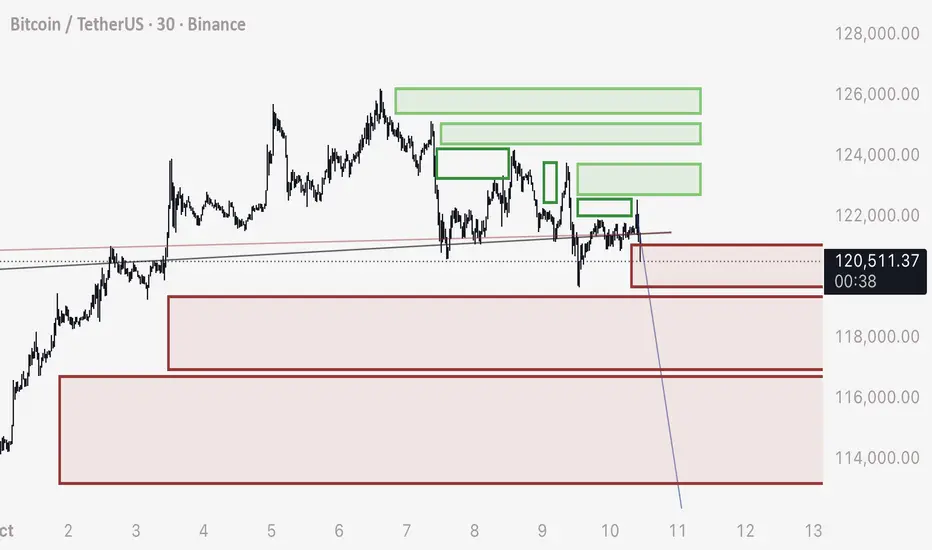
BTC - Use Order Blocks to Predict if Price with move UP OR DOWNI will give a practical demonstration here on how to draw your own order blocks and heat maps to predict if price will move up or down from this 121,400 current level.
First understand that stop loss order blocks are opposite to what we have learned as traders.
We are told that buy orders are below price (limit buys) and sell orders are above us (limit sells).
The truth of Bitcoin however is the exact opposite is true. The stop loss orders carry much more power than limit orders, as they are filled for the “whole leveraged position size”, not for only the margin used.
While limit buys will automatically fill if price is below that price, or limit sells will automatically fill if price is above that price - this is not true for stop loss orders or liquidation orders.
Stop Losses and Liquidations only FILL if price CROSSES the level.
This means we can use order blocks from open candle sets, extended out past price currently, to understand where these gaps of orders are located.
Green boxes for BUYS above price.
Red boxes for SELLS below price.
When price enters into these boxes zones, these orders will start filling - acting as a type of propellant that’s implanted in the chart from traders previous choices. This creates “wicks” and fast movements.
WILL PRICE GO UP OR DOWN FROM 21,400?
In this example from 121,400 I drew both long stops and sell stops.
The emptied green boxes have already been reclaimed. The filled in green boxes are left unreclaimed and contain these orders.
For price to go up, it would have to move past the previous wick, and enter into these zones - which have a significant gap in between them.
For price to DROP, we can look at the boxes of long stops or sell orders.
Note that these order blocks are neatly placed one after the next, with no significant gaps between them.
Therefor, there is much better odds of price dropping from 121,400 - entering into these sell order blocks, and naturally dropping as those orders are filled one into the other.
It would be a good day trade strategy to SHORT the 121,400 level, and expect the price to move down through these blocks.
It would be a bad day trade strategy to LONG the 121,400, as the orders are very few compared to the downside, therefor, lower odds.
This is really the only strategy you need to scalp trades on Bitcoin and predict where price is going.
If you find these helpful, please let me know below.
Yours truly,
- DD
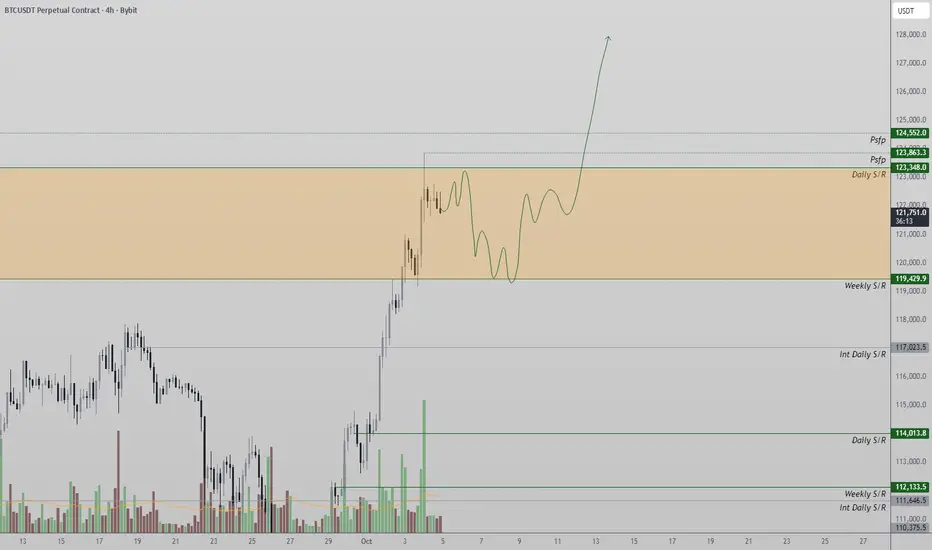
Bitcoin Targets $133,000 as Bulls Defend Channel SupportBitcoin continues to hold firm within its bullish trading channel, defending key support levels around $119,429. With structure intact, a push toward $123,348 and beyond to $133,000 remains on the table.
Bitcoin’s price action has been consolidating within a defined upward channel, maintaining a sequence of higher highs and higher lows that confirm the long-term bullish bias. After multiple successful retests of the channel support, the market has rebounded toward the midline, suggesting renewed bullish intent. Traders are now watching how price behaves between the current $119,429 support and $123,348 resistance to determine the next breakout direction.
Key Technical Points:
- Channel structure remains intact with higher highs and higher lows.
- Support: $119,429 | Resistance: $123,348 short-term, $133,000 channel high.
- A reclaim of $123,348 could trigger a rally into new all-time highs.
Main Analysis:
Bitcoin’s chart remains structurally sound, showing consistent respect for its trend channel. The most recent defense of support around $119,429 reflects renewed demand, with buyers stepping in each time price tests the lower boundaries of the range. This pattern has kept the uptrend intact and positioned BTC for another attempt to break through resistance.
The current focus is on the $123,348 resistance zone. A decisive reclaim above this level would likely lead to a strong impulsive move toward $133,000 — the next key resistance and potential new all-time high. The move would mark a continuation of the bullish market structure that has been developing since the last significant correction.
From a market sentiment perspective, open interest continues to climb, indicating that traders are adding positions alongside price increases. This alignment between rising open interest and bullish price structure signals that the rally is supported by real demand rather than short-term speculation.
However, traders should remain cautious of potential volatility near resistance zones, especially as Bitcoin approaches historical highs. Consolidation within this region would not be unusual, allowing the market to absorb liquidity before expansion.
What to Expect in the Coming Price Action:
Bitcoin remains bullish while trading within its channel. If $123,348 is reclaimed with volume, the next target lies at $133,000 — the channel high and potential new all-time high. If support at $119,429 fails, short-term retracement toward lower channel boundaries may occur before another attempt higher.
DeGRAM | BTCUSD seeks to reach the resistance line📊 Technical Analysis
● BTC/USD broke above key resistance at 122,000, confirming a strong bullish continuation. The breakout from the descending channel and the retest of the former resistance as support signal sustained buying interest.
● The next technical target lies near 126,700, with potential extension toward the 130,000 zone if momentum remains intact.
💡 Fundamental Analysis
● Optimism around Bitcoin ETF inflows and growing institutional accumulation continue to support bullish sentiment, while easing U.S. yields enhance risk appetite.
✨ Summary
● Momentum favors continuation above 122,000 toward 126,700–130,000. Pullbacks to the support zone could offer renewed buying opportunities.
-------------------
Share your opinion in the comments and support the idea with a like. Thanks for your support!
