BTC/USDT Technical Analysis, 2025-09-20 15:45 UTCBitcoin – Short-Term Technical Outlook
📊 Key Levels (Educational Purposes Only):
Potential Buy Zone: ~116,140 USDT
Resistance Levels: 117,500 → 118,232
Support Zones: 115,800 → 114,399
Indicators & Observations:
RSI: → oversold region.
MACD: Bullish crossover noted.
Stochastic: %K → possible reversal zone.
EMA200: Price testing long-term support.
Volume: +% above 20-period average.
ATR: 2.1% → high volatility conditions.
Order Book: Slight bid dominance (+2.8%).
OBV Trend: +3.2% → accumulation signal.
Candlestick Structure: Bullish Hammer + Engulfing observed.
Strategy Context (Not Financial Advice):
Price is testing EMA200 with oversold confirmations across multiple indicators. Volume spike may suggest accumulation, aligning with potential bullish reversal patterns.
⚠️ This analysis is for educational purposes only and not financial advice. Always do your own research and manage risk accordingly.
Trade ideas

BTC | 111k holds: tactical long bias, eyes on 113.1k__________________________________________________________________________________
Market Overview
__________________________________________________________________________________
BTC is consolidating above 111,040, trapped in a tight range with a higher‑timeframe bullish bias, while intraday remains pressured below 113,129. The 111k area acts as the market’s key pivot. 🔁
Momentum: Range with bullish tilt 📈 — higher TFs positive (1D/12H), intraday needs a reclaim above 113,129.
Key levels:
• Resistances (TF): 113,129–114,384 (240/1D, immediate ceiling), 117,900 (1D, upper cap).
• Supports (TF): 111,040 (240/1D, major pivot), 110,440 (intraday), 107,255 (1D).
Volumes: Normal on daily; moderate on 4H/30m downside pushes — no standalone catalyst.
Multi-timeframe signals: 1D/12H/6H bullish, 4H/2H/1H mixed-to-bearish below 113,129; a reclaim/hold > 113,129 opens 114,384.
Risk On / Risk Off Indicator: NEUTRAL BUY (stronger on 15m) — confirms the range‑bullish bias and favors buy‑the‑dip above 111k.
__________________________________________________________________________________
Trading Playbook
__________________________________________________________________________________
Strategic stance: higher‑timeframe uptrend, prefer tactical longs above 111,040. 🎯
Global bias: NEUTRAL BUY while 111,040 holds; key invalidation on a close below 111,040 (align TF to your horizon).
Opportunities:
• Defensive long: bullish reaction confirmed above 111,040; add on break/hold > 112,300 then > 113,129.
• Breakout long: close and hold > 113,129 (30m/15m ≥ 2 bars) to target 114,384.
• Tactical sell: clean rejection at 112.9k–113.1k with selling volume, target a pullback to 111,040 (reduced size vs HTF filter).
Risk zones / invalidations:
• A confirmed loss of 111,040 → increases risk toward 110,440 then 107,255.
• Reclaim & hold > 113,129 → negates intraday pressure and unlocks 114,384.
Macro catalysts:
• Fed: -25 bps cut with dovish guidance — medium‑term risk support, validates buy‑the‑dip.
• Dollar (DXY): bounce risk — near‑term headwind, argues for staged entries.
• ETF flows: recent modest inflows, neutral‑to‑slightly constructive — not a trigger but doesn’t cap the technical upside.
Action plan:
• Entry: 111,300–111,500 on re‑acceptance/HL confirmation (15m/30m); add if holding > 112,300 then > 113,129.
• Stop: 110,850 (below swing & S1).
• TP1: 112,950; TP2: 113,129–113,300; TP3: 114,300–114,400.
• R/R: ≈ 2.0–2.5x depending on execution and adds.
__________________________________________________________________________________
Multi-Timeframe Insights
__________________________________________________________________________________
Overall, higher timeframes lean bullish while lower timeframes remain pressured until 113,129 is reclaimed. 🧭
1D/12H/6H: Bullish bias while holding 111,040; clearing 113,129 then 114,384 would enable compression toward 117,900.
4H/2H/1H/30m/15m: Intraday pressure below 113,129, moderate volume on sell pushes; dip‑buys near 111,040 remain preferred as long as the pivot holds.
Key divergences: HTF Up vs LTF Down → favors “buy the dip” at support, confirmed by volume and reclaim of prior caps (112,300 → 113,129).
__________________________________________________________________________________
Macro & On-Chain Drivers
__________________________________________________________________________________
Macro backdrop is modestly supportive (dovish Fed), but a dollar bounce could cap near‑term rallies; ETF flows are constructive but not decisive. ⚖️
Macro events: Fed -25 bps and still‑dovish dot plot support risk; a technical DXY bounce remains a short‑term counterweight.
Bitcoin analysis: Defending ~111k near the 100D; gradual recovery toward the 50D plausible if 113,129/114,384 are reclaimed; institutional/ETF tone mildly positive.
On-chain data: Not provided — technicals and flows drive the lens.
Expected impact: Macro is broadly risk‑friendly, but execution should be paced under resistance; prefer staged entries above 111k.
__________________________________________________________________________________
Key Takeaways
__________________________________________________________________________________
BTC is ranging above 111,040 with a higher‑timeframe bullish bias and intraday headwinds below 113,129.
- Trend: bullish in HTF, neutral/paused intraday until 113,129 is reclaimed.
- Setup: buy the dip above 111,040, then add on breakout > 113,129 toward 114,384.
- Macro: Dovish Fed supports the case, while a firm DXY can slow upside.
Stay nimble: watch 111,040 defense and the 113,129 reclaim to trigger the next leg.

Bitcoin-100 000$Bitcoin: selling pressure increases, key support at $98,000–100,000
Market Overview:
Bitcoin failed to stay above 115,000 and is sliding lower. The long-term bullish impulse is fading, while sellers are gaining strength.
Technical Signals:
EMA 144 continues to cap upside moves.
Oscillators show growing bearish momentum.
Key support zone sits at $98,000–100,000.
Scenario:
The base scenario points to further downside into the $100,000 support area. A breakdown below this level could open the way to $92,000–94,000. Alternatively, a rebound above $118,000 would revive bullish sentiment.

BTC – Momentum Returns!Hello TradingView Family / Fellow Traders. This is Richard, also known as theSignalyst.
📈BTC has been overall bullish trading within the rising broadening wedge marked in red.
This week, BTC has been retesting the lower bound of the wedge.
Moreover, the orange zone is a strong structure and previous ATH.
🏹 Thus, the highlighted blue circle is a strong area to look for buy setups as it is the intersection of the lower red trendline and orange structure.
📚 As per my trading style:
As #BTC approaches the blue circle zone, I will be looking for trend-following bullish reversal setups (like a double bottom pattern, trendline break , and so on...)
📚 Always follow your trading plan regarding entry, risk management, and trade management.
Good luck!
All Strategies Are Good; If Managed Properly!
~Richard Nasr

Deep Learning Model for 24-Hour BTC Price PredictionHi everyone,
I’ve developed a deep learning AI model designed to predict BTC's price movement over the next 24 hours on the 15-minute timeframe.
It’s important to note that this model does not directly provide exact entry points for trades. Instead, it indicates the likely direction of the market, meaning you’ll still need basic trading knowledge to apply it effectively.
After testing it over the course of one month, I achieved a success rate of around 90% in my trades when using the model as part of my strategy.
The model was trained using the following features:
Time-related: Hour, DayOfWeek
Price & volume lags: Close_lag_1, Close_lag_2, Close_lag_4, Close_lag_8, Close_lag_12, Volume_lag_1, Volume_lag_2, Volume_lag_4, Volume_lag_8, Volume_lag_12
Moving averages & statistics: MA_4, Std_4, Dist_MA_4, MA_16, Std_16, Dist_MA_16, MA_48, Std_48, Dist_MA_48, MA_96, Std_96, Dist_MA_96
Technical indicators: Return_log, MACD, RSI
Hourly Forecast for the Next 24 Hours
2025-09-24 13:00:00+00:00 113187.886528
2025-09-24 14:00:00+00:00 113166.087645
2025-09-24 15:00:00+00:00 113073.892346
2025-09-24 16:00:00+00:00 112978.206348
2025-09-24 17:00:00+00:00 112883.998556
2025-09-24 18:00:00+00:00 112796.765538
2025-09-24 19:00:00+00:00 112723.646122
2025-09-24 20:00:00+00:00 112663.771152
2025-09-24 21:00:00+00:00 112613.883389
2025-09-24 22:00:00+00:00 112571.205400
2025-09-24 23:00:00+00:00 112533.084434
2025-09-25 00:00:00+00:00 112497.620988
2025-09-25 01:00:00+00:00 112464.608684
2025-09-25 02:00:00+00:00 112438.388997
2025-09-25 03:00:00+00:00 112409.348295
2025-09-25 04:00:00+00:00 112374.666791
2025-09-25 05:00:00+00:00 112334.960094
2025-09-25 06:00:00+00:00 112292.571287
2025-09-25 07:00:00+00:00 112248.481242
2025-09-25 08:00:00+00:00 112202.961260
2025-09-25 09:00:00+00:00 112156.047936
2025-09-25 10:00:00+00:00 112107.635662
2025-09-25 11:00:00+00:00 112057.822715
2025-09-25 12:00:00+00:00 112006.340060
2025-09-25 13:00:00+00:00 111953.576911

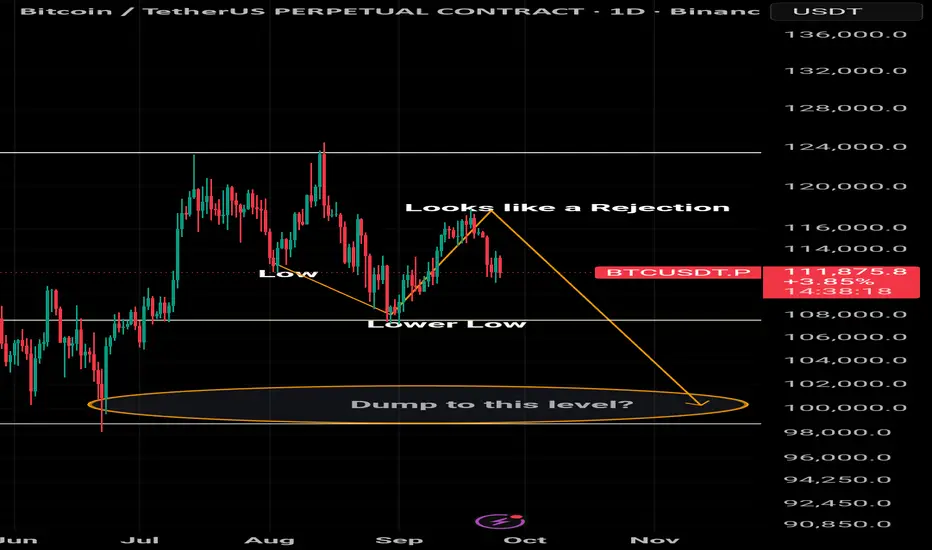
My View on BTC On the Daily chart we can clearly see a Low and Lower Low price movements, yesterday it seems we wanna recover from the dump but with the look of things (as at the time of this text) it's obviously turning to be a Rejection for continuous dump towards the structure level of 107593 hopefully we use that level to bounce back,if not then 98000 will be the next target.
BTC & Altcoin Market Update – Correction InsightsOver the past 48 hours, the crypto market has faced a significant pullback, with BTC retracing sharply and altcoins following suit. Let’s break down the drivers and what to watch next.
Key Reasons for the Dump
Massive Long Liquidations
More than $1.5B in leveraged long positions were wiped out, triggering cascading liquidations across exchanges. This accelerated the sell-off.
Overheated Leverage
Following the optimism around Fed rate cuts and broader risk-on sentiment, traders piled into high-leverage longs. This left the market vulnerable to sharp corrections.
Macro Uncertainty
Sticky inflation data and renewed interest rate expectations brought caution back to risk assets. This spilled over to crypto, pressuring sentiment.
BTC Dominance Rising
As BTC corrected, altcoins bled harder, reflecting capital rotation away from weaker projects. BTC dominance climbing highlights risk-off conditions in alts.
Technical Breakdown
BTC lost key short-term supports, accelerating selling pressure and triggering panic among retail participants.
Chart & Technical Outlook
BTC currently sits near the 111K–112K spot support zone, which aligns with a prior demand area.
RSI has cooled down from overbought levels, signaling a possible reset.
Altcoins remain under pressure, with many trading at or below critical daily supports.
A decisive reclaim of 115K on BTC could reignite bullish momentum, while a breakdown below 111K exposes 108K and below.
Takeaways
Corrections like these are part of a healthy market cycle, especially after extended rallies.
Leverage flushes often provide a reset for sustainable upside.
For now, caution is warranted until BTC confirms support holding.
DYOR | Not Financial Advice

BTC/USDT Outlook – Volatility Rises After Sharp DeclineBTC/USDT Market Report
Bitcoin recently faced heavy selling pressure, pushing the market into a sharp decline. This drop reflects a shift in sentiment where earlier stability has been replaced by increased volatility and downside momentum.
Price action shows signs of exhaustion after the fall, suggesting the possibility of a short-term rebound attempt. However, broader behavior still reflects uncertainty, with buyers needing stronger participation to shift momentum back in their favor.
If downward pressure continues, deeper corrections could emerge before any meaningful recovery. In the near term, traders should expect sharp swings as the market tries to stabilize.

BTCUSD NEW OUTLOOK According to H1 analysis BTCUSD market running in falling pressure from last couple of day now market now market reached at SUPPORT LEVEL so if you want then go buy from here is best for you be careful use money management
TRADE AT YOUR OWN RISK
REGARD ALBERT

The Bitcoin Long Trigger No One MentionsYo traders, Skeptic from Skeptic Lab! 🚀 Bitcoin’s in a wild phase—any move could drag us for weeks! In this video, I break down the buy squeeze candle that started it all, dive candle-by-candle into the market, and hunt for long/short triggers. We’ll also check Bitcoin dominance and altcoin vibes. From a V pattern to pivot 4 action, I’ve got you covered. no FOMO! Drop your coin picks in the comments, boost if it helped, and follow for more.

BTC Bearish in a Daily Technical AnalysisHeya, i'm sharing my insights on BINANCE:BTCUSDT.P
Based from this chart, BTC is showing a bearish divergence signaling a POTENTIAL move downwards.
Using Fibb tool, I have marked the potential supports once it does move downwards.
This idea is on a daily perspective.
Comment down your insight and let us all learn.

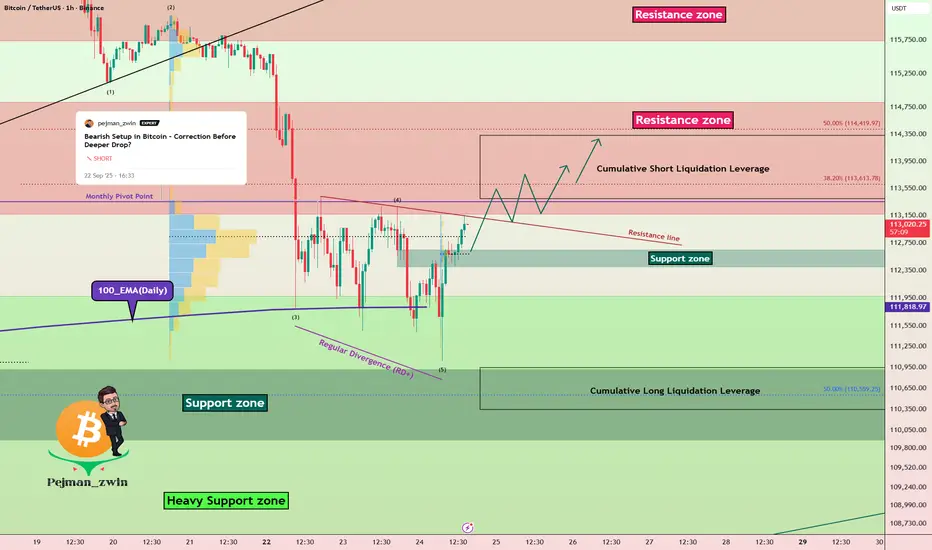
Bitcoin Outlook: From Support Bounce to Short Liquidation TargetBitcoin ( BINANCE:BTCUSDT ) moved as I expected in my previous idea ( Long and Short positions hit their targets ).
Bitcoin is currently moving near the Resistance zone($114,820-$113,170) , Resistance line, and the Monthly Pivot Point , and seems to have failed to break 100_EMA(Daily) .
In terms of Elliott Wave theory , Bitcoin completed wave 5 as I expected by attacking 100_EMA(Daily) and Heavy Support zone($112,000-$105,800) , and we can expect more bullish waves .
I expect Bitcoin to break the Resistance line in the coming hours and attack the Resistance zone ($114,820-$113,170) and the Cumulative Short Liquidation Leverage ($114,334-$113,400) .
Cumulative Long Liquidation Leverage: $110,950-$110,350
Note: If Bitcoin goes above $115,000, we should expect Bitcoin to rise again.
Please respect each other's ideas and express them politely if you agree or disagree.
Bitcoin Analysis (BTCUSDT), 1-hour time frame.
Be sure to follow the updated ideas.
Do not forget to put a Stop loss for your positions (For every position you want to open).
Please follow your strategy and updates; this is just my Idea, and I will gladly see your ideas in this post.
Please do not forget the ✅' like '✅ button 🙏😊 & Share it with your friends; thanks, and Trade safe.
BAD NEWS for Bitcoin :(. BE CAREFUL!My last Prediction was PERFECT . i know this will UPSET many bulls, but this is how the MARKETS WORK. After a strong uptrend and extreme greed environment, its time for Bitcoin to CORRECT and have strong PULLBACK. Look at the channel and trendlines, I expect bitcoin to reach a price of 100k/96k in the coming weeks. That will be a GOOD BUY opportunity. BE CAREFUL AND STAY WISE.
See My Previous PERFECT prediction:
BINANCE:BTCUSD COINBASE:BTCUSD CRYPTO:BTCUSD OKX:BTCUSD

BTC Shorts in playHello traders,
Explained my thesis within the video. Simply a high-probable set-up, regardless of the potential outcome. NFA
Kind regards.
CRYPTO:BTCUSD
CRYPTO:XRPUSD

Bitcoin Defends $111,816 Fibonacci Support as Bulls Target PoinBitcoin is holding above $111,816, a high-confluence support region that includes Fibonacci retracements and the value area low. Bulls must defend this level to maintain momentum toward higher resistance levels.
Bitcoin’s price action remains stable above a critical support at $111,816, reinforced by the 0.618 Fibonacci retracement, the value area low, and a recent swing low. This confluence makes the level a key battleground for bulls. Holding above it keeps the door open for a bullish rotation back into the point of control, which remains the ultimate resistance on the intraday timeframe.
Key Technical Points:
- $111,816 Support Zone: Anchored by Fibonacci, value area low, and swing low.
- Bullish Requirement: Price must remain above 0.618 Fibonacci for upside continuation.
- Resistance Target: Point of control serves as the immediate upside objective.
The $111,816 region has emerged as a critical inflection point for Bitcoin. With multiple technical layers converging here, buyers have a clear line in the sand to defend. Past reactions from similar confluences have led to sharp upside rotations, adding conviction to this setup.
Remaining above this level keeps the bullish trend intact on the intraday timeframe. The path toward the point of control becomes increasingly likely if volume inflows support the defense. However, slipping below $111,816 would expose Bitcoin to deeper corrective structures, weakening the bullish case in the short term.
The point of control remains the next major objective, representing the area of highest traded volume and strong resistance. Successfully reclaiming it would mark a significant bullish milestone in BTC’s market structure.
What to Expect in the Coming Price Action
As long as Bitcoin holds $111,816 support, the probability of a bullish rotation toward the point of control remains high. A breakdown below this zone would shift momentum back to sellers and signal caution.

The Digital Transformation of Global TradeIntroduction
Global trade has always been the backbone of economic growth and cultural exchange. From the Silk Road caravans of ancient times to the container ships and jet aircraft of the modern era, trade has continually evolved with technology. The 21st century, however, marks a revolutionary shift unlike any before. This shift is powered not just by physical innovations in transportation and logistics, but by digital transformation—the integration of digital technologies into every aspect of how goods, services, capital, and data move across borders.
Digital transformation is reshaping how companies interact with partners, regulators, and customers in global trade. Technologies like artificial intelligence (AI), blockchain, cloud computing, big data, Internet of Things (IoT), and 5G connectivity are no longer optional; they are fundamental drivers of efficiency, transparency, and competitiveness. At the same time, e-commerce platforms and digital trade finance tools are democratizing access, allowing even small businesses to participate in international commerce.
This transformation has created both opportunities and challenges. While efficiency, inclusivity, and sustainability are key benefits, the transition also brings risks like cybersecurity threats, regulatory mismatches, and digital inequality. Understanding this ongoing shift is crucial for businesses, policymakers, and individuals who wish to thrive in the future of global trade.
In this essay, we will explore the digital transformation of global trade in detail, examining its origins, technologies, impacts, and future directions.
Historical Context: Trade Before the Digital Era
Before diving into the digital wave, it’s important to understand how trade operated in the pre-digital age. Historically, global trade was characterized by several defining features:
Manual Processes: Paper-based documents like letters of credit, bills of lading, and customs forms were central to international transactions. These often took weeks to process.
High Transaction Costs: Cross-border transactions involved multiple intermediaries, from banks to freight forwarders, making trade expensive, especially for small businesses.
Limited Transparency: Once goods left a port, tracking their journey was extremely difficult. Miscommunication and disputes were common.
Access Gaps: Only large corporations with resources and networks could reliably engage in international trade. Small and medium enterprises (SMEs) often struggled.
Slow Communication: Fax machines, telex, and postal systems were the primary communication methods, creating delays and inefficiencies.
These limitations set the stage for digital disruption. The need for speed, reliability, and transparency was already present; digital technologies provided the tools to meet these demands.
Drivers of Digital Transformation in Trade
Several forces have accelerated the adoption of digital solutions in global trade:
Globalization and Competition: As trade expanded, firms sought ways to cut costs and improve efficiency to remain competitive.
E-Commerce Growth: Platforms like Amazon, Alibaba, and Shopify created a demand for fast, digital-first trade solutions.
Technological Advances: The rise of cloud computing, mobile devices, and AI made digital solutions accessible and affordable.
Consumer Expectations: Customers began to demand transparency in supply chains, faster delivery, and digital payments.
Regulatory Push: Governments and organizations like the World Trade Organization (WTO) have promoted digital trade facilitation initiatives.
Pandemic Impact: COVID-19 highlighted vulnerabilities in traditional supply chains and accelerated digital adoption globally.
Key Technologies Driving Transformation
1. Blockchain
Blockchain is revolutionizing trust in trade by creating tamper-proof digital ledgers. Bills of lading, customs documents, and financial settlements can be securely stored and shared, reducing fraud and errors. Companies like Maersk and IBM have pioneered blockchain-based shipping platforms that enable real-time visibility and reduce paperwork.
2. Artificial Intelligence (AI) and Machine Learning
AI optimizes trade flows by predicting demand, identifying risks, and automating routine processes. For instance, AI algorithms can analyze shipping routes to minimize delays or detect fraudulent trade documents. AI-driven chatbots also improve customer service in cross-border e-commerce.
3. Internet of Things (IoT)
IoT devices like GPS trackers and smart sensors provide real-time data on shipments. Containers can now report temperature, location, and even tampering, ensuring sensitive goods like pharmaceuticals or food remain safe.
4. Big Data and Analytics
Trade generates vast amounts of data, from shipping manifests to customs records. Big data analytics allows businesses to identify trends, optimize supply chains, and mitigate risks. For governments, data-driven insights help in improving customs efficiency and detecting illicit trade.
5. Cloud Computing
The cloud enables collaboration across borders. Platforms for digital trade documentation, payment gateways, and supply chain management systems are now hosted on cloud networks, accessible globally and scalable at low costs.
6. Digital Payments and FinTech
Cross-border payments have traditionally been slow and expensive. FinTech solutions like PayPal, Wise (formerly TransferWise), and blockchain-based payment systems are reducing transaction times and costs, enabling SMEs to trade globally.
7. 5G Connectivity
5G enhances real-time data transmission, enabling instantaneous updates in logistics and supporting technologies like autonomous shipping and drones.
8. Digital Platforms and Marketplaces
Marketplaces like Alibaba, Amazon Global, and eBay allow businesses, especially SMEs, to reach global customers instantly. These platforms integrate logistics, payments, and marketing, simplifying international trade.
Benefits of Digital Transformation in Global Trade
1. Efficiency and Cost Reduction
Digital technologies reduce paperwork, eliminate redundancies, and automate tasks, lowering trade costs significantly. The World Bank estimates that digital trade facilitation can cut costs by up to 14%.
2. Transparency and Trust
Blockchain, IoT, and data analytics improve visibility across supply chains. Businesses and consumers can verify product origins, ensuring ethical and sustainable sourcing.
3. Inclusivity for SMEs
Digital platforms lower entry barriers, enabling small businesses in developing countries to access global markets without massive infrastructure.
4. Faster Transactions
Digital payments and automated customs clearance reduce delays. What once took weeks can now be completed in hours or even minutes.
5. Risk Management
Data analytics and AI help companies anticipate risks such as geopolitical disruptions, weather conditions, or supplier failures.
6. Sustainability
Digital tools optimize transport routes, reduce fuel consumption, and support the circular economy by tracking product lifecycles.
Challenges of Digital Transformation
While the benefits are significant, challenges remain:
Digital Divide: Many developing countries lack the infrastructure or skills to participate fully in digital trade. This widens inequality.
Cybersecurity Risks: As trade becomes digital, it becomes a target for cyberattacks, data theft, and ransomware.
Regulatory Fragmentation: Different countries have different digital trade rules, creating friction. Harmonization is still a work in progress.
Privacy Concerns: The collection of massive data raises questions about consumer privacy and surveillance.
High Initial Costs: For smaller firms, the upfront investment in digital technologies can be prohibitive.
Resistance to Change: Some industries and stakeholders remain attached to traditional, paper-based systems.
Case Studies of Digital Transformation
1. Maersk and IBM’s TradeLens
TradeLens, a blockchain-based platform, digitizes shipping documentation, reducing delays and fraud. It demonstrated how collaboration among competitors could create industry-wide efficiency.
2. Alibaba’s E-Commerce Ecosystem
Alibaba enables millions of SMEs in China to access international markets, combining digital payments, logistics, and AI-driven insights in one ecosystem.
3. Singapore’s National Trade Platform
Singapore has developed a one-stop digital trade ecosystem integrating customs, logistics, and finance. It serves as a model for other nations.
4. Amazon’s Global Logistics Network
Amazon uses AI, IoT, and big data to optimize warehouses, shipping routes, and last-mile delivery, setting global standards for efficiency.
The Role of Governments and Institutions
Governments and international organizations are key enablers of digital trade. Their roles include:
Digital Infrastructure Investment: Building internet connectivity, 5G networks, and cloud systems.
Regulatory Harmonization: Working through organizations like WTO to create common standards for digital trade.
Cybersecurity Frameworks: Protecting businesses and consumers from digital threats.
Capacity Building: Supporting SMEs and developing nations with training and digital literacy programs.
Promoting Digital Inclusion: Ensuring marginalized groups can benefit from global trade opportunities.
Future of Digital Trade
The future of global trade is digital-first, with several trends shaping its trajectory:
Autonomous Logistics: Self-driving trucks, drones, and automated ports will further streamline trade flows.
Digital Trade Agreements: Nations are negotiating digital economy agreements focusing on data flows, digital payments, and e-commerce rules.
Sustainable Trade Practices: Digital tools will help track carbon footprints and ensure compliance with green trade policies.
Artificial Intelligence at Scale: AI will become central in trade compliance, risk assessment, and customer experience.
Metaverse and Virtual Trade Shows: Companies may engage in virtual trade fairs and immersive B2B interactions, reducing the need for physical presence.
Quantum Computing: Though still emerging, it promises to revolutionize logistics optimization and encryption in trade.
Conclusion
The digital transformation of global trade represents a turning point in economic history. Where once trade was slow, opaque, and exclusive, it is now becoming fast, transparent, and inclusive. Digital technologies are reshaping supply chains, reducing costs, and enabling even the smallest businesses to participate in the global economy.
However, this transformation is not without its challenges. The digital divide, cybersecurity risks, and regulatory fragmentation could hinder progress if not addressed collaboratively. Success in this new era requires partnerships between governments, businesses, and international organizations to ensure that digital trade remains fair, secure, and accessible to all.
Ultimately, the digital transformation of global trade is not just about efficiency; it’s about redefining the way nations, companies, and individuals connect. Just as the Silk Road once wove together distant civilizations, today’s digital highways are knitting together a truly interconnected world economy.
