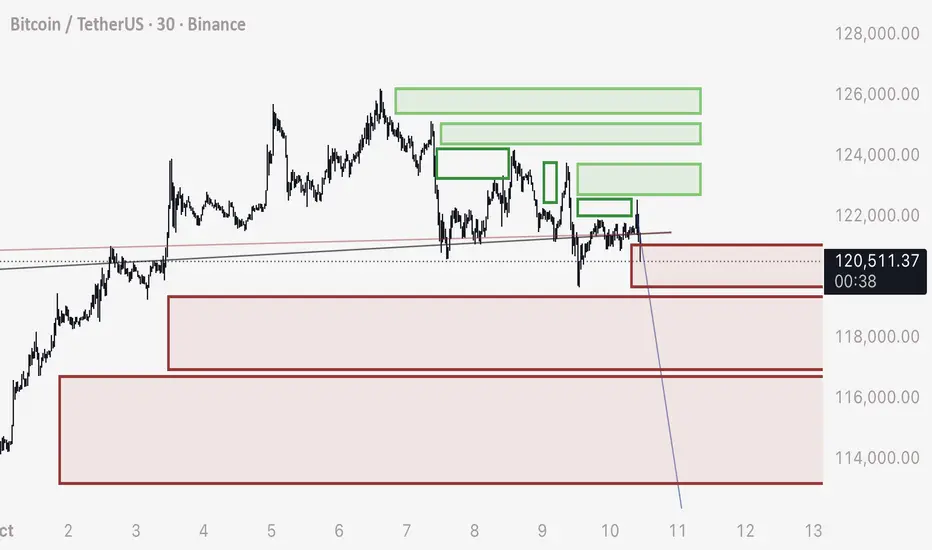
BTC - Use Order Blocks to Predict if Price with move UP OR DOWNI will give a practical demonstration here on how to draw your own order blocks and heat maps to predict if price will move up or down from this 121,400 current level.
First understand that stop loss order blocks are opposite to what we have learned as traders.
We are told that buy orders are below price (limit buys) and sell orders are above us (limit sells).
The truth of Bitcoin however is the exact opposite is true. The stop loss orders carry much more power than limit orders, as they are filled for the “whole leveraged position size”, not for only the margin used.
While limit buys will automatically fill if price is below that price, or limit sells will automatically fill if price is above that price - this is not true for stop loss orders or liquidation orders.
Stop Losses and Liquidations only FILL if price CROSSES the level.
This means we can use order blocks from open candle sets, extended out past price currently, to understand where these gaps of orders are located.
Green boxes for BUYS above price.
Red boxes for SELLS below price.
When price enters into these boxes zones, these orders will start filling - acting as a type of propellant that’s implanted in the chart from traders previous choices. This creates “wicks” and fast movements.
WILL PRICE GO UP OR DOWN FROM 21,400?
In this example from 121,400 I drew both long stops and sell stops.
The emptied green boxes have already been reclaimed. The filled in green boxes are left unreclaimed and contain these orders.
For price to go up, it would have to move past the previous wick, and enter into these zones - which have a significant gap in between them.
For price to DROP, we can look at the boxes of long stops or sell orders.
Note that these order blocks are neatly placed one after the next, with no significant gaps between them.
Therefor, there is much better odds of price dropping from 121,400 - entering into these sell order blocks, and naturally dropping as those orders are filled one into the other.
It would be a good day trade strategy to SHORT the 121,400 level, and expect the price to move down through these blocks.
It would be a bad day trade strategy to LONG the 121,400, as the orders are very few compared to the downside, therefor, lower odds.
This is really the only strategy you need to scalp trades on Bitcoin and predict where price is going.
If you find these helpful, please let me know below.
Yours truly,
- DD
USDTBTC.P trade ideas
Bitcoin will fill this wickEarlier or later this wick will get filled so take care with your positions

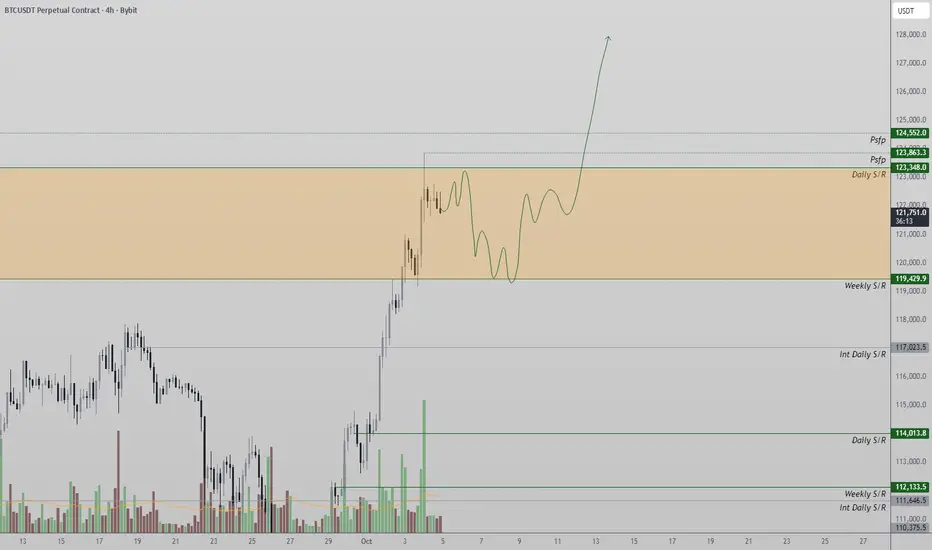
Bitcoin Targets $133,000 as Bulls Defend Channel SupportBitcoin continues to hold firm within its bullish trading channel, defending key support levels around $119,429. With structure intact, a push toward $123,348 and beyond to $133,000 remains on the table.
Bitcoin’s price action has been consolidating within a defined upward channel, maintaining a sequence of higher highs and higher lows that confirm the long-term bullish bias. After multiple successful retests of the channel support, the market has rebounded toward the midline, suggesting renewed bullish intent. Traders are now watching how price behaves between the current $119,429 support and $123,348 resistance to determine the next breakout direction.
Key Technical Points:
- Channel structure remains intact with higher highs and higher lows.
- Support: $119,429 | Resistance: $123,348 short-term, $133,000 channel high.
- A reclaim of $123,348 could trigger a rally into new all-time highs.
Main Analysis:
Bitcoin’s chart remains structurally sound, showing consistent respect for its trend channel. The most recent defense of support around $119,429 reflects renewed demand, with buyers stepping in each time price tests the lower boundaries of the range. This pattern has kept the uptrend intact and positioned BTC for another attempt to break through resistance.
The current focus is on the $123,348 resistance zone. A decisive reclaim above this level would likely lead to a strong impulsive move toward $133,000 — the next key resistance and potential new all-time high. The move would mark a continuation of the bullish market structure that has been developing since the last significant correction.
From a market sentiment perspective, open interest continues to climb, indicating that traders are adding positions alongside price increases. This alignment between rising open interest and bullish price structure signals that the rally is supported by real demand rather than short-term speculation.
However, traders should remain cautious of potential volatility near resistance zones, especially as Bitcoin approaches historical highs. Consolidation within this region would not be unusual, allowing the market to absorb liquidity before expansion.
What to Expect in the Coming Price Action:
Bitcoin remains bullish while trading within its channel. If $123,348 is reclaimed with volume, the next target lies at $133,000 — the channel high and potential new all-time high. If support at $119,429 fails, short-term retracement toward lower channel boundaries may occur before another attempt higher.
DeGRAM | BTCUSD seeks to reach the resistance line📊 Technical Analysis
● BTC/USD broke above key resistance at 122,000, confirming a strong bullish continuation. The breakout from the descending channel and the retest of the former resistance as support signal sustained buying interest.
● The next technical target lies near 126,700, with potential extension toward the 130,000 zone if momentum remains intact.
💡 Fundamental Analysis
● Optimism around Bitcoin ETF inflows and growing institutional accumulation continue to support bullish sentiment, while easing U.S. yields enhance risk appetite.
✨ Summary
● Momentum favors continuation above 122,000 toward 126,700–130,000. Pullbacks to the support zone could offer renewed buying opportunities.
-------------------
Share your opinion in the comments and support the idea with a like. Thanks for your support!

Bitcoin - KEY support is at 118kBitcoin - KEY support is at 118k
taht's a POC of a range + vwap from siwng low
that level should work as powerful support or trend woudl reverse
i`ll take LONG in a case of local CONFIRMATION

Bitcoin Holds Channel Midpoint as Bulls Target $133,000Bitcoin continues to trade within its high-timeframe range, defending the channel midpoint as price aims for $133,000 resistance. Consolidation here could precede the next major move higher.
Bitcoin’s structure remains intact within a long-standing ascending channel. The market is currently approaching local resistance from the smaller range, while maintaining price above the midpoint of the broader channel.
Key Technical Points:
- Price trading above the channel midpoint supports bullish continuation.
- Local resistance approaching near-term range highs.
- Next major target: $133,000 high-timeframe resistance.
Each swing within Bitcoin’s channel has defined clear pivots at both the highs and lows. The current setup shows price consolidating above the midpoint — a sign of sustained strength.
Short-term corrections within this area remain possible, but as long as Bitcoin holds above the midpoint, the probability favors continuation toward $133,000.
What to Expect in the Coming Price Action:
Bitcoin remains bullish above $119,000–$120,000. A reclaim of $123,000 resistance could accelerate momentum toward $133,000, marking the next test of channel highs.

BTC Continuation Going to risk some at range low as continuation setup of bullish order flow.
the Q, is : Are they will hit ATH before new week start?
if yes , money made.
if no, into the next.

BTC/USDTI think Bitcoin can't break this resistance and will fall from here. What do you think, buddy?

The good, the bad, and the ugly Seems like we are near to the top of the current bull market, judging by how it's looking now, there is a higher chance of a bearish movement than a bullish one. Not to panic sell everything, but it would probably be a good idea to start existing some of your positions. maybe keep 20-30% of your portfolio and git rid of the rest around the current price range

No one wants to sell BTC anymore?Bitcoin has reached a new ATH, and it’s time to take a look at the chart to see how strong this trend is and whether it can continue:
➡️ Money Flow shows a powerful liquidity spike, meaning the trend is supported by new money inflows. However, the indicator still shows a divergence that has persisted since November 2024. Every new ATH since then has been set with decreasing capital inflows into Bitcoin.
This means it’s not that everyone is rushing to buy Bitcoin with billions — it’s that no one wants to sell, and we’re getting closer to a supply shock. Bitcoin reserves on exchanges keep hitting new lows each month.
➡️ The Dynamic Supply and Demand indicator only confirms this theory — there’s simply no supply zone left. No one wants to sell. The price right now is battling only short traders on futures.
During the recent rise, the GAP I mentioned earlier — between $124,400 and $119,100 — was closed. So this rally was exactly what we expected!
⚡️ What’s next?
If the price manages to hold above the $123,000 support, the growth will likely continue toward the next target at $130,000.
If not, the first target becomes $120,000 — the nearest support and a minor psychological level. Also, during the rise, a GAP formed between $118,900 and $113,230. So if the price fails to hold at current levels, a retest of that area can also be expected.

#BTCUSDT 4H ChartPrice retraced after reaching a new ATH and left a minor supply at 124k. MACD is showing some bearish weakness, RSI is neutral and EMAs are bullish. We may see price tap into our minor supply before potentially retracing again.

BTC Pullback: Key Support at $99,800 – Next Move?#Bitcoin is currently experiencing a pullback, likely triggered by news, such as President Trump’s tariff announcement on China.
The price is hovering around $110,500, but it doesn’t look strong enough to hold at this level, so a move toward $99,800 is possible. The 0.5 Fibonacci retracement at $99,800 acts as a key demand zone. However, the RSI isn't oversold yet, which means there’s potential for further downside if this support breaks.
In my opinion, the best approach right now is to wait for some confirmation.
Stay tuned and follow for more updates, and if you're stuck in any coin, feel free to DM me I’ll do my best to help you out.
CRYPTOCAP:BTC BITSTAMP:BTCUSD BINANCE:BTCUSDT

BTC daily chartThis is my analysis for BTC,it is on the daily chart, no need to panic, this is a very healthy correction.

BTC Will Flash Crash to 35,000 / 8,000 - This is the Theory I’ve been seeing a lot of comments on my posts about this, discreting the idea, or claiming there’s no reasoning behind it. Here I will dive deeper into the WHY by presenting this on the weekly time frame.
In recent times, we have witnessed many times on a small scale what happens after we see a slow, downwards consolidation and price movement.
On the way days as shorts are accumulated, they leave a trail above the price that contains buy orders that don’t automatically fill if price is below. These buy orders are short stop loss orders and short liquidation orders.
As Bitcoin moves down, the price will then slowly begin to rise. Sooner or later, there is a high volume candle on the minute time frame pushing price up - into the series of short position buy orders.
What follows is a very fast upwards candle as these buy orders are filled and the shorts are stopped out, liquidated, and traders enter longs.
Think of this as a replacement of positions. The market makers use the traders own decisions, to get themselves into the positions they want to be in. They cannot make those choices, but they can manipulate and entice traders to make the wrong decision.
Market makers who allow traders liquidity to take leveraged positions, they want their money back and to an extreme lesser degree, don’t want you taking profit in a winning trade. Hence, we see these very fast moves occur, which were once known as “stop hunts”.
These stop hunt candles, extreme, fast price movements that liquidate and stop out trades by nature, can be understood by chart analysis.
If you read disclaimers for the heat map platforms (IE Coinglass), you’ll see that these are only predictions, and not based on real data. The only accurate way of understanding where these hidden orders are, is by chart analysis.
On my chart are red boxes. These red boxes are drawn from the upwards consolidation zones, where price never came down to reclaim the liquidity from. These zones are filled with long position sell orders that don’t automatically fill when price is above.
You can imagine a ladder of sell orders, one after the next, all the way down through the boxes.
Now you may think, how can Bitcoin lose all that value if we drop to 8,000 when there’s ETF’s, Strategy, Holders, etc?
The answer is - the majority of Bitcoins market cap, including companies like Strategy who leverage, is all liquidity used for leveraging and trading derivatives.
It is liquidity supplied by market makers and exchanges, and has no bias towards price going up or down. It’s liquidity that’s fluid, moves in and out, and while you may think that bitcoin would “lose” all the value if it drops to 8,000 momentarily - you must think of it another way.
Bitcoin is a balloon of dollars. The dollars doesn’t affect the function of what Bitcoin does. People from all over use their money to inflate that balloon, and a liquidation event such as a stop loss, then deflates that balloon and transfers the wealth into very few pockets.
The balloon is then quickly re-inflated by the liquidity that’s first deflated, and becomes inflated again by the long orders placed and the shorts stopped out or liquidated.
It’s highly likely the “floor price” of bitcoin is $8,000 - the amount of bitcoin held in stable sources divided by the dispersed amount of bitcoin on the market.
The rest is leveraging liquidity, that is simply a function of inflating and deflating, moving in and out and accommodating orders of both directions - or in other words, the “ gambling industry” within Bitcoin.
Now, TECHNICALLY SPEAKING
We have 2 key trendlines to show.
The first is an ascending channel, that starts at the 8,000 zone. Price consolidated around it all throughout the chart.
Duplicating this trendline we can find a channel, and I show that as the lower red ascending line. This is the main support and resistance we have to understand.
The second trendline is shown in grey. This is again a bearish trend that Bitcoin has been consolidating around since its bottom.
This trendline breakdown takes Bitcoin to 35,000.
If price drops from current level to 35,000 - we can measure the downwards movement, place that measurement from 8,000 - and see that we would form a bear pennant type pattern, rise back up to the RETEST OF THE BOTTOM RED CHANNEL LINE, and then fulfill the measurement of the downwards move all the way to 8,000.
Technically speaking, we can use pattern prediction and support resistance levels to serve as confluence for the liquidity levels and the mechanics of this drop.
So there we have the MECHANICS and TECHNICALS
Additionally about the mechanics or the HOW… the more times Bitcoin doesn’t drop down, moves up - the more of those sell orders are accumulated.
The more TIME Bitcoin spends doing this, and the more AMOUNT of times Bitcoin wicks up like this - this means the FASTER and MORE POWERFUL the drop will be as a consequence.
This is very simply because of the amount of sell orders accumulated in the chart. The more sell orders there are, and the greater the quantity of Bitcoin ordered to be sold, the faster price will drop down.
So in theory, these drops will be the fastest movements we’ve ever seen in bitcoins history.
It’s quite literally a chart filled with rocket fuel and propellant, and all it takes is a fuse to be lit.
Thank you

Bitcoin Faces $120K Resistance – Bull Trap or Breakout?Bitcoin ( BINANCE:BTCUSDT ) continued its uptrend of the last 2-3 days as I expected in my previous idea . Today, the announcement of the ADP Non-Farm Employment Change index worked like a catalyst for Bitcoin .
Bitcoin is currently surrounded by Resistance zones and a Potential Reversal Zone (PRZ) , and is near the important price of $118,400(Volumetric importance) and the $120,000(Round Number) .
From the perspective of Elliott Wave theory , it seems that Bitcoin could be in corrective waves and that the increase of the last few days could only serve as a Bull Trap .
I expect Bitcoin to decline at least to the Support lines .
Cumulative Long Liquidation Leverage: $113,590-$111,900
Cumulative Long Liquidation Leverage: $115,823-$115,087
Cumulative Short Liquidation Leverage: $120,000-$118,000
Note: If Bitcoin falls below the Support zone($114,820-$113,180), we should expect further declines.
CME Gap: $111,355-$109,915
Stop Loss(SL): $120,103
Please respect each other's ideas and express them politely if you agree or disagree.
Bitcoin Analysis (BTCUSDT), 1-hour time frame.
Be sure to follow the updated ideas.
Do not forget to put a Stop loss for your positions (For every position you want to open).
Please follow your strategy and updates; this is just my Idea, and I will gladly see your ideas in this post.
Please do not forget the ✅' like '✅ button 🙏😊 & Share it with your friends; thanks, and Trade safe.

Bitcoin Breaks $123K Resistance as Bulls Target $133K Bitcoin has reclaimed the critical $123,000 resistance level, confirming renewed acceptance in its upper trading channel. This breakout paves the way for a possible rotation toward the $133,000 macro target.
Bitcoin continues to lead broader market sentiment, acting as the benchmark for overall bullish momentum. Following weeks of range consolidation, the decisive move above $123K signals strength and increasing demand among market participants.
Key Technical Points
- Breakout Level: $123,000 reclaimed on daily close, confirming channel acceptance.
- Target Objective: $133,000 represents the next structural resistance zone.
- Market Context: Rising open interest and healthy funding rates support sustainable momentum.
The $123,000 level was previously a high-timeframe resistance acting as a ceiling for several weeks. The recent bullish breakout now flips this level into support, signaling the start of a potential expansion phase within Bitcoin’s larger ascending channel.
Market participation metrics confirm the breakout’s legitimacy. Both open interest and spot volume have increased in tandem, showing that the move is supported by genuine buying activity rather than short-term speculation. On the daily timeframe, consecutive bullish closes above $123K reinforce structural strength, while the channel high near $133K remains the next logical technical magnet.
Additionally, Bitcoin’s dominance has stabilized, suggesting that capital rotation may follow toward major altcoins once BTC reaches its upper target region.
What to Expect in the Coming Price Action
As long as Bitcoin holds above $123K, the next technical rotation toward $133K remains the most probable scenario. Sustained bullish structure and volume support could open the path for another all-time-high challenge in the medium term.

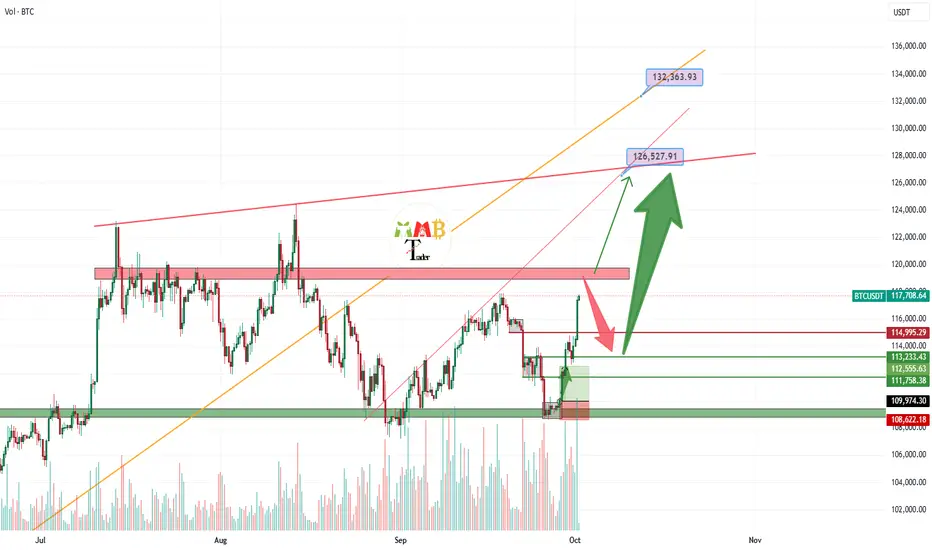
Bitcoin market is again bullish and target is 130K$ if 113K holdThe chart is easy to read the major resistance zone now is ahead and that is 119K$ resistance zone and price can rest there like previous time and we may have short-term fall near that resistance once again but if this time 113K$ to 115K$ hold strong as support then boom next phase pump will pump the price like green arrow to our target which is above 130K$.
also we may have breakout to the upside here without retesting 113K$ and then again we are looking for targets like 126K$ and more because as you can see market and bulls are getting strong once again.
DISCLAIMER: ((trade based on your own decision))
<<press like👍 if you enjoy💚
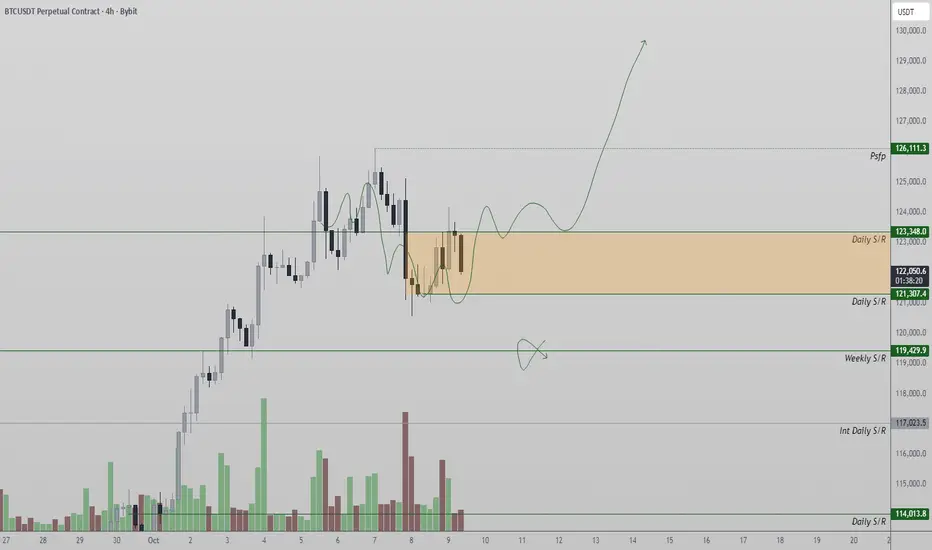
Bitcoin Holds Key Range Levels as Bulls Eye ContinuationBitcoin continues to trade between two key levels at $123,348 and $121,307, with a breakout or breakdown likely to dictate the next major move.
Price action remains tightly range-bound between these zones after multiple rejections and retests. A reclaim of $123,348 would signal continuation toward new highs, while a drop below $121,307 could invite a deeper corrective phase.
The $119,000 level serves as a crucial support where liquidity is building, aligning with prior demand zones. Structurally, Bitcoin’s broader trend remains bullish, and the ongoing pullback appears corrective rather than a reversal. As long as price holds above the $119,000 region, buyers maintain control of the trend.
What to Expect:
Sustained strength above the $121,000 level would support an eventual push toward new highs, while losing it could extend the correction before another bullish rotation forms.

BTC WILL NOT BE THERE🪙 CRYPTOCAP:BTC October 10th 😅 Straddle breakevens:
118000 & 127000
🪙 CRYPTOCAP:BTC October 17th 😅 Straddle breakevens:
116000 & 130000
σ Sigma probabilities:
October 10th
| σ | Multiplier × 😅 | Probability
| 1σ | 117000 & 128000 | ≈68%
| 2σ | 112000 & 133000 | ≈95%
October 17th
| σ | Multiplier × 😅 | Probability
| 1σ | 114000 & 131000 | ≈68%
| 2σ | 106000 & 139000 | ≈95%

BTCUSD | Daily Structure Analysis
Overview :
After breaking the last daily resistance and completing a correction on the weekly timeframe, Bitcoin is now trading below the 124,000 level.
If the price manages to break above 124,500, it could continue its bullish wave toward 127,500, and later 132,700, completing the upward structure.
📈 Resistance Levels:
🔺 124,500 — Key Level
🔺 127,500
🔺 132,500
📉 Support Levels:
🟩 117,700
🟩 114,500
🟩 107,300 — Key Level
🧠 Analytical Note:
A breakout and retest (pullback) of any key level could define the next directional move — whether bullish or bearish.
Currently, the market is testing a strong resistance area, and the reaction here will likely determine next week’s direction.
💬 What’s your outlook on Bitcoin?
Do you think BTC needs a short-term correction before continuing higher?
مرور کلی:
قیمت بیت کوین پس از شکست آخرین مقاومت در تایم فریم روزانه و تکمیل اصلاح در تایم فریم هفتگی، اکنون زیر سقف 124,000 دلار قرار دارد.
در صورتی که قیمت بتواند مقاومت 124,500 را با قدرت بشکند، احتمال حرکت صعودی تا نواحی 127,500 و سپس 132,700 وجود دارد و میتواند موج صعودی فعلی خود را تکمیل کند.
📈 نواحی مقاومت (Resistance Levels):
🔻 124,500 — Key Level
🔻 127,500
🔻 132,500
📉 نواحی حمایت (Support Levels):
🔰 117,700
🔰 114,500
🔰 107,300 — Key Level
🧠 نکته تحلیلی:
شکست هر یک از نواحی کلیدی و بازگشت (پولبک) به آن ها میتواند مسیر حرکت بعدی بازار را مشخص کند؛ چه در جهت صعودی و چه نزولی.
در حال حاضر بازار زیر ناحیهی مقاومتی کلیدی قرار دارد و واکنش قیمت به این سطح میتواند جهت هفته ی آینده را تعیین کند.
💬 نظر شما چیست؟
به نظر شما بیتکوین پیش از ادامه ی حرکت، نیاز به یک استراحت کوتاه ندارد؟

BTC - Short Trade Update All is going to plan here. A good DCA entry for the short would be 116,800 zone
Expecting a drop straight to 35,000 from here.
This will definitely happen. At the risk of sounding insane, I have zero doubts about it.
Good luck to everyone.
- DD

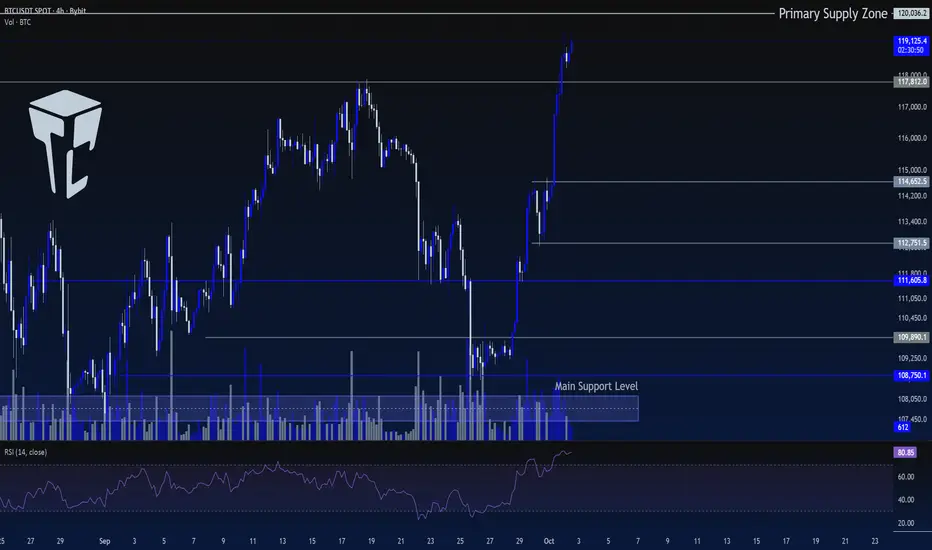
TradeCityPro | Bitcoin Daily Analysis #186👋 Welcome to TradeCity Pro!
Let’s move on to Bitcoin analysis. Bitcoin is still pushing upward, so let’s review the market conditions together.
⌛️ 4-Hour Timeframe
Yesterday, Bitcoin reached the next resistance level at 117,812.
🔍 On the lower timeframes, there was a small rejection from this zone, but on the 4-hour chart, price managed to hold above it and is now moving toward the 120,036 level.
🔔 Given the strong buying power and the heavy volume in the market, I believe the probability of continuation to the upside is very high, and price could push to even higher zones.
💥However, the RSI oscillator is currently deep in the overbought zone, sitting around 80. That’s quite an extreme level, and a correction in RSI is almost certain soon.
✔️ This doesn’t necessarily mean the uptrend is over. Price can still continue upward while RSI corrects.
⚡️ As long as RSI remains above 70 and stays in overbought territory, I expect the bullish leg to continue. Once RSI stabilizes below 70, price may enter a corrective phase.
⭐ In that case, we can look for long triggers during the price correction to catch the next bullish wave.
📊 If Bitcoin keeps rallying, the next zone to watch as a potential trigger will be 120,036. A reaction at this level could give us a new long setup.
💫 That said, on the first touch of 120,036, I personally won’t be opening a position—even if it breaks. I’ll wait for more structure to form before making an entry.
❌ Disclaimer ❌
Trading futures is highly risky and dangerous. If you're not an expert, these triggers may not be suitable for you. You should first learn risk and capital management. You can also use the educational content from this channel.
Finally, these triggers reflect my personal opinions on price action, and the market may move completely against this analysis. So, do your own research before opening any position.