Wait for 118k , then buy again (130k incoming )In my previous idea , when BTC was 113k , i published an Idea that BTC will hit 130k and people told me you are wrong . Now im telling you wait for 118k (wave 4) then buy again.
Analyzing Elliott's wave theory telling us that btc need some corrections and this is why price is started to fall.
USDTBTC.P trade ideas

Bitcoin btc 4h
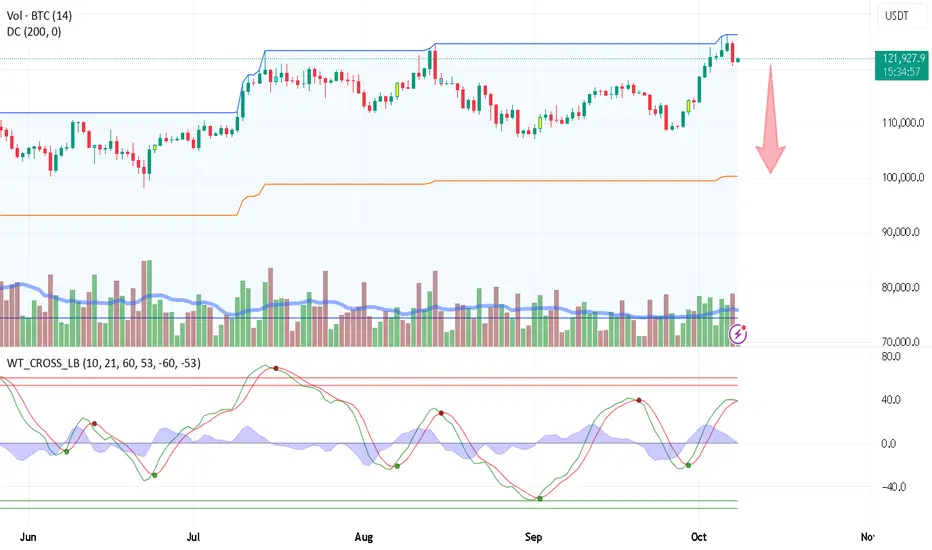
The main target of the analysis is a decline to the $98,000 zone.
If price takes the opposite path and closes above $126,500 on the 4-hour chart, the bearish analysis is invalidated and price is expected to rise toward the $141,700–$142,000 zone.

BTC market snapshotWe’ve reached a new high, and there’s still some room to grow — maybe up to 130K — but I’m maintaining a bearish bias and skipping long entries.
😱 Monthly timeframe divergence is getting stronger, signaling that the overall momentum is fading and the market is overheated.
😱 A rising wedge has formed — a classic trend reversal pattern.
😱 Recent data shows that smart money is selling while retail is buying (judging by gold charts, big players seem to be positioning there in anticipation of a dump).
😱 Social media sentiment is overheated, full of euphoria and belief in endless growth.
😱 The real chaos in the U.S. hasn’t even started yet — the economy is in trouble.
😱 There’s a strong imbalance in open interest.

#BTC/USDT Let Bitcoin make a new ATH#BTC
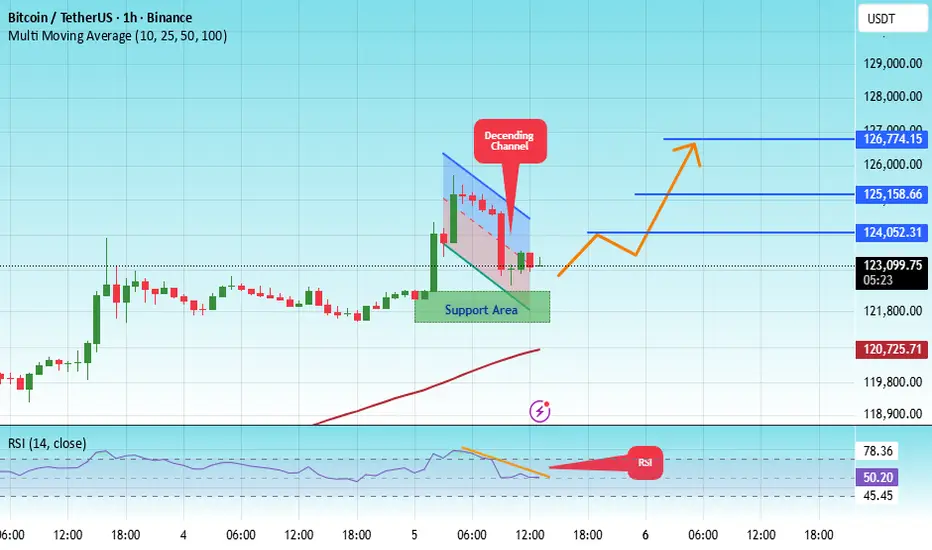
The price is moving within a descending channel on the 1-hour frame, adhering well to it, and is heading for a strong breakout and retest.
We have a bearish trend on the RSI indicator that is about to be broken and retested, which supports the upward move.
There is a major support area in green at 121900, which represents a strong support point.
We are heading for consolidation above the 100 moving average.
Entry price: 123300.
First target: 124050.
Second target: 125160.
Third target: 126774.
Don't forget a simple matter: capital management.
When you reach the first target, save some money and then change your stop-loss order to an entry order.
For inquiries, please leave a comment.
Thank you.
Long BTC at 121,300Pullback to 117,500 could be cut short with a bounce off the 50EMA on the 30mins
Long Entry - 121,300
SL - 120,000
TP - 145,000

Is the #BTC rally over? Can 120k hold?📊 Is the #BTC rally over? Can 120k hold?
🧠From a structural perspective, we've established a bearish structure after hitting a new all-time high. This structure targets 118,500-120,377. The neckline support zone is also nearby, so consider monitoring the support strength here to identify potential long trades.
➡️After the uptrend support line was broken, we're currently testing the yellow support zone. Therefore, shorting here is not recommended. Instead, consider looking for long positions in anticipation of a rebound.
🤜If you like my analysis, please like 💖 and share 💬
BITGET:BTCUSDT.P

Bitcoin (BTC): Bounced From Bollinger Bands | Back at ATHBTC has had a good bounce from the middle line of the Bollinger Bands since the last time we looked at it on the weekly timeframe, and the price is now back at the current ATH zone.
Price action movement is pretty good and so far everything goes by the plan. Now we need to see the break of the ATH zone, which then would result in a movement into a new ATH.
Swallow Academy

#BTCUSDT Let Bitcoin make a new ATH#BTC
The price is moving in a descending channel on the 1-hour frame and is expected to break and continue upward.
We have a trend to stabilize above the 100 moving average once again.
We have a downtrend on the RSI indicator that supports the upward move with a breakout.
We have a major support area in green that pushed the price higher at 121,500.
Entry price: 122,200.
First target: 122,800.
Second target: 123,400.
Third target: 124,200.
To manage risk, don't forget stop loss and capital management.
When you reach the first target, save some profits and then change your stop order to an entry order.
For inquiries, please comment.
Thank you.

BTC market snapshotBTC has reached a new high, clearing out short positions, but it’s still within the wedge pattern (a technical trend-reversal formation). Volumes indicate a weakening of momentum and the approach of a potential correction

BTC 1H Analysis - Key Triggers Ahead | Day 53☃️ Welcome to the cryptos winter , I hope you’ve started your day well.
❤️ I sincerely apologize to everyone in the channel — I’ve been down with a cold for several days. Now, let’s dive into the 1-hour Bitcoin analysis.
⏰ We’re analyzing BTC on the 1-Hour timeframe .
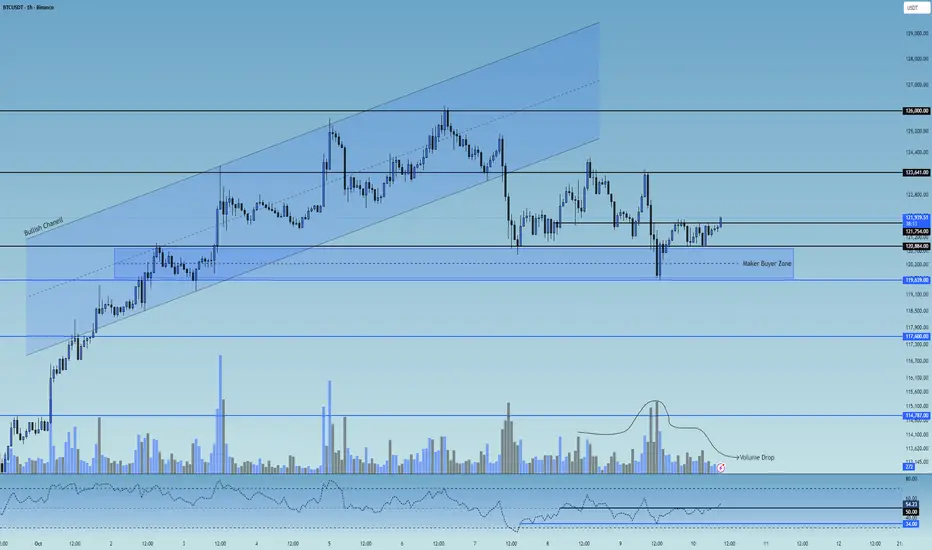
👀 In the 1-hour timeframe, after a strong bullish rally, Bitcoin broke below its ascending channel and moved toward the $121,000 support zone. From there, increased buying volume pushed the price upward, but it got rejected from the $123,600 resistance** and pulled back, creating a long trigger at that zone.
As it moved toward lower support levels, it formed a micro buyer zone between $119,640 and $120,884, where each time price enters this zone, Bitcoin experiences noticeable buying pressure.
🧮 Looking at the RSI oscillator, after ranging below the 50 level, it’s now trying to break above it. The 50 level has become a **strong static resistance, while there’s swing support near 34.
If the RSI breaks out of these marked zones, it could trigger stronger volatility and expand both **short and long trading opportunities.
🕯 The size and volume of recent candles on the 1-hour chart show range-bound movement, weak momentum, and market indecision, forming a **multi-timeframe trading range** where the top and bottom boundaries act as trigger zones.
The **micro buyer zone is where buyers aggressively defend price through market orders, preventing further downside — a reversal candle forming inside this zone is a strong example of that.
▶️ **Today’s economic news related to U.S. monetary policy can impact the market significantly. Since Bitcoin is currently in a small trading range, upcoming volatility spikes from the news could provide short-term setups.
↗️ Risky Long Scenario:
Look for a breakout above the marked $121,754 zone, accompanied by an engulfing candle, **indecision signal, SMA-7 confirmation, and increasing volume in the direction of the breakout — especially if the news comes out risk-on (positive for markets).
📉 Very Risky Short Scenario:
If price breaks below the micro buyer zone and loses the swing RSI support near 33, Bitcoin could enter a deeper correction.
However, note that a drop in Bitcoin’s price often increases its attractiveness compared to other assets, so avoid rushing into shorts.
❤️ Disclaimer : This analysis is purely based on my personal opinion and I only trade if the stated triggers are activated .
BTC market snapshotIn a few hours, there will be a pre-recorded speech by Jerome Powell, which means some people already know what he’s going to say.
There could be volatility since expectations are high. His speech won’t directly announce the interest rate decision, but even a hint will be enough to trigger panic in the current situation.
I’m holding a short.

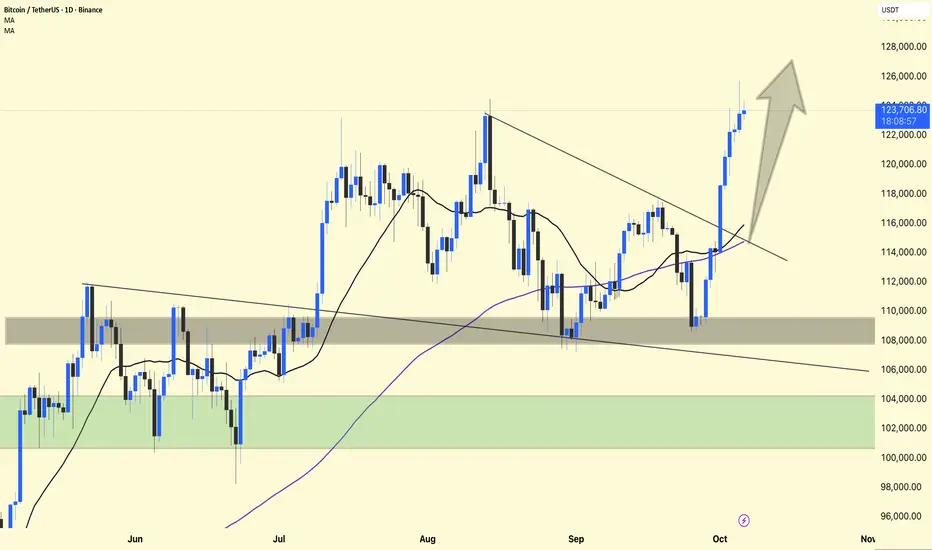
Bitcoin Technical Update – Strong Breakout!Bitcoin has successfully broken out of the descending trendline that had been holding the price down for several weeks. This breakout confirms a shift in market structure from bearish to bullish.
After finding strong support around the $110,000-$112,000 area, BTC bounced sharply and reclaimed both the 21-day and 100-day moving averages – a powerful bullish signal. As long as the price remains above $115,000 to $116,000, we can expect continued upward momentum.
The current move shows healthy strength with volume support, indicating strong buyer interest. If momentum persists, the next potential target is around the $125,000-$128,000 area, where some profit-taking could occur.
Support: $115,000 – $116,000 (previous resistance turned support)
Resistance: $125,000 – $128,000 (short-term target area)
Currently, the upside remains in bullish favor. If the market structure remains stable, any decline towards $116,000-$118,000 could provide a potential buying opportunity.
Remember: Avoid blindly chasing breakouts. Allow the price to retest or consolidate before entering — patience pays off in trend trades.
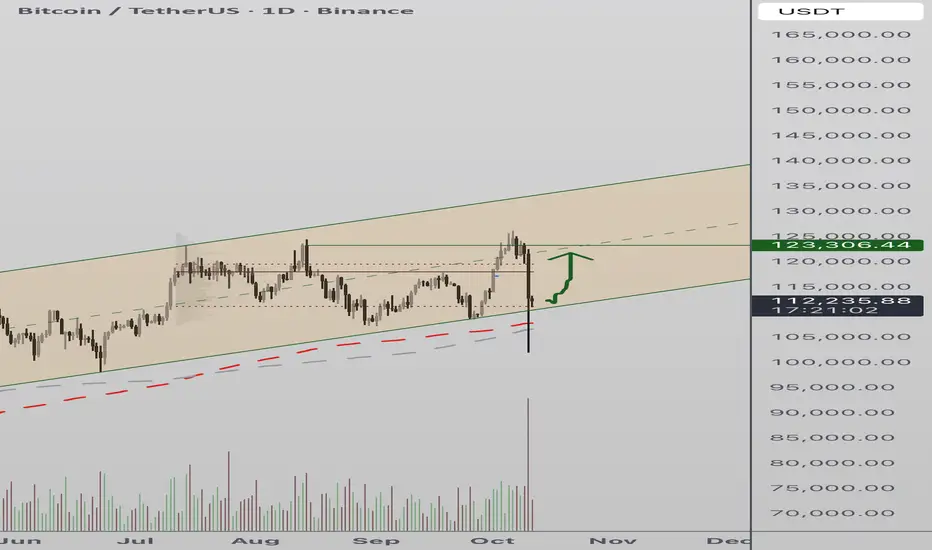
Bitcoin Reclaims Channel Support After Sharp Liquidity CascadeBitcoin recently experienced a sharp correction, sweeping through major swing lows in a widespread liquidity cascade. Despite the heavy drawdown, the market has shown early signs of recovery, with price action reclaiming the lower boundary of the trading channel. This development could set the stage for a short-term relief rally — provided the reclaimed level holds as support.
Key Technical Points:
- Channel Reclaim: Price has recovered the lower boundary of the trading channel after a liquidity sweep.
- Fresh Structure: The current rebound remains early-stage and requires further confirmation through consolidation.
- Relief Rally Potential: Sustained support above the channel low could lead to a bullish rotation toward higher levels.
Following the liquidation-driven drop, Bitcoin has stabilized above the channel’s lower limit — a critical technical threshold for directional bias. This region now acts as a pivot between continuation lower or recovery toward the mid-range. Market structure suggests that post-liquidation consolidations often trigger countertrend rallies as selling pressure exhausts and new buyers step in.
For this scenario to unfold, Bitcoin must continue closing candles above the reclaimed level while volume and momentum gradually improve. A sustained defense of this area could push price action higher into mid-range targets, signaling the beginning of a broader recovery. However, if the market fails to maintain this base, another sweep of recent lows could follow before a more stable reversal forms.
BTC (SHORT)BINANCE:BTCUSDT
SHORT
Entry 123 900
SL 126 300
T1 117 500
Golden Advices.
********************
* Please calculate your losses before the entry.
* Do not enter any trade you find it not suitable for you.
* No FOMO - No Rush , it is a long journey.

BTC/USD ANALYSISBitcoin is currently sitting in a strong demand zone, a beautiful area that could trigger a new ATH (All-Time High).
According to my analysis, we’re now in the final wave of wave 5 in the Elliott Wave structure.
This phase could mark the end of the bullish cycle, with one last strong push to a new high before a major correction takes place.
🎯 Likely scenario:
Short to mid-term bullish continuation
New ATH possible from this zone
Then a significant drop once wave 5 completes
🕰️ Patience and risk management — the last wave often traps the market.

BITCOIN SIGNAL: LEVERAGE DRIVEN PUMP! (where it ends??!)Yello Paradisers! Enjoy the video!
And Paradisers! Keep in mind to trade only with a proper professional trading strategy. Wait for confirmations. Play with tactics. This is the only way you can be long-term profitable.
Remember, don’t trade without confirmations. Wait for them before creating a trade. Be disciplined, patient, and emotionally controlled. Only trade the highest probability setups with the greatest risk to reward ratio. This will ensure that you become a long-term profitable professional trader.
Don't be a gambler. Don't try to get rich quick. Make sure that your trading is professionally based on proper strategies and trade tactics.

#BITCOIN ANALYSIS For the last 40 days I’ve been telling you #BITCOIN ANALYSIS
For the last 40 days I’ve been telling you guys I’m bearish on $BTC. We already dropped almost 8K twice, but every time Bitcoin reclaimed the levels again. Right now it’s trading around 18K to 119k but nothing has changed for me. I’m still bearish.
I’ve said many times that the 115K to 124K region is a short zone, not a long zone. If you’re still holding longs, I’d strongly suggest you flip to shorts because the chart is flashing multiple top signals.
Don’t get trapped by hype like “Bitcoin to 1 million by the end of this year.” That’s just noise. The structure is weak, liquidity is being engineered, and the bigger downside move is still ahead.
📌 Downside Targets:
105K → 100K → 95K → 90K

Bitcoin - October 4th '25This is what I see.
Includes:
50% rule implementation
Sentiment Evaluation (Personal)
Candle Patterning Evaluation (Personal)
FVG Structure
Local Support
Price Percentage Change
Enjoy!
Mr. Storm

BITCOINTHE ROOF connecting the two most current highs on 3hr close provided a perfect point of entry and the best rejection for the daily candle.the zone of 124,478-125k was rejected.
i dont know if its possible to return to 116-117k zone ,however should price comes to this zone we have a buy floor ,based on the break and retest rule.
break and close 124,478-125k will expose 135k-145k zone depending on the volatility +liquidity in the market.
dont forget that take profit is on the way for earlier investors, dont let them dump this coin on you.
GOODLUCK
#BTC #BITCOIN

BITCOIN BITCOIN ,THE CURRENT structure shows no slowing down by buyers, if they break 124k they will head straight into 135k-145k zone .my goal is to see what buyer will do on the supply roof of the bullish channel.
layer by layer

Warning to all traders!Alright, let’s get real for a moment.
If you’re a trader and you’ve already BUY all your BTC around these levels , I’ve got one thing to say: you might wanna take a step back and think about what trading really means.
Because the essence of trading isn’t just “buy low, sell high.”
It’s about repeating that process — again and again — to stack profits over time. That’s the real game. Consistency beats luck every single time.
Now, let’s talk about this current Bitcoin situation.
BTC sitting around $121,000 — sounds wild, right? It took 15 years to climb to this level. But here’s the harsh truth: for it to go beyond $125K or $200K, there’s just not enough money flow to push it that high right now. Think about the sheer amount of liquidity it takes to move an asset like Bitcoin from $121K to $200K — it’s enormous. That kind of move doesn’t just happen because people on X (Twitter) are hyped. It needs massive capital inflows — and that’s not coming overnight. Maybe in 10 years? Maybe.
So, what’s the smart move here?
If you’re a real trader, your best window isn’t chasing Bitcoin at its all-time highs — it’s waiting for that 40% (60k ~80k~100k )dip.
That’s where you load up. That’s where the real profit is made. The crowd buys the top; the trader buys the blood.
I’m just a simple man with a head on his shoulders.
If I can see this, then believe me — even Michael Saylor can too. So, don’t let the hype blind you. Be careful out there, because the fall is coming, and if you don’t understand the trick — buy low, sell high, repeat — then maybe trading isn’t your game.
Stay smart. Stay patient.
And remember — profit isn’t made in the rush, it’s made in the cycle.
Good luck and good hunt!
BTC ( Long ) or (Spot)BINANCE:BTCUSDT
LONG & SPOT
Entry 117 800
SL 115 000
T1 131 700
Extra Targets 137 000 & 160 000 are optional
Golden Advices.
********************
* Please calculate your losses before the entry.
* Do not enter any trade you find it not suitable for you.
* No FOMO - No Rush , it is a long journey.

BTCUSD NEXT POSSIBLE MOVE Bitcoin is consolidating near a strong support zone, showing signs of accumulation. If the price continues to respect this area, a bullish move can be expected ahead.
Structure remains positive as long as price holds above support — buyers may soon take control.
