BTCUSD NEXT POSSIBLE MOVE Bitcoin is consolidating near a strong support zone, showing signs of accumulation. If the price continues to respect this area, a bullish move can be expected ahead.
Structure remains positive as long as price holds above support — buyers may soon take control.
USDTBTC.P trade ideas

#BTC Potential Bearish Head and Shoulders📊#BTC Potential Bearish Head and Shoulders📉
🧠From a structural perspective, we've reached a new all-time high, but the weekly resistance level is nearby. Chasing the trend here presents a less-than-ideal profit-loss ratio and carries a higher risk. There's a chance a bearish head and shoulders pattern could form. If so, consider some short trades.
➡️If you're shorting now, be aware that you're trading against the trend, so use a small position. The advantage of this approach is a higher profit-loss ratio, but a lower win rate.
🤜If you like my analysis, please like 💖 and share 💬
BITGET:BTCUSDT.P

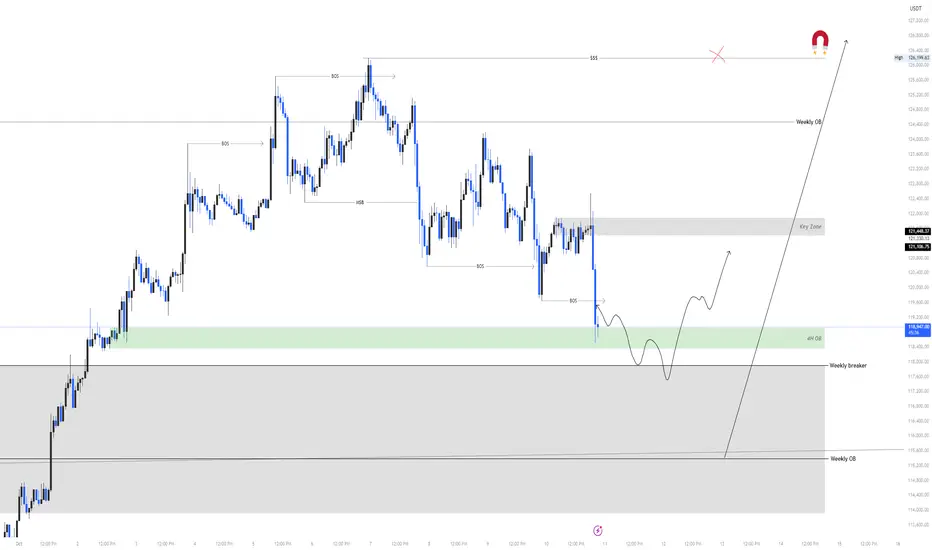
BTC Top Down Analysis! Let's break it out logically. Starting with Weekly TF CRYPTOCAP:BTC swept its ATH and dropped.
Two main reasons:
1- Liquidity grab (took out SLs above ATH)
2- Hit strong Weekly Bearish OB and reversed.
Now Weekly & Daily TFs are still bullish this is just a pullback so no panic scene.
Question is: how far can it go?
CRYPTOCAP:BTC is moving toward Weekly Breaker Block (117.9k) and Weekly Bullish OB (115.3k) right now it’s trading inside a 4H Bullish OB (Green Zone)
I’ll wait for reversal signs (CHOCH or Bullish OB) on STF to buy again. If confirmed I’ll buy with SL below 113.5k - 112.5k zone.
For now, STF is still bearish so I’ll wait I’m already in a CRYPTOCAP:BTC buy from 110k zone.
CRYPTOCAP:BTC is sitting in a 4h demand zone just wait for confirmation.
BTC USD reversal BTC showing sign of reversal entry TS on a higher time frame , but and wil be a risky trade so entering on a lower quantity

BITCOIN IF YOUR CHECK MY LAST POST on bitcoin ,the analysis is 100% correct with little deviation ,the next is to wait for price at 117-116K
#bitcoin #btc #btcusdt

BTC - How Manipulation Works and How to Detect It I subscribe to premium solely for the multi second time frames, time frames that you may think are useless.
What if I told you this is the ONLY true way to detect manipulation?
HOW MANIPULATION WORKS
It’s a lot more subtle than you think.
The main driver of what moves the price of Bitcoin is the adverse orders from derivatives and leveraged positions. These orders being stop loss orders and liquidation orders.
In essence, it’s traders own decisions and orders, that cause price to move in an opposite direction.
You may have heard people say “Do the Opposite” or “Contrarian Trader”. What they mean is, the market seems to move in the opposite direction as the majority sentiment. Even the fear and greed index is used to convey this principal.
However there’s a true and technical way of understanding this.
As bitcoins price moves and consolidates SLOWLY and STEADILY in one direction, this extended period of time allows traders to enter leveraged positions in that same direction that’s moving price slowly up or slowly down.
Consequently, these trades are leaving opposite direction orders of a larger magnitude, such as stop loss orders for the “entire leveraged position size”. For example, Trader Bob uses $100 to inject liquidity into a long position, and opts to use 80x because of his confidence in Bitcoin moving up. Trader Bob then sets a stop loss order which “sells” his position and closes 100% of his leveraged position size. Trader Bob sets BELOW the current price a sell order for $8,000 - 80x his original $100 injected.
MANIPULATION comes in two distinct parts.
1) Price is held stable, to ACCUMULATE and ATTRACT more of the orders (long or short) - which the market makers and exchanges know is ACTUALLY creating more propellant and energy that will move price in the opposite way.
As an example, if Bitcoin is at 100,000 and the market makers and exchanges know there’s a mass amount of liquidity to reclaim at 80,000 - they will do a series of manipulations to get price to that level.
A) They will hold price steady while looking like Bitcoin is about to keep moving up. This attracts more longs with different leverage and stop loss orders creeping closer to 80,000
B) They will drop price slowly, and rise back quickly. The slow drop allows time for traders to work down the price scale those stop losses and liquidations, and the fast rise ensures they are left in tact and price won’t move low enough to trigger off the chain reaction.
SUMMARY OF 1)
Price is manipulation by being KEPT or STABLE from setting off the chain reaction of stop loss orders, which offering time to get traders to place more of these orders.
NOTE THAT Market Makers don’t place their own trades. They accommodate leveraging traders. That said, they do want their money back - so they want traders to place trades in the losing direction, while simultaneously having their own stop loss orders set a chain reaction that takes price to the level they want.
2) Price is PUSHED or FORCED into the chain reaction of stop loss orders and liquidation orders.
This is the manipulation that forces price, however we can understand the mechanics fully and understand the intentions.
Manipulators (hidden providers of liquidity) will place icebergs or many small orders, which generate large volume in small time intervals, and force bitcoin into the series of orders.
It is then the traders own adverse orders that automatically fulfill the price movement.
SUMMARY OF 2)
Price manipulation is initially forcing price into a series of stop loss orders and liquidation orders, and it’s possible to detect this.
USING THE 5 SECOND TIMEFRAME TO DETECT MANIPULATION
1) Add the basic VOLUME indicator to your chart
NOTE - Suggest using Binance BTC chart
2) Note the Volume moving average - which is shown as a Bitcoin Amount transacted each 5 second interval. This is commonly 0-2 BTC transacted per 5 second.
3) Observe each candle volume coming in. The time frame is small enough that you can see if it’s a buy or sell, very seldomly mixed buys / sells. This also serves as an alternative Order Book.
4) Watch for abnormally large volume transactions on the 5 second candles. It’s not out of the ordinary to spot a 5 second candle that contains 500 BTC bought or sold.
THIS is CERTAINLY the price manipulation that forces price into a sequence of stop loss orders.
5) Use that buy or sell manipulation volume candle as a que to understand the intention of where price is going to be forced.
THE WRAP UP
I hope to assist you all with understanding that the Bitcoin chart is very much INTENTIONAL and can be treated as a STRATEGIC BUSINESS due to the market cap being dominated by leveraging liquidity and few players who control it.
Love and luck to all,
- DD
Positive Market - BTC Continues to Find New ATHBTCUSD Analysis
Bitcoin is currently testing the upper boundary of a long-term ascending channel, where price has previously faced rejection several times (as shown by the red arrows).
The market recently completed a strong rally toward 124K, aligning with the 1.618 Fibonacci extension (123,609) — a significant resistance zone that triggered selling pressure.
Key observations:
• Resistance area: Around 124K–125K, aligning with the upper channel line — potential for short-term correction.
• Support zones: The first support lies near 118,100, followed by 115,000–115,500, both acting as Fibonacci retracement zones.
• Possible scenarios:
1. Price may retrace toward 118K–115K to gather liquidity before another push upward.
2. If the market holds above 123K, a breakout toward 132K–133K could be confirmed.
Overall, momentum remains bullish, but the current zone requires caution — a short-term pullback is likely before the next major move.

BTC/USDT Forecast: $110K – $150K Buy SetupBTC/USDT Forecast: $110K – $150K Buy Setup
Elliott Wave Count
The chart shows Bitcoin is moving in a 5-wave impulsive structure.
Waves (1), (2), (3), and (4) are already complete. Currently, the market is preparing for Wave (5) to the upside.
Typically, Wave (5) is the final bullish push after a corrective Wave (4). This means we are looking at a potential strong rally to finish the structure.
Market Structure & Channel
Price is respecting a rising channel (black trendlines). Each dip has found support along the lower boundary.
After consolidating around $120K, Bitcoin looks set to retest lower liquidity around $110K, which aligns with support and also the entry zone marked on the chart.
From this support, buyers are expected to step in and push price back to the upper channel line near $150K.
Entry, Stop, and Target
Entry Zone: $110,000 – $112,000
This area is marked as the ideal “buy zone” where the structure supports accumulation before the next leg up.
Stop Loss: Around $106,000 (below the channel and previous structure low).
Target: $150,000
This is the projected completion of Wave (5), aligning with the top of the channel.
Risk-to-Reward (RR)
Risk is roughly $4K–$6K per BTC (from $110K entry to $106K stop).
Reward is about $40K (from $110K to $150K).
That’s an RR ratio of around 1:7 to 1:10, which is highly favorable.
Psychological View
As a reader, this makes sense because the chart clearly shows the wave pattern and logical support/resistance zones.
Even if BTC dips first, the structure says it’s still bullish in the bigger picture.
The idea is simple: buy the dip into support (wave 4 low region) and ride the momentum into the final wave (wave 5).

BTC STILL IN TREND FOR MORE.. UPDATE 04-10-2025📊 Market Update
Bitcoin (BTC):
Bitcoin is maintaining its main upward trend, which continues to define the overall bullish structure. At the moment, BTC is trading in a new lower time-frame zone and needs to hold above $121.6K to confirm a green (bullish) structure on the lower time frame.
Bitcoin is positive until now

What if...?A rising wedge pattern in the final stages makes sense to me. We've been trading up only since 2023 and past cycles always end before everyone keep waiting for the "last leg up" to sell. Why this time should be any different?

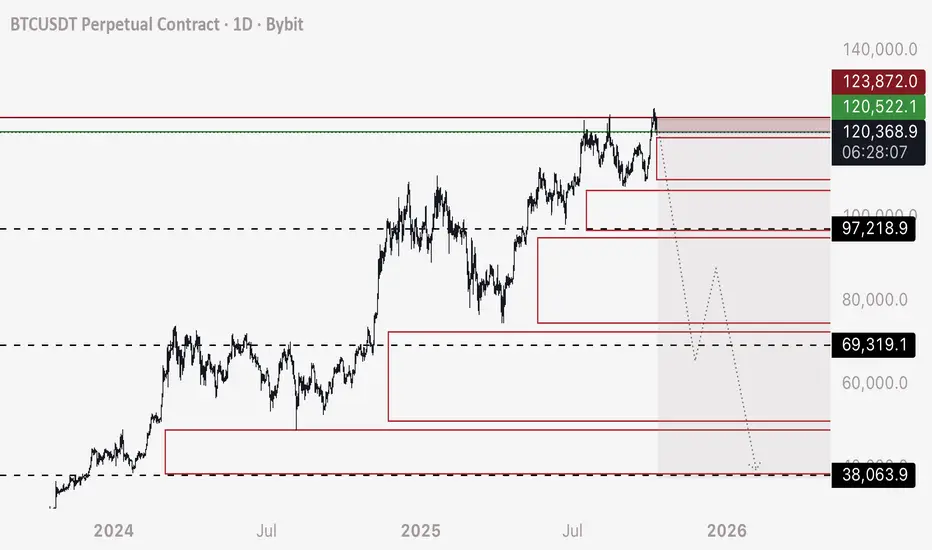
BTC - Short a Stop Hunt and Stay on the Right SideI’m breaking my larger idea down into multiple trades, now that others are opening up to the reality that it’s possible.
These order blocks shown are filled with long position stop losses, leveraged sell orders that only fill when price crosses over - and will set off like a chain reaction.
This will create a very fast drop IE Stop Hunt - and we can take advantage of it.
TRADE 1 - SHORT
Entry - 120,200 to 120,500
Stop Loss - 123,800 (although I don’t see Bitcoin rising back above 121,000 before this trade completes)
Target 1 - 97,250 (Close 25% of trade)
Target 2 - 69,400 (Close 50% of trade)
Target 3 - 38,100 (Close 40-90% of trade as it’s possible we continue to drop and don’t retrace from here to 90,000 appx)
I’ll be logging this trade.
All the best and buckle in.
- DD
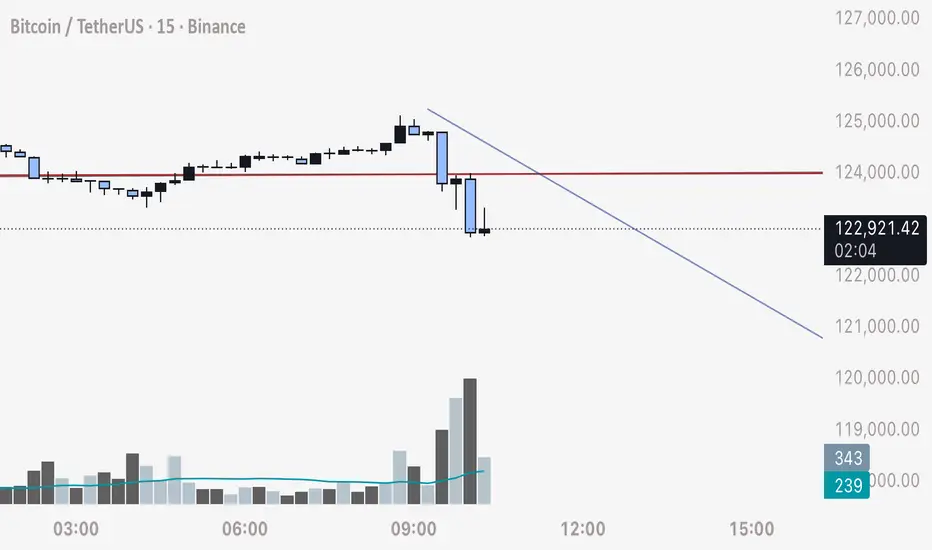
BTC - Bullish BiasThe price aggressively consolidated around this zone, where the bulls are trying their best not to lose control. With Gold making an (ATH), it would be risky to short BTC here, as there is likely some more room for a move up remaining. When you see this type of accumulation wick in an uptrending market, you should know that institutions are accumulating. Although the current market sentiment is very bearish, I like to bet the opposite way. I might be wrong, but we will see. That is why we call trading a game of probability."
Another sure indication is that we are dumping liquidity just before the New York (NY) open, plus the UK session accumulated liquidity. This suggests a kind of lower time-frame bullish scenario for the duration of the NY open.

Bitcoin Cup and Handle Pattern!BTCUSDT technical analysis update
BTC is forming a cup and handle pattern on the weekly chart. The price is currently forming the handle, which could take 1-2 months to complete. Once the price breaks the neckline, we can expect a significant bullish move in BTC.
Regards
Hexa

Bitcoin 130,000 – Correction AheadBitcoin
Around the $130,000 level, there is a possibility of a deep correction toward the $74,000 zone.
Do not panic, and do not get carried away by emotions.
This is the market — it plays with your psychology.
The market is geometric. BYBIT:BTCUSDT

BTC/USDTENTRY:122927_125700
SL:126505
TP:109700
Hunter pressing the trap button
**Please observe capital management
There is no responsibility for your profits or losses.**

#BITCOIN ANALYSIS For the last 40 days I’ve been telling you #BITCOIN ANALYSIS
For the last 40 days I’ve been telling you guys I’m bearish on $BTC. We already dropped almost 8K twice, but every time Bitcoin reclaimed the levels again. Right now it’s trading around 18K to 119k but nothing has changed for me. I’m still bearish.
I’ve said many times that the 115K to 124K region is a short zone, not a long zone. If you’re still holding longs, I’d strongly suggest you flip to shorts because the chart is flashing multiple top signals.
Don’t get trapped by hype like “Bitcoin to 1 million by the end of this year.” That’s just noise. The structure is weak, liquidity is being engineered, and the bigger downside move is still ahead.
📌 Downside Targets:
105K → 100K → 95K → 90K

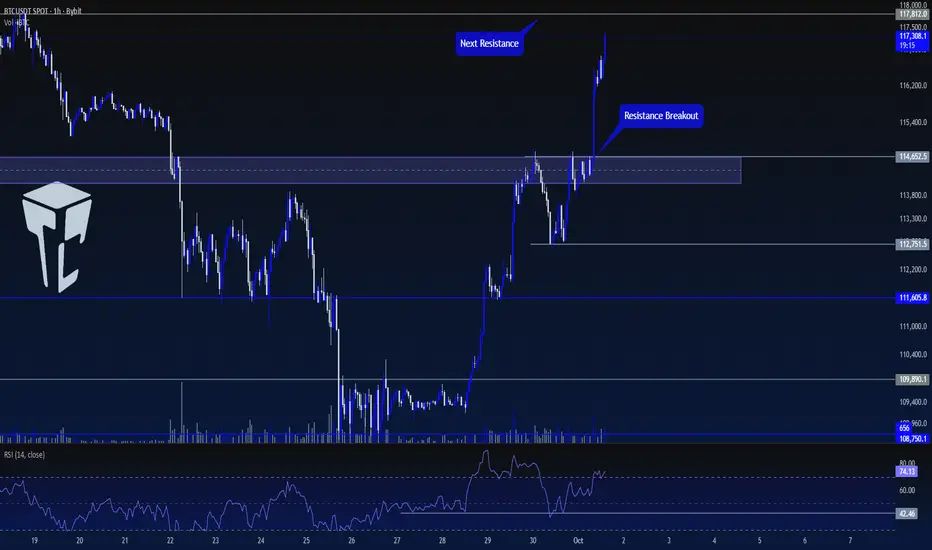
TradeCityPro | Bitcoin Daily Analysis #185👋 Welcome to TradeCity Pro!
Let’s move on to the Bitcoin analysis. Bitcoin’s bullish trend is still continuing, and today during the London session it made another upward move. Let’s review today’s triggers together.
⏳ 1-Hour Timeframe
Yesterday, after the correction, Bitcoin formed a bottom at 112751 and with the RSI being supported at 42.46, the upward move started.
🔔 The trigger we had yesterday for opening a position was the breakout of the resistance zone, with the exact trigger forming at 114652. After the breakout, the price started its second upward wave.
💥 The RSI oscillator has also entered the Overbuy zone, and the market momentum is fully bullish. The next resistance we have is at 117812.
💫 If the price reaches 117812 and the RSI exits the Overbuy zone, we can take profit on the position.
✅ For a new position, no fresh trigger can be given right now because the price is moving sharply upward, and opening any new position here would be considered risky with a high chance of hitting stop-loss.
📊 The area I expect the price to react to is 117812, but I will wait for the price to first build a structure before opening a position.
❌ Disclaimer ❌
Trading futures is highly risky and dangerous. If you're not an expert, these triggers may not be suitable for you. You should first learn risk and capital management. You can also use the educational content from this channel.
Finally, these triggers reflect my personal opinions on price action, and the market may move completely against this analysis. So, do your own research before opening any position.
Bitcoin is in uncertainty. In my previous analysis, I predicted that Bitcoin would reach ATH if it broke through its channel and resistance with a high volume candle. And that's exactly what happened. Now, for the upward momentum to continue, the daily candle must close above ATH. However, as you can see, it's taking a wick from above. If today's candle closes this way, our direction will be 118,000.

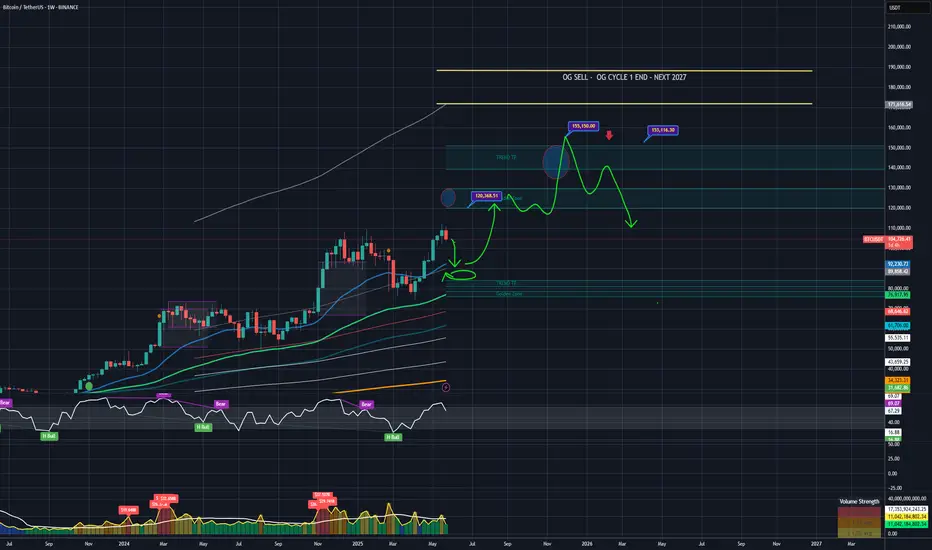
OG CYCLES - NOV 2025 - 2026 FEBOG CYCLE 1 - 132 300 - 155 200 / 2025 NOV - 2026 FEB
OG CYCLE 2 - 250 000 - 302 300 / 2027 Last cycle / Focus BTC only
BITCOIN DAILYBITCOIN OVERSIGHT AND CORRECTIONS FOR EDUCATIONAL PURPOSE ONLY
(1)DEMAND FLOOR AT 109,060.77 was a retest to the neckline of double bottom a bullish price action signal on daily candle close as illustrated from our line chart and it came with another confluence from an ascending trendline to add more impetus to the buy rally and many missed and lost money too.
(2) SUPPLY ROOF 117,383.70 a previous demand floor on daily after break of structure it became supply roof and stopped upswing twice ,but due to buy rally that key level is broken after 2 retested attempt ,on technical a broken supply roof is now our demand floor except the sell order exceed buy order that zone 117,383.70 holds support on daily candle close .
(3) 123,387-124,478.66-125k daily supply roof and our current all time high .
this zone has an ascending trendline connecting the two highs and on technical the next high should be 127,071-128k for sell in the direction of the previous two all time highs(123,387-124,478.66)
my ideal zone to attempt sell should be 127,071-128k zone
note ;you can avoid selling and wait for buy zone 117,383.70 and its possible tat price wont return to this level.
trading is 100% a game of probability.(win/loss) comes with it.
No holy gril,nothing like best strategy.
what we have is masters in RISK MANAGEMENT,THE BEST TRADERS ARE EXPERTS IN RISK MANAGEMENT,THEY ALL HAVE ZERO EMOTION,THEY DONT CHASE WHAT IS LOST.
GOODLUCK
#BITCOIN #BTCUSDT #BTC #CRYTO

#BTC 4H Bearish Structure, Cautiously Bullish 📊 #BTC 4H Bearish Structure, Cautiously Bullish ⚠️
🧠From a structural perspective, we've broken below the yellow support zone, which has transformed into the blue resistance zone. This also indicates a bearish structure has emerged on the 4H chart, so caution with bullish sentiment! If price can rebound into the blue resistance zone, we could look for short opportunities.
➡️Interim support is around 118,000, with extreme support around 114,888 (if it reaches this level today, we could try to take some long positions).
🤜If you like my analysis, please like 💖 and share 💬
BITGET:BTCUSDT.P

BITCOIN BITCOIN ,THE CURRENT structure shows no slowing down by buyers, if they break 124k they will head straight into 135k-145k zone .my goal is to see what buyer will do on the supply roof of the bullish channel.
layer by layer

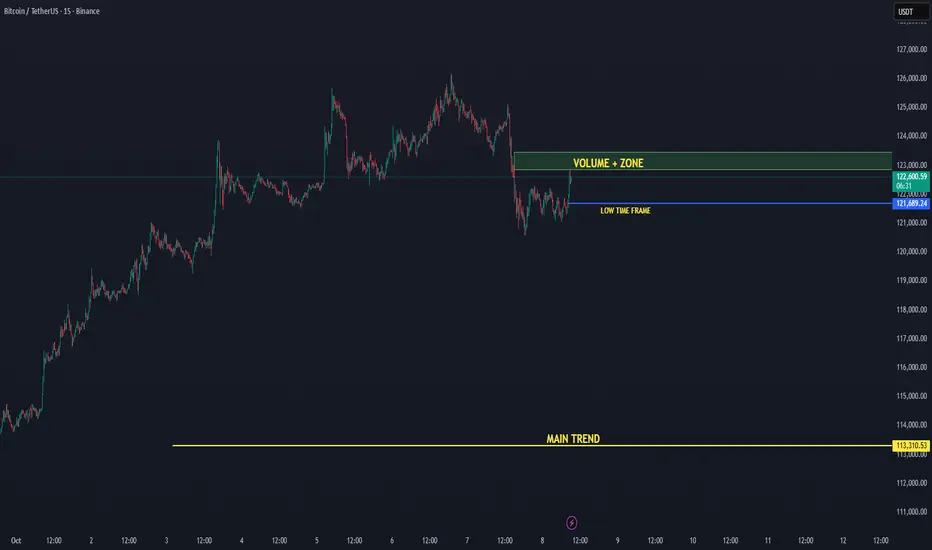
BTC/USDT — Low Time Frame Recovered, Eyes on Volume 08-10-2025Bitcoin has reclaimed its low time frame level near $121.6K, signaling renewed short-term strength. Price is now pushing upward toward the +Volume Zone, an area where increased buying activity could trigger a breakout continuation.
📈 Low Time Frame Reclaimed: BTC has stabilized above the local structure, confirming short-term bullish momentum.
🔊 Volume Zone Target: The next resistance sits around $123K, where increased trading activity could accelerate a move higher.
🟢 Main Trend Active: The primary uptrend remains strong as long as BTC holds above the $113K main trend support.
Technical Levels:
🟢 Main Trend Support: $113K
🟡 Low Time Frame Support: $121.6K
🔊 Volume Zone Resistance: $123K
🎯 Next Target: $125–$126K
Outlook:
Bitcoin is showing healthy recovery momentum, reclaiming short-term structure and heading into the Volume Zone. If it sustains above $121.6K and breaks $123K with volume confirmation, a continuation toward $125K+ becomes likely.
📊 Bias: Bullish continuation
📈 Focus: Volume reaction at $123K