BTC HOLDS LEVELS FOR MORE..BTC/USDT — Main Trend Holds Strong at $112K, Confirmation Near
Bitcoin is currently trading just below the low time frame zone around $124.5K, showing slight resistance before a potential confirmation breakout. Despite this minor pullback, the main trend remains firmly intact around $112K, which continues to act as the key structural support.
⚙️ Main trend updated to $112K: This level defines Bitcoin’s long-term bullish structure — as long as BTC stays above it, momentum remains positive.
📉 Below low time frame: BTC is temporarily consolidating under local resistance, but proximity to this level suggests a potential re-test and confirmation soon.
🚀 Upside target: Once the low time frame confirms, Bitcoin could aim for the next resistance zone near $132K.
Technical Outlook:
🟢 Main Trend (Support): $112K
🟡 Low Time Frame Resistance: $124.5K
🎯 Next Target: $132K (upon confirmation)
Summary:
BTC remains structurally bullish above the $112K main trend. While still slightly below the short-term confirmation zone, it’s positioned well for a potential continuation — provided support holds and price regains momentum above $124.5K.
📊 Bias: Cautiously Bullish
📈 Key Levels: Support $112K | Resistance $124.5K | Target $132K
USDTBTC.P trade ideas

#BITCOIN ANALYSIS I have been warning you for the last 45 days #BITCOIN ANALYSIS
I have been warning you for the last 45 days that a big dump was coming and now it’s playing out exactly. Bitcoin has already dumped around $20K and is now trading near 112K, right at the major resistance zone that has triggered every big correction since 2018.
A small bounce to 115K–116K is possible, but after that I expect another leg down toward 100K, and potentially lower to 90K.
I’m still holding my 50% short position. If anything changes or I close my position, I’ll update you. Remember I mentioned earlier that if BTC went back to 125K–128K, I would add more shorts and that plan hasn’t changed.
Till Monday, I expect some volatility, but Monday’s price action will give a clearer direction.
🔸 Weekly:
BTC touched the long-term trendline again → clear rejection happened.
👉 Until we get a weekly close above 125K, the risk of a major pullback stays high.
BITSTAMP:BTCUSD
🔸 Daily:
Price is inside the 110K–125K supply zone. Structure is weak.
If price breaks and resists below 110K, then 100K is the next target.
📊 My Trade:
✅ First target 105K hit
Holding 50% shorts, expecting a bounce to 115K, then lower.
📌 Downside Targets: 105K ✅ → 100K → 95K → 90K

BTC/USDT – Roadmap Toward $150K and BeyondIn previous analysis, we highlighted that BTC is in a re-accumulation phase, ranging above one of the most important trendlines of the current cycle. For more than 80 days, price has repeatedly tested this zone, each time showing strong bounces and rapid reactions, confirming the significance of this level.
This sustained consolidation above the “magic trendline” is laying the groundwork for the next leg into price discovery. Should BTC achieve a decisive close above the red resistance box, the roadmap points toward a medium-term target of $150K, with the potential to extend further toward the $222K zone as liquidity unlocks and trend momentum accelerates.

Next Volatility Period: Around October 14th
Hello, traders!
Follow us to get the latest information quickly.
Have a great day!
-------------------------------------
(BTCUSDT 1D Chart)
This volatility period is expected to last until October 4th.
Accordingly, the key question is whether it can find support near 119,177.56 and rise.
If not, and the price declines, support near 115,854.56 will be crucial.
If it finds support near 119,177.56 and rises, it is expected to challenge the Fibonacci ratio of 2.618 (133,889.92).
The key areas for maintaining an uptrend are:
- Short-term: 115,854.56-119,177.56,
- Medium-term: 104,463.99-108,353.0,
- Long-term: 87,814.27-93,570.28.
-
Thank you for reading.
We wish you successful trading.
--------------------------------------------------
- Here's an explanation of the big picture.
(3-year bull market, 1-year bear market pattern)
I'll explain more in detail when the bear market begins.
------------------------------------------------------

Bitcoin (BTC), End of Cycle Season Based on Cycle DurationBINANCE:BTCUSDT
Bitcoin appears to have already formed its peak within the current bullish cycle and may now be preparing for a correction.
Alternatively, if BTC makes another attempt to reach a new all-time high within October, that period could mark the final peak of this cycle.
Looking at historical data, Bitcoin has shown a repeating pattern —
an uptrend lasting approximately 3 years and 11 months (1,065 days) from the bottom,
followed by a downtrend of about 1 year (365 days) from the peak.
During down cycles, the cycle low has typically formed between the EMA 50 and EMA 100.
Backtesting monthly charts shows that Bitcoin often breaks below the EMA 50, finds support above the EMA 100, and then breaks through the Ichimoku Cloud, signaling the start of a new bullish cycle.
Become an early follower and be part of the journey.🚀
I am Korean and I used Google Translate.

126K is like a wall!With Bitcoin clinging to the upper end of its daily range, the chart offers a mix of bullish afterglow and bearish skepticism. Traders are watching key support and resistance levels as the market teeters on the brink of a breakout or breakdown.
Bitcoin remains in a post-uptrend pause following its recent breakout above $126,000. While the macro trend is bullish, price action is cooling, with two consecutive indecisive candlesticks suggesting momentum may be fading.
A pullback to the $122,000–$121,000 range could offer an attractive long-term setup—assuming bulls emerge with volume. Resistance still lurks around $126,000–$127,000, and without a strong catalyst, upside is likely to be limited in the short term. For now, this looks like a market taking a breather.
If you're following the trend, bulls still have the upper hand. Every major moving average, from the 10-day to the 200-day, is firmly in buy mode, and price action is consolidating above key support levels—not breaking down below them. A rebound from the $124,000 area could trigger another push towards $126,000 or higher, especially if volume picks up again. For now, this pullback is a breather, not a breakdown. I still believe $120,000 is a key level!!! A decisive break below $120,000 could open a trap door to $110,000—or even lower.

BTC Prime Levels These are my Prime Levels, key price zones where BTC reacts the most.
How I Trade Them:
Close Above a Level : I buy - price showing strength.
Close Below a Level : I sell - price showing weakness.
Rejection at a Level : I trade the bounce - moving opposite of the rejection.
The idea is simple, let price decide.
I don’t predict i just react to how BTC behaves around these Prime Levels.
You can scalp on 5 min tf or day trade them on any tf, depending on your style.

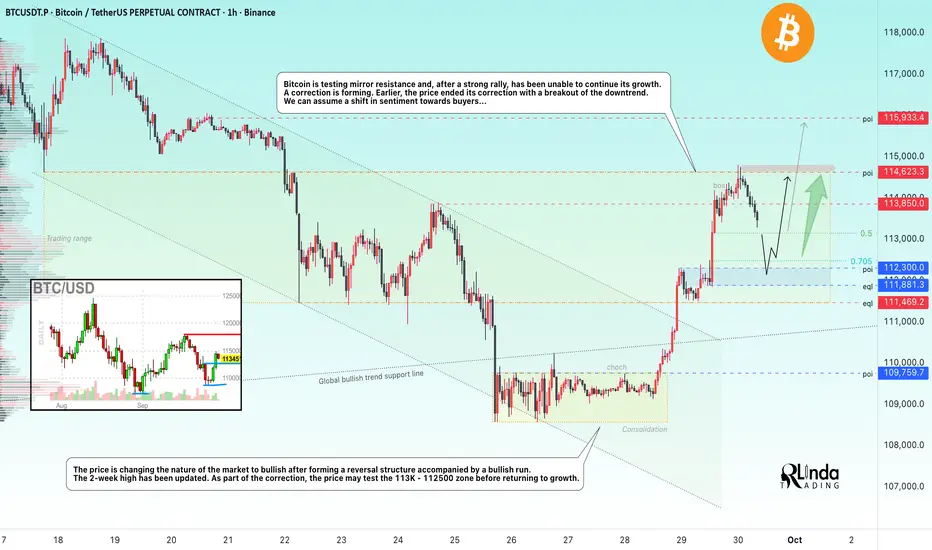
BITCOIN → Correction before the breakout of 114.5KBINANCE:BTCUSDT , after the end of the correction, is forming a 3.5% rally and testing the important milestone of 114,600. It was not possible to break through the level without consolidation and at such a high speed. How long will the correction last?
Bitcoin is testing mirror resistance and, after a strong rally, was unable to continue its growth. The reason for the halt is a huge liquidity pool above 114,600. A pullback is forming. Earlier, the price ended a 3-week correction by breaking through the downward resistance. We can assume a change in sentiment towards the buyer...
Technically, the price is changing the nature of the market to bullish after the formation of a reversal structure accompanied by a bullish run. The 2-week high has been updated.
Resistance levels: 113850, 114620, 115900
Support levels: 113100, 112300, 111800
As part of the correction, the price may test the 113K - 112500 zone before returning to growth. If the market holds the price above 112K - 113K, it will confirm the bullish sentiment, and the positive fundamental background will support further growth.
Best regards, R. Linda!
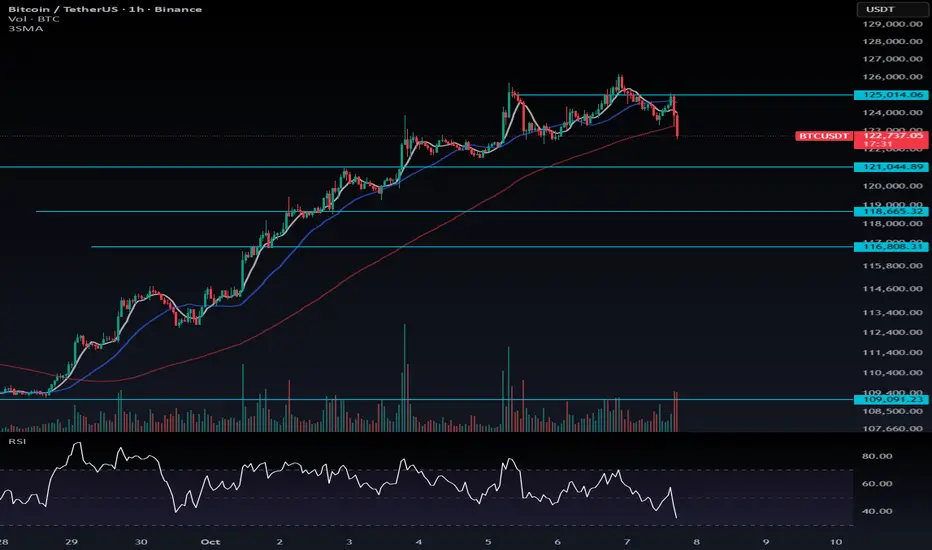
Bitcoin Correction Outlook: Healthy Pullbacks and Key LevelsDon’t fear a Bitcoin correction — embrace it. As I’ve mentioned before, a healthy trend requires both upward moves and corrections. The longer the correction takes to occur, the more powerful and volatile it can be, often accompanied by large candles.
🔹 Key Levels to Watch:
121,000: Maintaining above this level is bullish. Even if BTC dips below and fakes a breakdown, it can still be a positive sign.
Next supports: 118,665 and 116,808.
📈 Trading Note:
Above 125,000, consider long positions.
If BTC Dominance drops during a breakout, shift your focus to altcoins.
For now, observe the market carefully and wait for the right setup — patience is key.
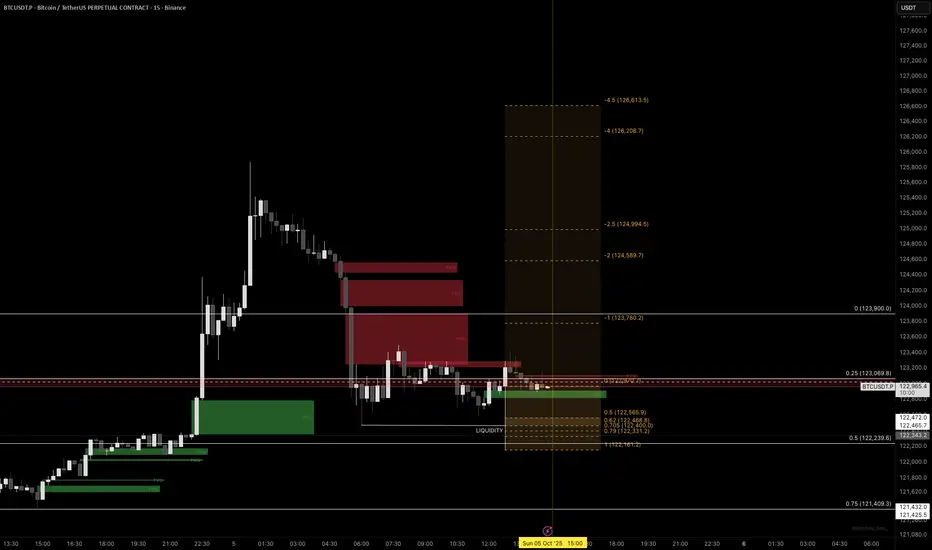
BTC Upside target move possible for monday closeLook for a buy position in BTCUSD from 0.5 level or 122565 level after 3 PM EST New York time
TP-1 123,780
TP-2 124,589
TP-3 126 208
THIS IS NOT A TRADE ADVISE. JUST FOR LEARNING PURPOSES
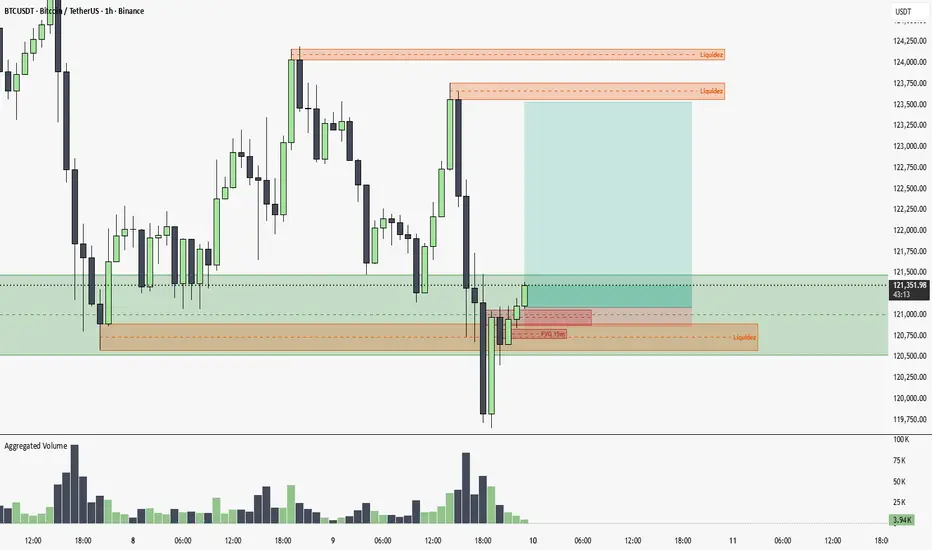
Up until the next liquidity levelThe price has broken through a liquidity level, hunted stops, and bounced back, creating a manipulation. As a target, we have the next liquidity level, and if it breaks that, the PO3 level.
Hello everyoneI came back! :3
I will make new analysis and will generate new analysis for you.
but don't forget the warnings!
BTC/USDT Analysis. Correction Likely
Hello everyone! This is CryptoRobotics trader-analyst with the daily market analysis.
Yesterday, Bitcoin followed our scenario, but with a slight deviation: we tested $125,000 (cluster anomalies) and retested the ATH, after which a correction followed.
At the moment, we have retested this level and received a fairly strong reaction. We expect a correction with targets at $120,000 and $116,000, or, if selling pressure is insufficient, the development of a prolonged sideways movement to accumulate liquidity for the next upward move.
Buy Zones:
$120,400–$119,400 (sales absorption)
$116,700–$115,000 (pushing volumes, strong graphical imbalance)
$112,500–$111,500 (mirror zone, volume anomalies)
$110,000–$108,800 (strong sales absorption)
This publication is not financial advice.
BTC: Growth from $109KOn September 28, Bitcoin turned into an upward movement on the 1-hour chart from the $109,804 zone. From this level, the market went through all four stages of profit-taking and reached $120,999, giving a potential difference of more than $11,000 per coin. Those who followed the system were able to capture the maximum from this trend.
The key point here is how the movement was managed. The algorithm highlighted important zones, helped secure the position in time, and reduced risks. No emotions, no guessing—just a step-by-step process where every action was clear in advance and confirmed by market structure.
For beginners, such a tool works like a navigator: it shows where it’s safer to lock in profits and when it makes sense to hold longer. In conditions of high volatility, discipline, automation, and technical analysis become the main advantage. That’s what turns the market from a chaotic game into a structured process. An interesting fact I’ve noticed is that this indicator shows an 84% win rate on Bitcoin trades.

bitcoin BITCOIN ,THE CURRENT structure shows no slowing down by buyers, if they break 124k they will head straight into 135k-145k zone .my goal is to see what buyer will do on the supply roof of the bullish channel.
layer by layer

Bitcoin BTC Bullish Setup📈 CRYPTO:BTCUSD reached the equal legs area $118588 - $117260 and it's expected to rally from there looking for new highs next week or bounce in 3 waves at least.
#Elliottwave #Trading

BTC – Bearish Setup Developing on 4H#Bitcoin is showing good volume, but on the 4H timeframe, price action is forming a harmonic pattern along with a clear bearish divergence on the indicators.
These are early signals of potential downside. However, for a strong bearish confirmation, I will wait for a break of the key support level.
On the retest of that broken support, I’ll be looking for a short entry with proper risk management.
Reminder: Always trade with discipline and use proper SL/TP to manage risk.
What do you think?
Will #BTC respect this harmonic pattern or surprise us with another bullish push?
Share your thoughts in the comments & don’t forget to follow for more real-time setups and trade ideas.
#BTC #Bitcoin #Crypto #CryptoTrading #CryptoAnalysis #BTCUSD #HarmonicPattern #BearishDivergence #PriceAction #TradingSetup #CryptoCommunity

BTC Lower highs - nose diving soonWe've seen this movie too many times. Lower highs, then crossing 50SMA / 200SMA down. We are an inch away from this happening. Never get sensitive about any of this! Follow the trend, technicals, and understand the f&ckery that is taking place. Every single time it drops, esp. when many of the people in crypto are just profit takers. Again, diminishing YoY returns, doesn't solve any real problems, high transaction cost, and still can't buy a banana with it. CBOE:MSTZ CBOE:UVIX are nice hedges and prob the only thing going up in a down market.
Best of luck and always do your DD!

Drop to $111,000Divergence is seen in the RSI and the buyers' strength is not enough to break through the resistance level. The price will drop to the level of $111,000.

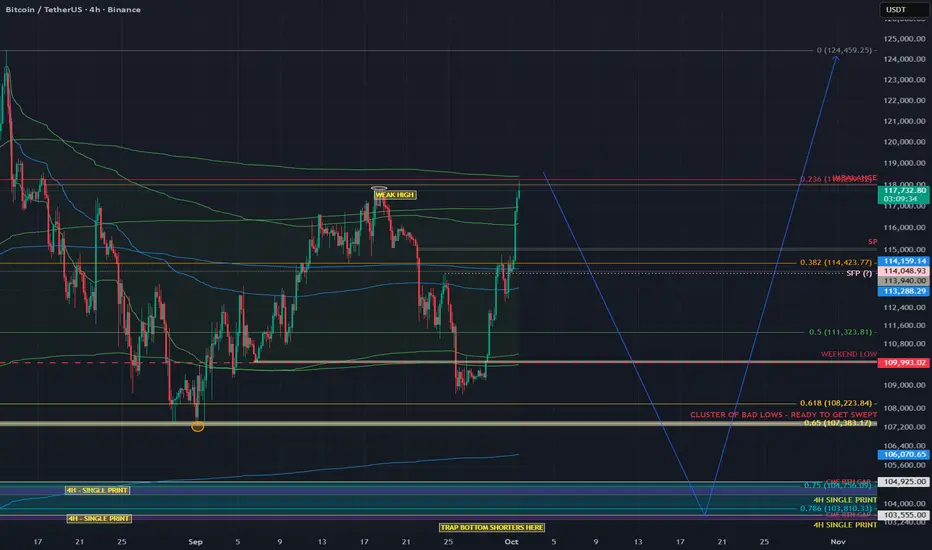
BITCOIN’S PUMP BEFORE THE DUMP — CRYPTO ABOUT TO CRASHTRADERS, WE ARE STARING RIGHT INTO THE EYE OF THE STORM. BITCOIN’S “TOO GOOD TO BE TRUE” RALLY IS BEING PROPPED UP BY LEVERAGED PERPS, NOT REAL SPOT BUYING. THE CHART IS SCREAMING EXHAUSTION: AVWAP BANDS COLLIDING, ORDER FLOW MAXED OUT WITH AGGRESSIVE LONGS, AND A DANGEROUS IMBALANCE AROUND 118K. THIS IS THE PERFECT BREEDING GROUND FOR A MEGA LONG SQUEEZE THAT WILL NOT ONLY RIP THROUGH BITCOIN BUT DRAG THE ENTIRE CRYPTO MARKET DOWN WITH IT. THE PUMP IS THE TRAP. THE DUMP IS LOADING
TLDR;
This leg looks futures-driven, not spot-backed. We’re pushing into AVWAP outer-band confluence with imbalances near 118k while leveraged longs pile in. Base case: sweep the mid-Sept Weak High, fail, rotate down toward 104k (and maybe 98.5k). I’ll flip only if spot CVD takes the lead and price accepts above the AVWAP band cluster.
Why I think the “mega long squeeze” is loading
1) Who’s actually buying? (Spot CVD vs Futures CVD)
Spot CVD: still negative/underwhelming across the push → real buyers (spot) aren’t lifting.
Futures CVD (stablecoin-margined): rising with Open Interest → perps are doing the heavy lifting.
Translation: Leverage is pushing price, not genuine spot accumulation. These moves are fragile and unwind hard when OI compresses.
2) AVWAP confluence (the auction math)
I’m tagging anchored VWAPs from opposing pivots (swing low→high and swing high→low).
The outer bands from these anchors are overlapping in the same zone → both bottom-anchored longs see it as expensive (profit-taking), and top-anchored shorts defend their break-even.
That overlap = double-sided supply. Historically, these reject unless fresh spot demand blows through (which we don’t have… yet).
Still have bad September lows that are likely to be swept at 107k~
3) 118k imbalance
There’s an inefficient push / imbalance around 118k. Thin structure often gets tapped/swept, then mean-reverts if the follow-through is purely leveraged.
4) Order flow is too aggressive (late longs)
OI up + positive delta into resistance = new longs chasing.
On footprint, you can see buy-side aggression meeting absorption near the top of the move. That’s classic trap fuel if we print an SFP.
Trade idea (conceptual, not financial advice)
Base case path (bearish):
✅ Sweep the Weak High (mid-Sept) into 117.8–118.8k (imbalance + AVWAP band confluence).
✅ Print a Swing-Fail Pattern (SFP) / rejection wick on 5–15m with:
Spot CVD NOT confirming (stays flat/negative),
OI spikes while delta stalls (late longs absorbed).
Short after the reclaim/failure back below the swept high; stop above the SFP high.
Targets / magnets:
113.2–114.1k (0.382 zone / local AVWAP midlines)
111.3k (0.5 retrace / prior balance edge)
109.9–109.3k (weekend low / prior node)
106.0–104.9k (SP + LVN cluster, high-prob test area)
Stretch: 103.5k (4H single print) → 98.5k if liquidation cascade extends.
validation / flip criteria:
Acceptance above the AVWAP outer-band cluster and 118.8k with:
Spot CVD turning positive and making higher highs,
OI stable or down on further upside (less leverage dependence).
If that happens, I stand down on the short idea and reassess for continuation
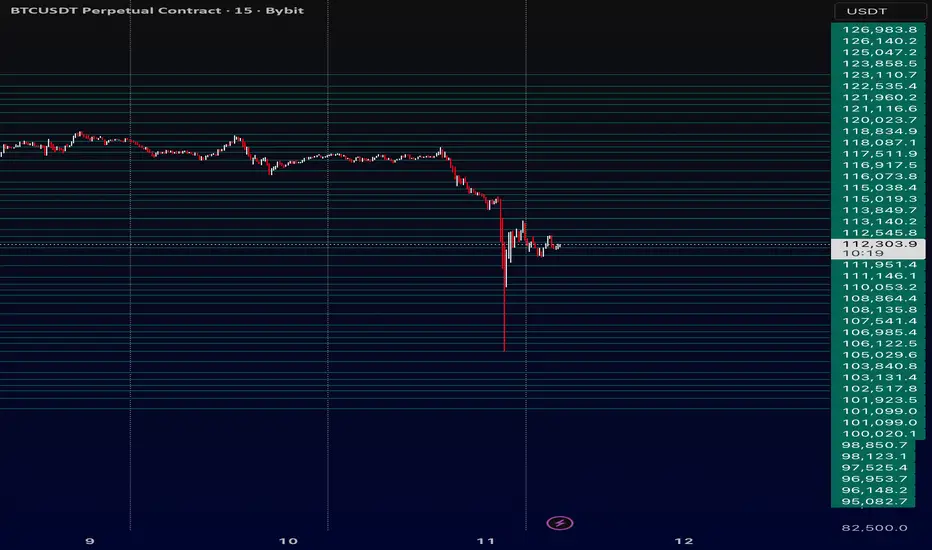
BTCToday, BINANCE:BTCUSDT.P dropped by around 17%. It may fall further, or it may not — but one thing I know for sure: market panic has always been my most profitable time. When fear dominates and the entire market is crashing, that’s when the best opportunities appear.
If you panic — you’re far from professionalism. If you enter, take your profit, and calmly move on — that’s a sign of skill. In trading, professionalism isn’t optional; without it, you won’t survive — and sometimes that’s quite literal.
So, in times like these — when some made quick profits, others took heavy losses, and only a few truly gained — I’ll share a thought that changed my mindset years ago. After losing a significant amount, I realized that was the true cost of the trading education I once wanted to buy.
Trade with minimal risk and invest the rest in your learning — it’s always the right investment.
And just to be clear — I don’t sell courses, and this message isn’t for profit.
It’s genuine advice. Have a great day.

DXY, EUR/USD, GBP/USD, and Bitcoin Daily Analysis for 09/10/2025Today episode i have simplify the next day bias and what to look out for in price. well explained and with high accuracy
