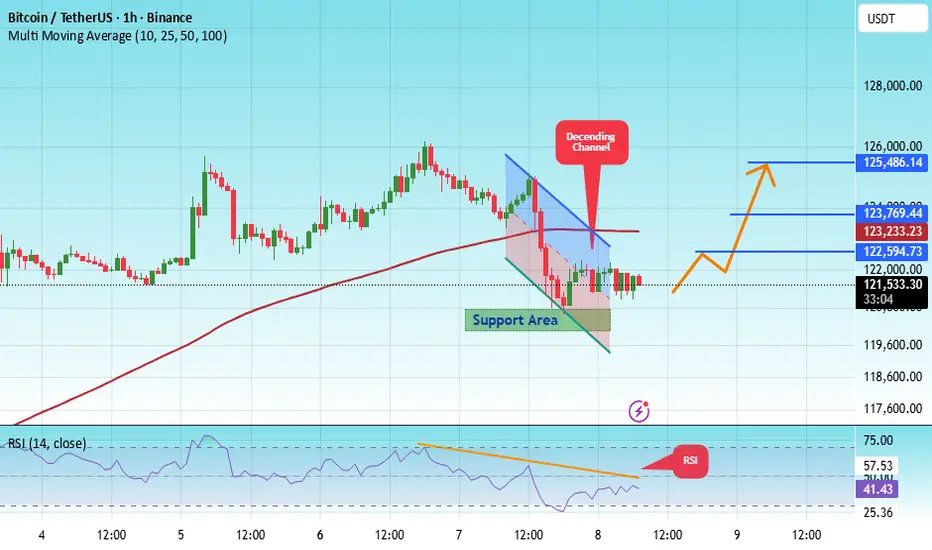
#BTC/USDT bounce from Support, Bullish Momentum Intact#BTC
The price is moving within a descending channel on the 1-hour frame, adhering well to it, and is heading for a strong breakout and retest.
We have a bearish trend on the RSI indicator that is about to be broken and retested, which supports the upward breakout.
There is a major support area in green at 120,500, which represents a strong support point.
We are heading for consolidation above the 100 moving average.
Entry price: 121,666.
First target: 122,600.
Second target: 123,770.
Third target: 125,480.
Don't forget a simple matter: capital management.
When you reach the first target, save some money and then change your stop-loss order to an entry order.
For inquiries, please leave a comment.
Thank you.
USDTBTC.P trade ideas
Bitcoin (BTC/USD) - Bullish Breakout Alert : Targeting $130k ?🚀 Bitcoin (BTC/USD) - Bullish Breakout Alert: Targeting $130K+ in October 2025! 🚀
Hello Traders! In today's chart, I’ve analyzed Bitcoin’s recent movements. As of October 8, 2025, BTC is trading above $123,500, showing an 8.6% surge last week. Following September’s 5.35% gain, the market is in a bullish mood, aligning with the historical "Pumptober" trend.
What to Watch on the Chart:
Double Bottom Pattern: Two troughs formed near $113,000, signaling a bullish reversal. The neckline resistance at $117,300 has been broken, with the next target at $122,000-$125,000.
Symmetrical Triangle Breakout: A breakout from a two-month descending channel has occurred, indicating a sharp upside move, potentially up to $138,000.
Moving Averages: Both the 50-day MA ($118K) and 200-day MA ($115K) are rising, providing strong support. RSI at 65 is in the bullish zone but not overbought.
Volume Trend: ETF inflows ($175M+ last month) and increasing institutional buying volume suggest sustainability, potentially pushing BTC to $130K-$135K.
Prediction: If $124K holds, the target by the end of October is $131,500 (6-8% upside). Worst case, support at $118K-$120K may be tested. Long-term: $150K+ is possible in 2025 due to ETF and halving effects.
Risk: A US government shutdown or macro volatility could lead to a 5-10% dip. Always DYOR and use stop-loss!
Share your thoughts in the comments – bullish or cautious? Like & share if helpful! 📈 #Bitcoin #BTC #CryptoAnalysis #TradingView

BTC 4 days up...4 hours downBTC volatility is off the rails. Took a bit of nudging to get up to these levels, and few short hours to be at the same spot! Take a closer look at the technicals, seems the drop was very purposeful and aggressive. IMHO there's a lot more TO GIVE here. Meaning, do not be surprised if this crosses 120k, then 110k and even 100k. Everything is super inflated and profit takers will shred BTC to pieces. Ultra signals helped here....
Best of luck

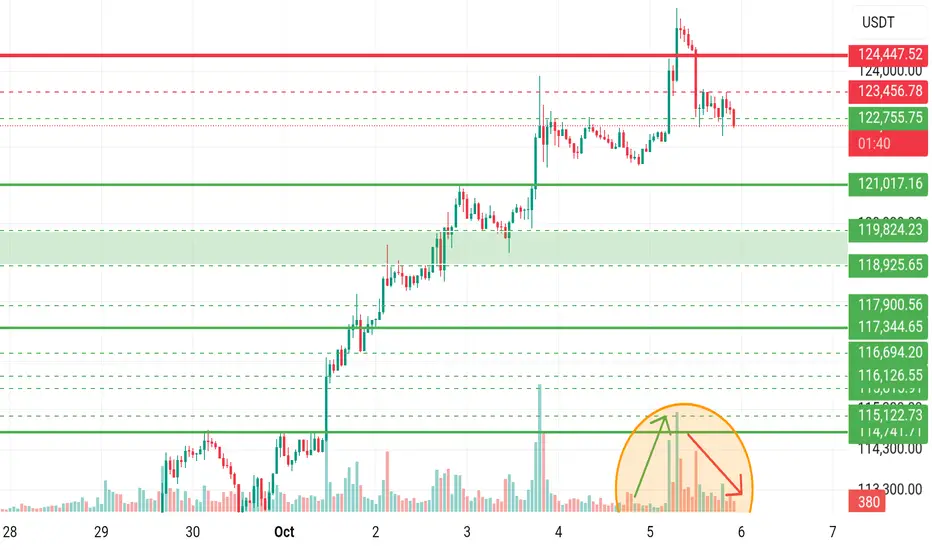
BTC at the Crossroads: Breakout or Breakdown? 📊 BTCUSDT Technical Analysis – 1-Hour Timeframe (Oct 5, 2025)
Created by FarshadRazaghi using TradingView
This 1-hour chart captures Bitcoin’s price action against Tether from September 29 to October 6. After a strong bullish rally reaching 124,447.32, BTC faced selling pressure and is now consolidating near the 121,017.16 support level.
🔻 Overall Trend
- From Sep 29 to Oct 5, BTC moved in a clear uptrend, breaking through multiple resistance zones.
- On Oct 5, price hit a peak at 124,447.32, followed by bearish candles and a noticeable drop in volume—indicating potential exhaustion.
🟩 Key Support Zones
- 119,824.23 and 118,925.65 have acted as strong support levels.
- If 121,017.16 fails to hold, price may decline toward 117,504.32 and possibly 115,122.73.
🟥 Resistance Zones
- The main resistance is at 123,456.78, which previously rejected upward momentum.
- A breakout above this level could lead to a retest of the 124,447.32 high.
📉 Volume Analysis
- A sharp drop in volume is observed near the top (highlighted in orange), suggesting weakening bullish momentum.
- Declining red volume bars may indicate a slow correction or sideways consolidation.
📈 Potential Scenarios
1. Bullish Case: Holding above 121K and breaking through 123,456 could trigger a move toward 124,447.
2. Bearish Case: Losing the 121K support may open the path to 119K and then 117K.
---
🧠 Conclusion:
BTCUSDT is at a critical decision point. Price behavior around the 121K support and 123K resistance will likely define the next move. Traders should monitor volume closely and wait for confirmation before entering positions. Risk management remains essential.
BTCUSD
🔎 Market context:
• Price swept the liquidity below support (~122,700) with long wicks.
• Instead of continuing lower, it quickly reclaimed the range → classic liquidity grab + absorption.
• This often signals a bullish reversa

$BTCUSDT Analysis - Oct 10 | 4H Time FrameBINANCE:BTCUSD Analysis - 4H
Hello and welcome to another analysis from the Satoshi Frame team!
I’m Abolfazl, and today we’re going to analyze Bitcoin on the 4-hour timeframe.
Bitcoin’s current all time high stands at $126,199!
Price has tapped into a demand zone, which could potentially trigger a bullish move toward this high.
This zone is worth the risk, and it’s recommended to look for buy positions on the 15-minute timeframe, targeting $130,000.
See you in the next analyses!
Stay tuned with the Satoshi Frame team...

BtcUsd - Decision Point SetupBTCUSDT is currently hovering around a key Decision Point, following a structure shift marked by a clear Change of Character (CHoCH) on the 1H timeframe. After the recent bullish correction during the Tokyo session, price is retesting the previous supply zone, which will decide the next directional move.
If price rejects from the Decision Point, we can expect a bearish continuation targeting the lower liquidity area around the Target Zone. However, a strong breakout and sustained momentum above this level could signal bullish intent, shifting market structure upward.
This area serves as a crucial confirmation zone for either continuation to the downside or reversal toward higher highs.

Bitcoin Consolidates Above Support — Main Trend IntactBitcoin (BTC/USDT) — Holding Strong Above Key Support Zones 💪
Bitcoin continues to trade above the low-timeframe support at $122,100, showing resilience and consolidation after its recent upward move.
✅ Low Time Frame Support ($122.1K): BTC remains stable above this short-term structure, suggesting buyers are still in control.
✅ Main Trend Support ($110.2K): The larger bullish structure remains intact as long as price holds above the $110.2K region.
📈 Momentum Outlook: A sustained hold above $122K could set up another push toward $126K–$130K, confirming bullish continuation.
Summary:
BTC remains bullish above both its low-timeframe and main-trend levels. Short-term consolidation is healthy, and the next breakout could target new local highs if momentum strengthens.
🎯 Support: $122.1K / $110.2K
🎯 Resistance: $126K / $130K
📊 Bias: Bullish continuation

BTC 1H Analysis - Key Triggers Ahead | Day 52☃️ Welcome to the cryptos winter , I hope you’ve started your day well.
⏰ We’re analyzing BTC on the 1-Hour timeframe .
👀 On the 1-hour timeframe, Bitcoin has broken through all major resistance levels, setting a new ATH, and then experienced a 2% price drop due to profit-taking and FOMO-driven selling. It then moved toward its key support zone around $122,584, bounced from there, and is now moving toward its early trigger zone at $124,113.
🧮 The RSI oscillator shows two important levels — 63 and 45 — and once the volatility threshold crosses especially above 63, Bitcoin could see a sharp increase in volatility, activating its triggers and enabling breakout moves.
🕯 Bitcoin’s volume has decreased after each touch of resistance, but now with a noticeable volume increase, our early trigger could become active, allowing Bitcoin to form larger, high-volume candles either upward or downward. Since the high-wave cycle remains bullish, the current scenario still favors upside continuation and resistance breakouts.
🧠 For Bitcoin positions, it’s better to wait for all confirmations to align — including activation of the early trigger, an RSI breakout above 63, and rising buy volume — before opening a long position.
❤️ Disclaimer : This analysis is purely based on my personal opinion and I only trade if the stated triggers are activated .

The market move was no surpriseIf you know how markets work, you'll see that this market move was no surprise.
Just knowing what correct market structure looks like and how to place a Gann Tool could help your trading tremendously

BTC/USDT Analysis. Moving Within the Scenario
Hello everyone! This is the trader-analyst from CryptoRobotics, and here’s your daily analysis.
Yesterday, Bitcoin followed the primary scenario, entering a correction almost immediately after the post was published. Just $200 short of the $120,400–$119,400 (absorption of selling) zone, we saw clear signs of buy-side defense and noticeable absorption of selling pressure on delta.
At the moment, the shorts remain the priority until the buyer’s zone is tested. If strong protection appears at that level, the initial upside potential is around $124,000.
Buy zones:
• $120,400–$119,400 (selling absorption)
• $116,700–$115,000 (pushing volumes, strong graphical imbalance)
• $112,500–$111,500 (mirror zone, volume anomalies)
• $110,000–$108,800 (strong selling absorption)
This publication does not constitute financial advice.

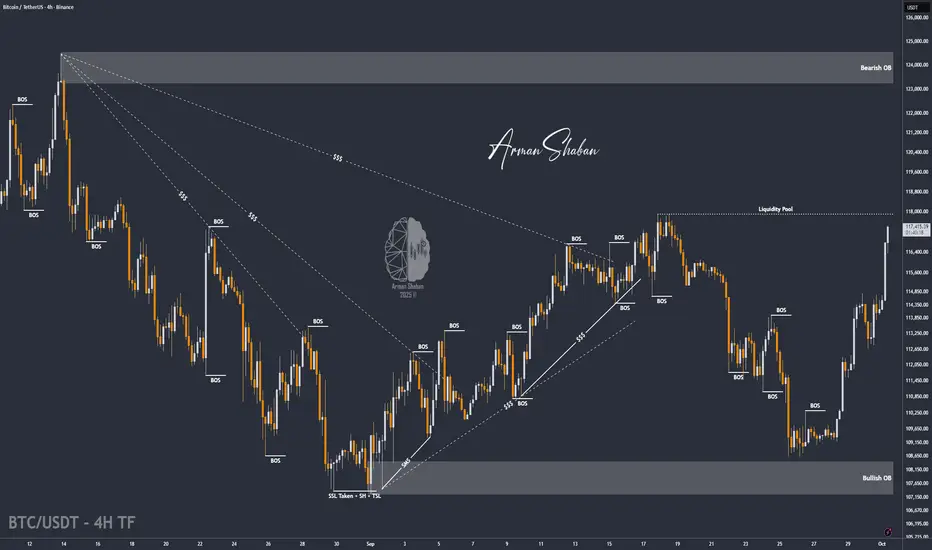
BTC/USDT | BTC Rally +7% Gains – Bulls Still in Control (READ)By analyzing the Bitcoin chart on the 4-hour timeframe, we can see that the price continued its rally as expected, hitting the $115K target and now reaching up to $117,200, just one step away from the next target at $118K. So far, this analysis has delivered more than 7% gains. I hope you made the most out of it!
Please support me with your likes and comments to motivate me to share more analysis with you and share your opinion about the possible trend of this chart with me !
Best Regards , Arman Shaban
TradeCityPro | Bitcoin Daily Analysis #184👋 Welcome to TradeCity Pro!
Let's go over the Bitcoin analysis. Yesterday, the price got rejected from a resistance zone, and today, it has started a corrective downward movement. Let's review the market together.
⏳ 1-Hour Timeframe
Yesterday, after the price reached the resistance zone, I mentioned that if the RSI exits the Overbuy zone, we could take profits.
📊 This is exactly what happened. After the price was rejected from the zone, the RSI moved out of the Overbuy zone and started heading downward.
⭐ Currently, the price correction has continued towards the 0.382 Fibonacci level. The trading volume during this correction has not decreased, which indicates that sellers are still active in the market, and their trading volume is not significantly lower than buyers.
🎲 If the price continues its correction and the volume increases at the same rate, the likelihood of a trend reversal and the start of a new downward trend becomes much higher. However, if the volume decreases simultaneously with the correction, the range between the 0.5 and 0.618 Fibonacci levels will be a very important support zone, and the price could find support there.
🔼 For a long position, the trigger we currently have is the breakout of the resistance zone. If we wait for the price to touch this zone a few more times, we can draw the exact numbers for the range and open our position upon its breakout.
⚡️ For a short position, it's better to wait and get confirmation of a bearish trend before looking for triggers. We will confirm the bearish trend if the selling volume increases and lower highs and lows are made.
❌ Disclaimer ❌
Trading futures is highly risky and dangerous. If you're not an expert, these triggers may not be suitable for you. You should first learn risk and capital management. You can also use the educational content from this channel.
Finally, these triggers reflect my personal opinions on price action, and the market may move completely against this analysis. So, do your own research before opening any position.
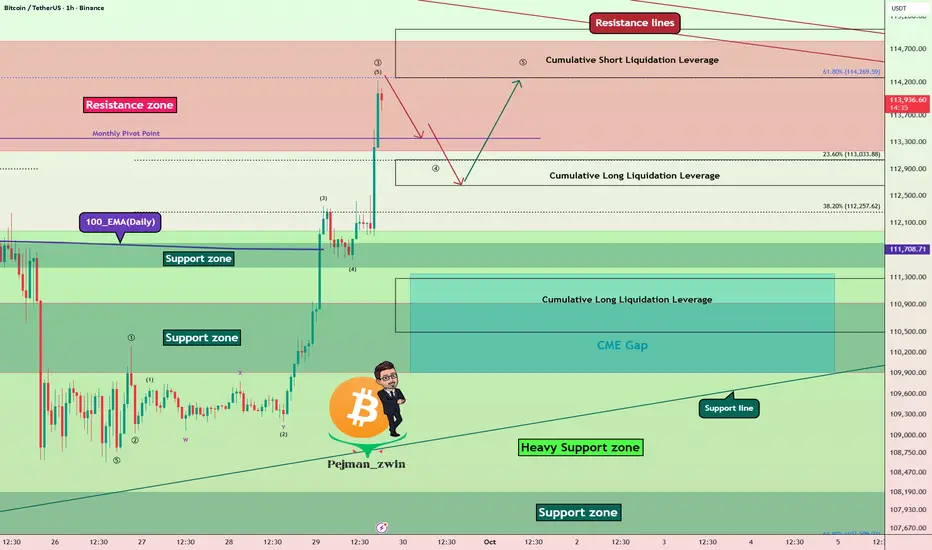
Bitcoin Resistance Zone Battle – ATH or Fakeout?Bitcoin ( BINANCE:BTCUSDT ) has shown strong momentum over the past 5 days , liquidating many traders in both Long and Short positions .
Bitcoin has now entered the Resistance zone($114,820-$113,170) and is moving near the Cumulative Short Liquidation Leverage($115,000-$114,272) and Resistance lines .
From an Elliott Wave Theory perspective, given Bitcoin’s strong bullish momentum over the past 24 hours, it appears to be completing Wave 3. This Wave 3 seems to be of the extended type.
I expect Bitcoin , after a correction , to make another attempt toward the Resistance zone($114,820-$113,170) and potentially test the Resistance lines .
Do you think this bullish move could lead to a new all-time high (ATH) for Bitcoin?
Cumulative Long Liquidation Leverage($113,037-$112,650) + Near Monthly Pivot Point($113,356): An area where Bitcoin could start rising again (if there is a correction, of course).
Cumulative Long Liquidation Leverage: $111,100-$110,500
CME Gap: $111,355-$109,915
Note: Also, Bitcoin approaching the 61.8% golden Fibonacci level could lead to a Bitcoin correction.
Please respect each other's ideas and express them politely if you agree or disagree.
Bitcoin Analysis (BTCUSDT), 1-hour time frame.
Be sure to follow the updated ideas.
Do not forget to put a Stop loss for your positions (For every position you want to open).
Please follow your strategy and updates; this is just my Idea, and I will gladly see your ideas in this post.
Please do not forget the ✅' like'✅ button 🙏😊 & Share it with your friends; thanks, and Trade safe.
BTCUSDT: Potential Reversal at Key Support👋Hello everyone, what do you think about the trend of BINANCE:BTCUSDT ?
Bitcoin is currently undergoing a short-term correction after forming a peak above $114,500. The price is now heading toward a key support zone around $110,000, which is also seen as an important confluence zone.
If Bitcoin stabilizes here and confirms the support level, we could see another potential bounce, pushing it back towards previous resistance levels. Pay attention to the possibility of a price reversal from this support zone, as it might create a buying opportunity.
What do you think about BTCUSDT? Let me know your thoughts in the comments below!
Good luck!

Bitcoin Roars Above $120K, ATH on the RadarBitcoin just blasted through resistance and is charging straight toward its all-time high.
The beast is alive and moving with power. 🚀
#PEACE

The day will come which No one would believe BTC towards 222222Here I am expressing my Thought about BTC
if we look at the Previous Data
( TOP 10540 LOW 3621)
(LOW 3621 TOP 69198)
(TOP 69198 LOW 15443)
(LOW 15443 TOP would be 222222) by March 2026
From there we would be having two year downtrend and the LOW would be $76000 around December January 2028.
Those who believe and know this assets from the beginning they will certainly believe this possibilities .
This is not a financial advice so take your decision on your own
However everything is Possible in this world as more and more institutions are getting into it and everyday the tech is improving.
Remember me if this wild Prediction is going to be True.
Thanks,

Forecast for BTCUSDT 9th October 2026 (Updated)Forecast for BTC for the next 4 weeks. Quick decline to $120k followed by a bounce to ~$127k followed by continuation down to ~$104k for a bottoming before new all-time-high towards ~$150k-$170k.

BTC - All Important Trendlines and Liquidity ZonesAs of the current Bitcoin trend, I have outlined 3 key trendlines as well as the two major liquidity zones we need to keep an eye on right now.
The "Upper Resistance Trendline" has so far marked our three recent all time highs (red arrows). This has been a series of higher highs, which is normally a good sign in a bull market, the only problem is we are started to see some early signs of bearish divergence.
The "Middle Trendline" has acted as a key level mainly for the candle bodies. It has been a support/resistance flip level, but may have confluence in the future.
The "Lower Support Trendline" has acted as our three recent lows. It has helped to create a series of higher lows which is a good sign in an uptrend. The trend needs to maintain this series of higher lows, once we see the confirmation of this trend broken, the bear market will have begun.
Now let's focus on the two main liquidity zones right now.
The first is our "Important Liquidity Zone". This represents all the resistance that was built up from July-August 2025. Ideally, for this uptrend to continue to make new higher highs, this important liquidity zone is a crucial area to hold as a new support level. It ranges from $119.3k-$120.4k. A flip of this zone into new support would indicate that Bitcoin is ready for new all time highs. That is the first thing to watch for.
However, the "Middle Liquidity Zone" represents the $116k-$118k level. This level marked many support/resistance levels for our current trend. Therefore, if our main liquidity zone is breached this could come in confluence with our middle trendline.

BTC; Aiming For A New (ATH) At $140k ?Bitcoin is set to break this resistance level and scale toward $140k before the year end. it have been moving within this momentum region of $109k-$123k for this couple of weeks, which we experienced a new ATH at $126k this week.
However according this structure our SMA 80 and SMA 200 the chances of this new ATH clearly high, also the "uptober" psychology actually nails the current market movement.
My fellow traders and investors do think we would see a plane climb to $140k by December..?
Like and share your thoughts
Thanks for reading.

Bitcoin - Key support $105 - 107k Buyers Should step inBitcoin - Key support $105 - 107k Buyers Should step in or up trend is over
best confirmation for me Open interest absorption

BTC Bullish Targets 150k & beyond
Since downward manipulation/support testing leg in April of this year, BTC had shown strength and crossed Weekly swing high.
Targets from that manipulation leg have reached halfway already, and now looking forward to 4th deviation.
2nd dev= $117,340 upto $124,480
4th dev = $145,900 upto 153,000
chart also shows potential targets in case we go higher. upto 190k and 243k.

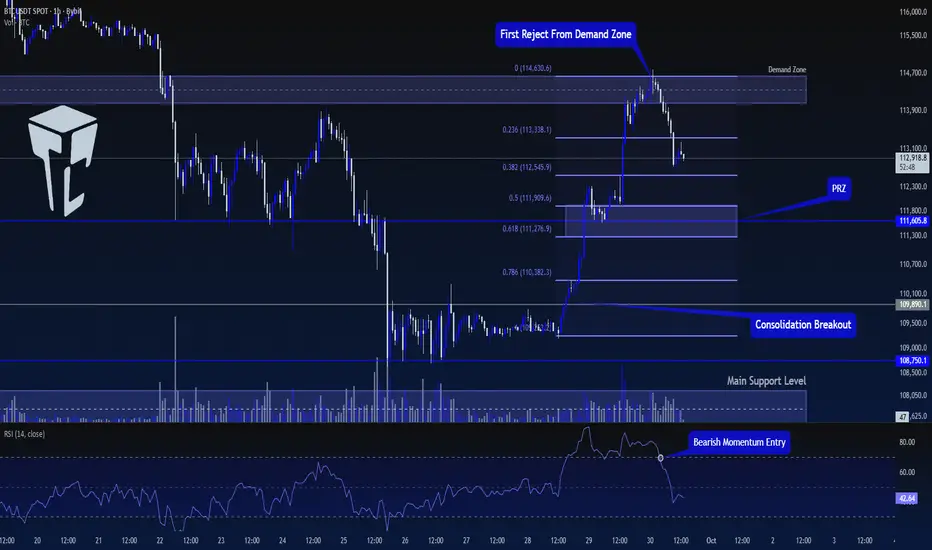
TradeCityPro | Bitcoin Daily Analysis #183👋 Welcome to TradeCity Pro!
Let's dive into today's Bitcoin analysis. The market has had an upward movement. Let's see what's ahead in the market.
⏳ 1-Hour Timeframe
Yesterday, I mentioned that there was a high probability of movement and that it would be a good idea to keep an eye on the chart during the New York session as the market could move.
📊 With the start of the New York session, good buying volume entered the market, and after breaking 109890, Bitcoin started an upward wave.
🔑 The first area where the price could have faced resistance was 111605, which was broken on the first attempt. After a pullback, the next leg started.
🚀 The break of 109890, along with RSI entering Overbuy and the entry of buying volume, was a good trigger for a long position, and we could have opened a position with it.
⭐ Now, the price has reached a very important resistance zone, and the probability of a correction starting is high. For taking profit, I suggest you lock in profits whenever RSI exits the Overbuy zone, as this will reduce the upward momentum and increase the chances of a correction.
📈 For new positions, no triggers are available yet, and it's better to wait until the market gives us a clearer structure. However, if the price reacts several times to the level, we can open a long position in subsequent attempts if it breaks.
❌ Disclaimer ❌
Trading futures is highly risky and dangerous. If you're not an expert, these triggers may not be suitable for you. You should first learn risk and capital management. You can also use the educational content from this channel.
Finally, these triggers reflect my personal opinions on price action, and the market may move completely against this analysis. So, do your own research before opening any position.
