Long the king, and short the "Sol" Jack ?Being long Bitcoin is being long on a healthy market rally with BTC.D bouncing, and therefore Bitcoin leading.
If BTC.D bouncing means an overall retrace on the market, I think Sol makes a good candidate for a short position to target 150s
I think the DATs and the ETF narratives are getting pretty exhausted, and that could make an extra argument, even if this is the part where it gets tricky (timing tops is hard).
Still, i think playing this with 30/40% of the Bitcoin long is EV+
Game on!
USDTSOL.P trade ideas


[SeoVereign] SOLANA BEARISH Outlook – October, 03 2025The basis for presenting a bearish perspective in this idea is that an arbitrary wave m has formed a 1:1 length ratio with another wave n.
In addition, the Crab pattern at the 1.618 level has also been fully confirmed, further supporting the possibility of additional downside.
Accordingly, the average target price is set around 212.94 USDT.
Additional briefings will continue to be updated in this idea as the chart develops.


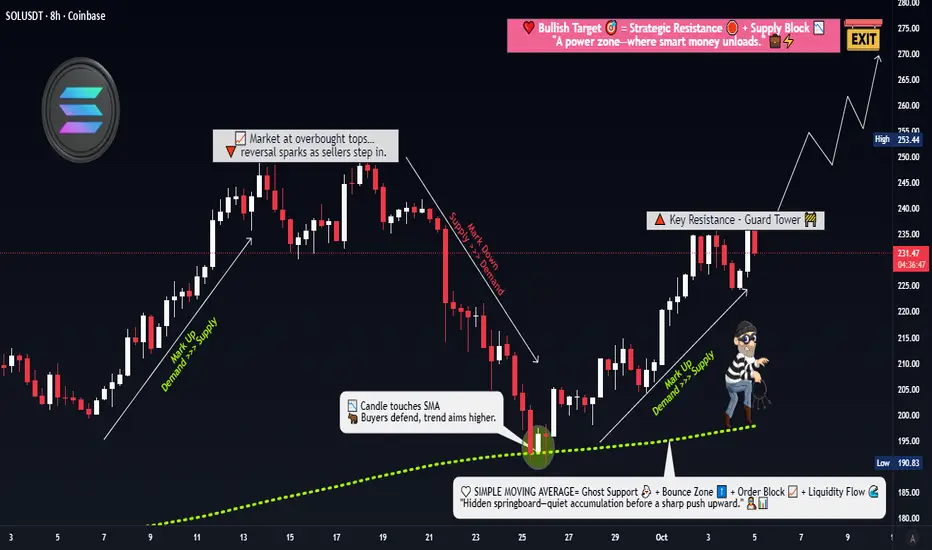
Is Solana Ready for a Technical Breakout or Just a Fake Pump?🎯 SOL/USDT Wealth Strategy Map | The Gentleman Thief's Playbook 💎
📊 Market Overview
Asset: SOLANA/USDT (SOL/USDT)
Trading Style: Swing/Day Trade Hybrid
Market Sentiment: Bullish Pending Breakout Setup 🚀
🎭 The Setup (As Told by a Professional Thief)
Dear Ladies & Gentlemen, gather 'round for today's calculated heist...
🔓 The Entry Plan
Breakout Zone: $240
Entry Strategy: ANY price level AFTER confirmed breakout above $240
💡 Why this matters: We're watching for resistance to crack like a vault door. Once $240 breaks with volume, the path to riches opens.
🛡️ Risk Management (The Thief's Insurance Policy)
Stop Loss: $220
⚠️ Important Notice: This is my thief-style SL, but YOU are the master of your own vault. Set your risk tolerance based on YOUR capital and comfort level. Make money, take money — at your own calculated risk.
🎯 Profit Targets (Where We Cash Out)
Primary Target: $270 (Our recommended exit)
Technical Target: $280 (Strong resistance + overbought territory + potential trap zone)
📌 Strategic Exit Reasoning:
$270 offers a clean 12.5% gain from breakout
$280 presents multiple bearish factors: strong resistance, overbought conditions, and classic bull trap setup
Smart thieves escape with profits before the alarm sounds 🚨
⚠️ Important Notice: This is my thief-style TP, but only YOU can decide when to take profits. Your money, your rules, your risk.
🔍 Technical Analysis Deep Dive
Key Levels to Watch:
Resistance: $240 (current), $270 (target), $280 (danger zone)
Support: $220 (our safety net)
The Correlation Play 📈
Related Pairs to Monitor:
CRYPTOCAP:BTC (Bitcoin) - The market's king affects all. If BTC pumps, SOL typically follows with 1.5x volatility
CRYPTOCAP:ETH (Ethereum) - Direct competitor in smart contracts; inverse correlation on capital rotation
CRYPTOCAP:AVAX (Avalanche) - Similar L1 narrative; watch for sector rotation signals
SEED_DONKEYDAN_MARKET_CAP:MATIC (Polygon) - L2 competitor; check for broader altcoin momentum
💡 Correlation Strategy: If BTC holds above $65K while ETH consolidates, SOL historically outperforms due to capital flow seeking higher beta plays.
⚡ The Gentleman Thief's Trading Philosophy
This isn't gambling — it's calculated robbery from the market's inefficiencies. We enter with precision, manage risk like professionals, and exit before greed becomes our enemy.
Remember:
✅ Breakouts need volume confirmation
✅ Risk management is non-negotiable
✅ Profits aren't real until you take them
✅ The market doesn't care about your feelin
📢 Community Engagement
✨ "If you find value in my analysis, a 👍 and 🚀 boost is much appreciated — it helps me share more setups with the community!"
⚖️ Legal Disclaimer
IMPORTANT: This is a "thief-style" trading strategy shared purely for educational and entertainment purposes. This is NOT financial advice. Trading cryptocurrencies involves substantial risk of loss. Past performance does not guarantee future results.
You are solely responsible for your own trading decisions. Always:
Do your own research (DYOR)
Never invest more than you can afford to lose
Understand the risks before trading
Consider your personal financial situation
The author is not a registered financial advisor and assumes no liability for your trading outcomes.
Trade safe, steal smart, exit elegant. 🎩💰
#SOLUSDT #Solana #CryptoTrading #SwingTrading #DayTrading #TradingStrategy #Breakout #TechnicalAnalysis #CryptoSignals #AltcoinSeason #SOL #USDT #CryptoAnalysis #TradingView #PriceAction #CryptoChart #BullishSetup
SOLGetting ready to ride
We saw a big pump on crypto following BTC rise and we are slowing down
If I get this then I'm riding sol all the way
Let's see how BTC plays out
Solana rising wedge tests trendline support ahead of macro catalStructure: After a strong multi‑month rally, SOL is coiling in a rising wedge. The price sits above a key ascending trendline but below a descending resistance line from its recent peak.
Momentum: Moving averages are converging and volume has tapered off, suggesting momentum is slowing.
Key triggers: A clear breakout above the descending resistance would signal renewed strength; a breakdown through the trendline could extend the pullback toward lower support.
Risk factors: Macro events—non‑farm payrolls, the monthly inflation report, and the late‑October Fed meeting—may trigger volatility across markets.
Trade idea:
Bullish: Wait for a daily close and retest above the wedge; use stops below the recent swing low; aim for the next major resistance zone.
Bearish: Watch for a close below the ascending trendline; short a retest of that level with stops above; target the next demand area.
Reminder: Manage risk carefully and adapt as market conditions evolve.
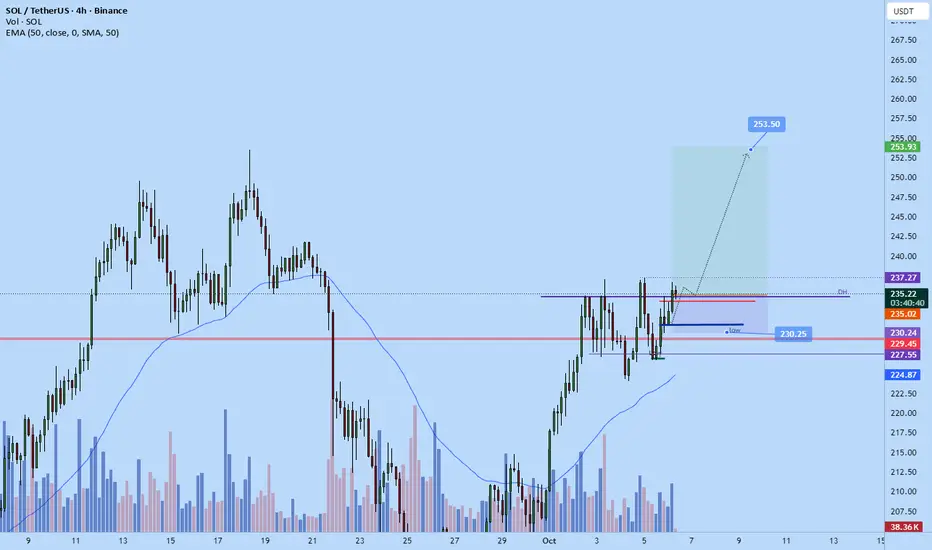
solana swing long back to ATHOpened up a swing long position a while ago on solana. Slowing down on the intraday trades and scalps for now as the market been getting too volatile for me.
Sl: 230.25
Exit limit order set to : $253.5
Roughly 4RR from current entry.
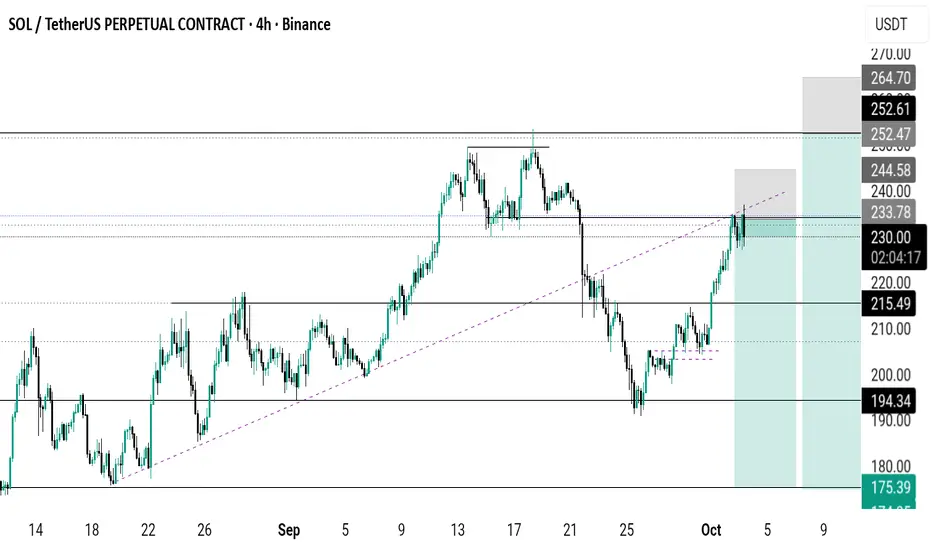
DeGRAM | SOLUSD fixed above the $200📊 Technical Analysis
● SOL/USD rebounded from the $200 key level and the ascending channel’s support, rejecting a deeper correction.
● The structure suggests upside continuation, with $230 and $250 as targets, while the $200 demand zone remains critical support.
💡 Fundamental Analysis
● Solana’s growing DeFi activity and NFT volume support bullish sentiment, while broader crypto recovery improves risk appetite.
✨ Summary
SOL/USD holds above $200 support, eyeing $230–$250 on renewed momentum. Break below $200 invalidates the bullish scenario.
-------------------
Share your opinion in the comments and support the idea with a like. Thanks for your support!

SOL Long Alert 1hTimeframe 1h Direction Long waiting retracement, confluence with imbalances & fibbonaci golden ratio, waiting for rejection candle (Bullish Engulfing/Green Hammer) to continuing the bullish trend,
SOL Bullish Momentum Weakening – CMF Shows Bearish DivergenceSOL’s recent rally could be at risk as the Chaikin Money Flow (CMF) shows signs of weakening. Currently at 0.03 and trending lower, the CMF is below the zero line, signaling reduced capital inflow despite rising prices.
The CMF measures money movement into and out of an asset. When it turns negative while the price continues to climb, it forms a bearish divergence, suggesting that liquidity is weakening.
This pattern indicates that although buyers are still pushing SOL higher, the declining inflow of capital may set the stage for a potential reversal in the near term.

Solana SOL price analysis📞 Rumor has it that as soon as the global geopolitics reach a “temporary lull”, the following ETFs will be launched
Solana ETF is the most likely to be the next one (but there are at least 2 coins more on the list, which we will talk about in the coming days)
🪙 So, are you ready to buy CRYPTOCAP:SOL in your investment portfolio? For example, in the range of $117-123
🤖 Maybe we need to launch a long trading bot OKX:SOLUSDT so that it can buy in micro portions on the current possible price correction to get a “tasty price” as a result
◆ Would you like to join such a trading bot and copy them?
◆ And then compare the results with all “ETF candidates”
_____________________
Did you like our analysis? Leave a comment, like, and follow to get more

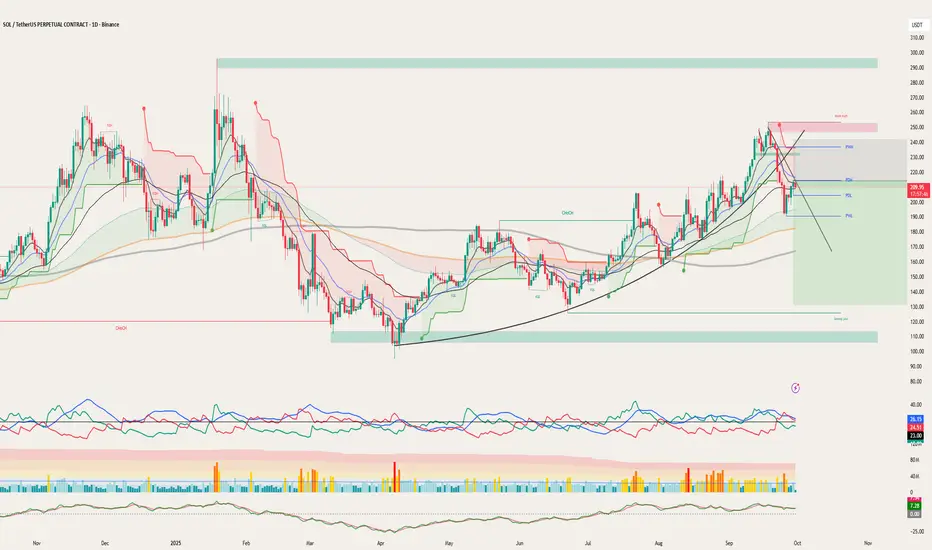
Sol market snapshotIf SOL cannot break above 245, there is a chance of forming a reversal pattern — Head and Shoulders (H&S). The right shoulder should not exceed the head.
Main conditions of the Head and Shoulders pattern:
Three peaks:
Left shoulder — the first local peak formed after the price rises.
Head — a higher peak following the left shoulder.
Right shoulder — a peak approximately at the same level as the left shoulder, formed after the decline from the head.
Neckline:
Connects the lows between the left shoulder and the head, and then between the head and the right shoulder.
The neckline can be horizontal or slightly sloping.
A break below the neckline confirms the pattern and signals a potential price decline.
Volume:
Volume is often high at the left shoulder, may be higher or lower at the head, and usually decreases at the right shoulder.
Declining volume during the formation of the right shoulder strengthens the bearish reversal signal.
Movement after the breakout:
After breaking the neckline, the price is expected to fall approximately the same distance as from the neckline to the head’s peak.

#SOLUSDT: A Big Move In Making Crypto Market Is BullishCrypto market remain bullish and as for the SOLANA we remain quite optimistic; currently price is trading at critical level and waiting for liquidity to emerge. We need strong volume for big price movement. Follow a strict risk management while trading crypto market.
Good luck and trade safe.
Team Setupsfx
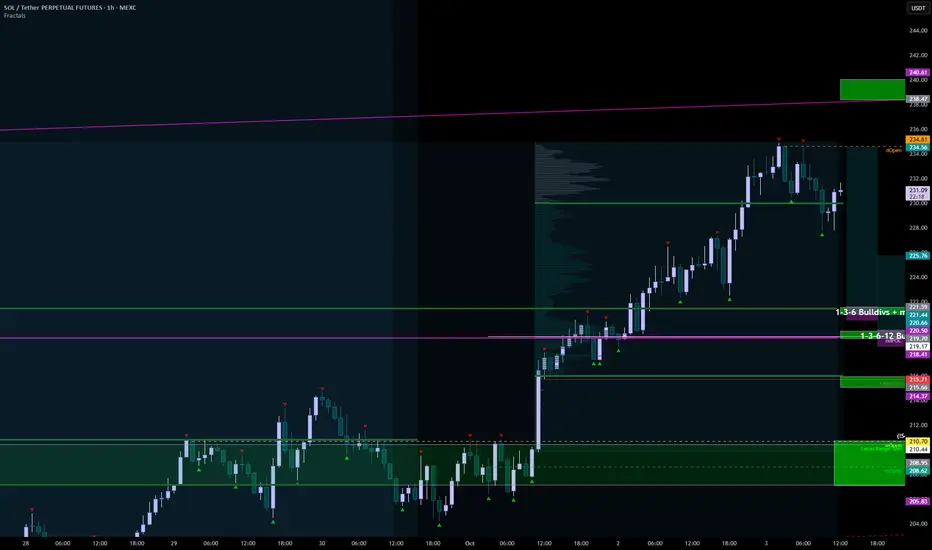
SOL 03.10At 3 AM (when else, only when we're sleeping) R1 reacted, with weakness in beardivs + mfd divs 1-3-6-12-24m, and corrected by 3%.
BUT
1) they left almost equivalent positions,
2) the daily session closed almost without a shadow above,
3) there are no diversifiers on the indicator, and there are fat mfds on mfd 1h and higher.
I think we'll go to 240, but there's a slight correction right now. At 240, it will be possible to part-take profit from the main long from 192. But how and when we'll get there is unclear. If Bitcoin starts to move into the 117-115 zones today within the console, Salt could even move from the current levels to the key support zone around 210, but for now, it needs to lose another 220 and 216 to do so.
Support zones:
221-221.5
219-219.6
215-215.9
207-210.7
Resistance zones:
238.4-240
255-256.4
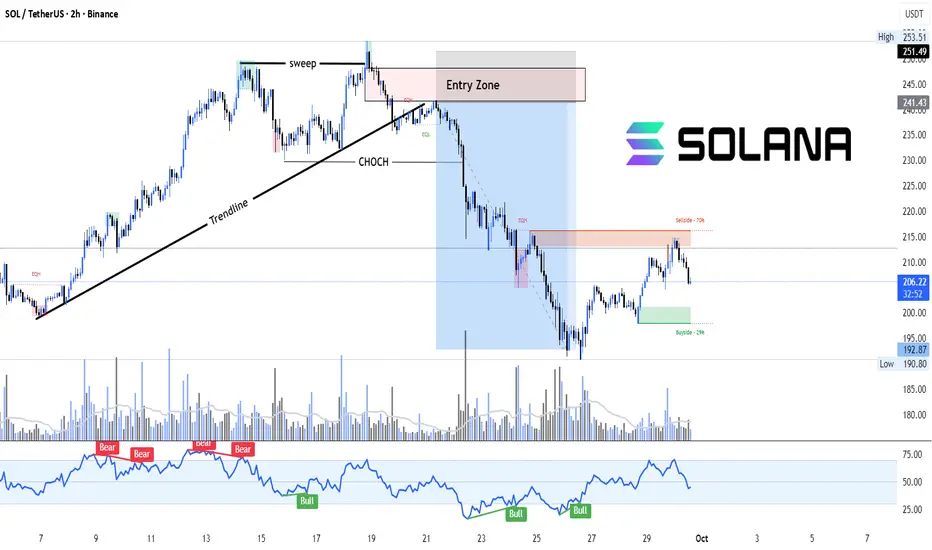
SOL: From Sweep to Selloff – Supply in ControlSolana (SOL/USDT) recently broke below a strong trendline after a liquidity sweep and clear Change of Character (CHOCH). Price retested the supply zone (Entry Zone) before continuing its downward move, showing a classic bearish market structure shift.
Currently, price is reacting from a sell-side zone (~70% retracement), with potential downside targets toward the buy-side liquidity (~29% retracement). RSI also reflects bearish divergence confirmation from the highs, aligning with the structural shift.
Key Highlights:
Engulfing candle + Trendline break + CHOCH confirmed bearish bias.
Entry Zone retest offered high-probability short setups.
Current rejection from supply signals further downside.
RSI divergence strengthens bearish case.
SOLANA LONG SETUP Liquidity Run: BTC & ETH swept lows to take out stops.
SMT Divergence: SOL held strong while majors dipped → bullish imbalance.
Bullish Order Block (OB): Price is rejecting from a demand zone after the SMT confirmation.
Fair Value Gap (FVG): Above current price, likely to be rebalanced as SOL seeks higher prices.
🎯 Bias: Bullish on SOL
Entry: Off the OB rejection after SMT confirmation
Target: 240+ (premium array)
Invalidation: Below 228 (sell-side liquidity)

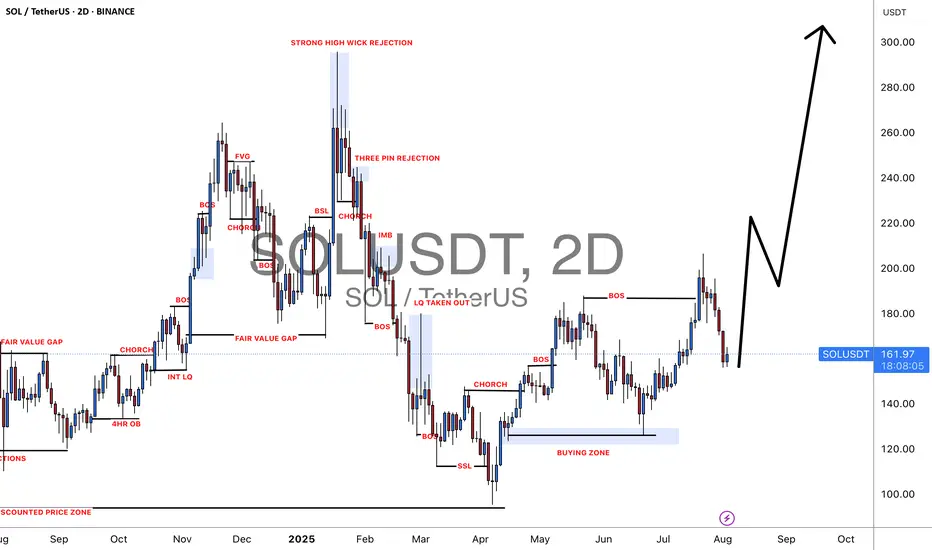
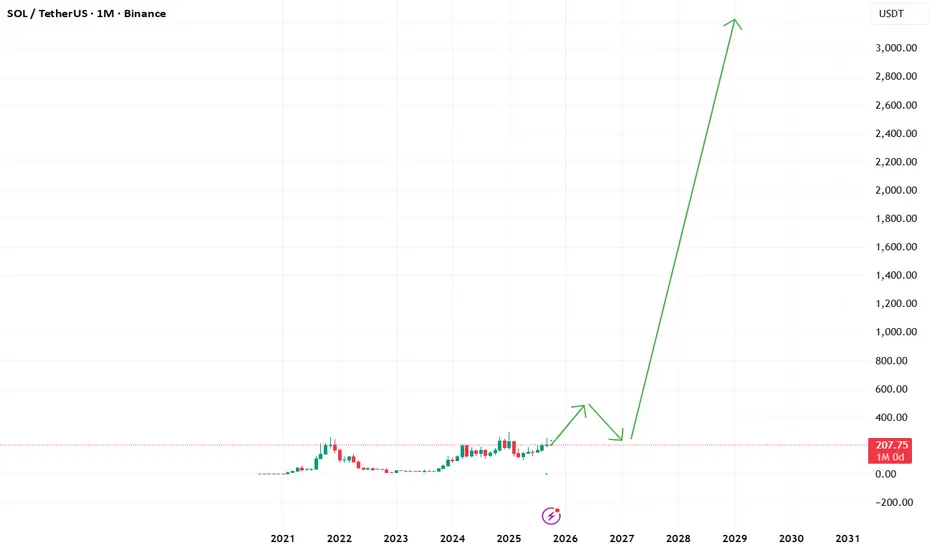
Solana ready to break into new highsSolana- the most used crypto (90% of all blockchain activity! ) , which is already and going to be the future of all crypto starting from tokenized stocks till endless usecases, is about to break into new highs.
I expected SOL to be number 2 after bitcoin in terms of marketcap.
SOLUSDTSOLUSDT
I expect the price to go to 250 zone, the latest hh and if the price is not making a new hh then i expect the price to go down to 212 zone and bounce from there if the support stay.

SOULTOBER - Can SOL get ATH?Likely not now when I am posting the charts, - observe it clear, Small scalps to the top as mentioned as always

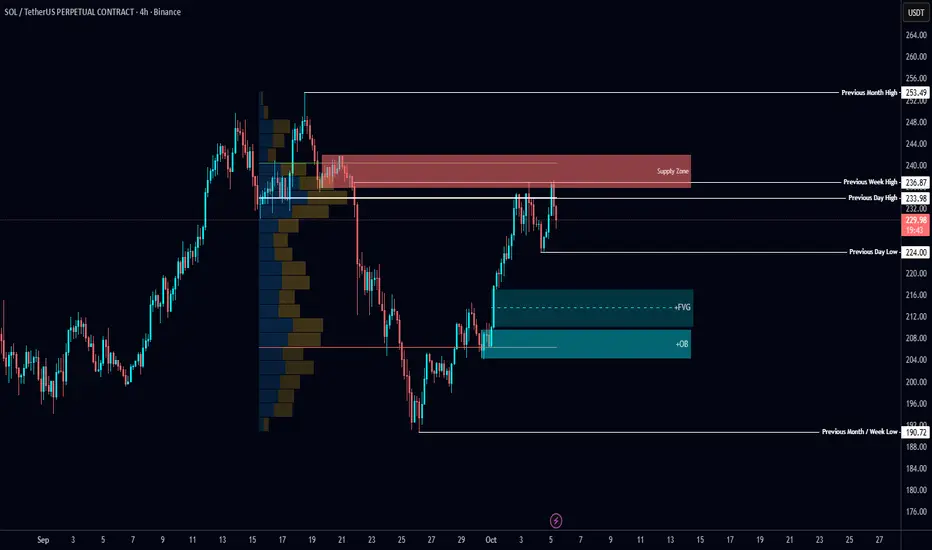
$SOL Analysis🚨 CRYPTOCAP:SOL Analysis 🚨
CRYPTOCAP:SOL tapped the Supply Zone and swept previous week’s high for liquidity 👀
Now trading below POC.
⚡ If this flips, an easy path opens to the previous month’s high.
📉 Otherwise, I’ll wait for confirmation to short and target bullish OB + FVG levels below.
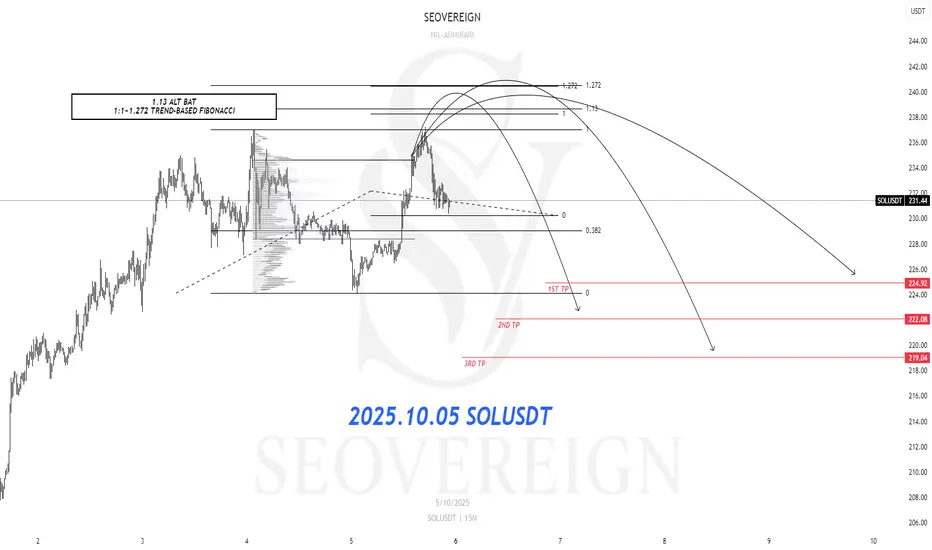
[SeoVereign] SOLANA BEARISH Outlook – October 05, 2025Hello everyone.
I hope you are all having a peaceful day.
Today, I am writing to share my short position perspective on Solana as of October 5th.
The first basis is the 1.13 Alternate Bat (ALT BAT). The Alternate Bat is a variation of the harmonic pattern established by Scott Carney, and its core principle lies in defining the PRZ (Potential Reversal Zone) where point D is located at 1.13 times the XA leg (=1.13XA). The convergence of these ratios creates a relatively narrow and reliable retracement (or reversal) zone, so when D is positioned around 1.13XA, it is necessary to carefully observe the potential for a short- or mid-term reversal.
The second basis is that an arbitrary wave N forms a 1:1 length ratio with another arbitrary wave M. Among Fibonacci ratios, 1:1 is one of the representative standards used in Elliott Wave and harmonic analyses for measuring wave length and retracement. When one wave exhibits approximately a 1:1 length with another, that point tends to act as a natural retracement or termination zone, and the reliability increases especially when it overlaps with other technical grounds.
Accordingly, the average target price is set around 222 USDT.
As the chart movement unfolds, I will provide updates on position management through revisions to this idea.
Thank you for reading.
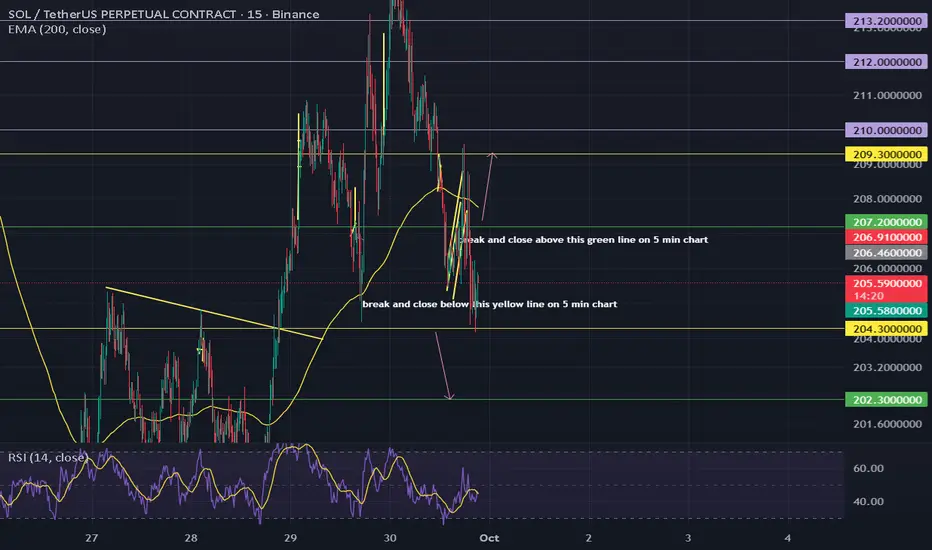
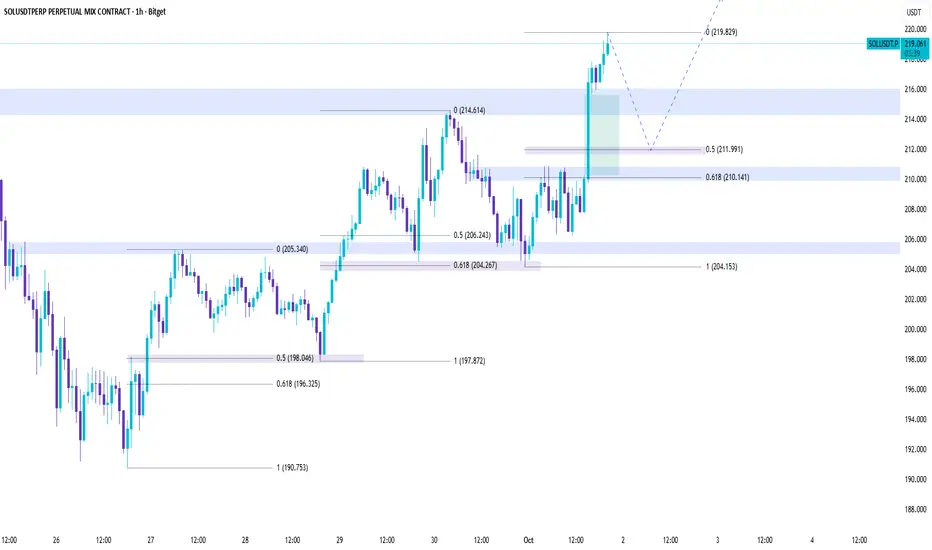
scalp your soulWait for the trigger. Do not pre-empt the breakout. The market is currently consolidating and chopping. The 1% move becomes "almost 100% certain" (in trading terms, meaning highest probability) only once one of these channel boundaries breaks on high volume.
Monitor Open Interest and Funding Rates as the move begins. A sharp drop on the short entry or a significant rise on the long entry will confirm the leveraged market is participating in the move.