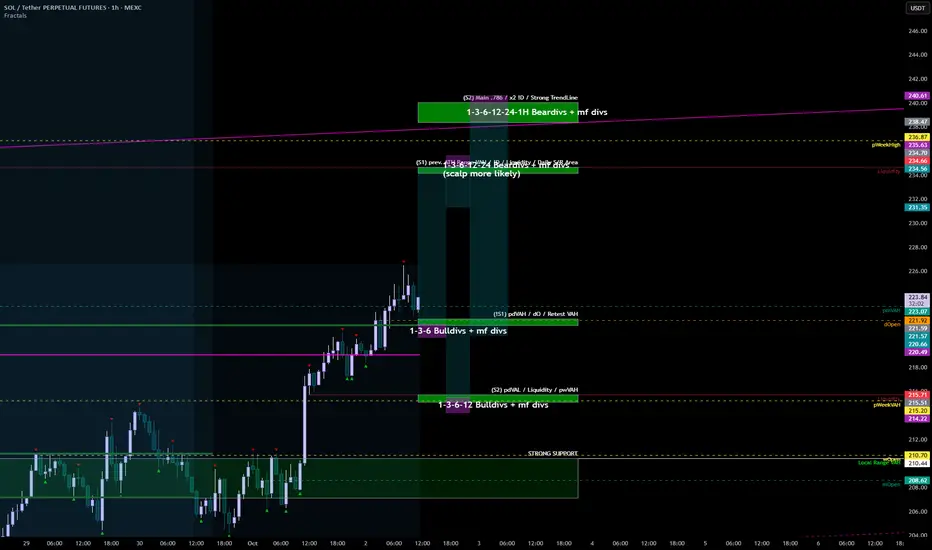
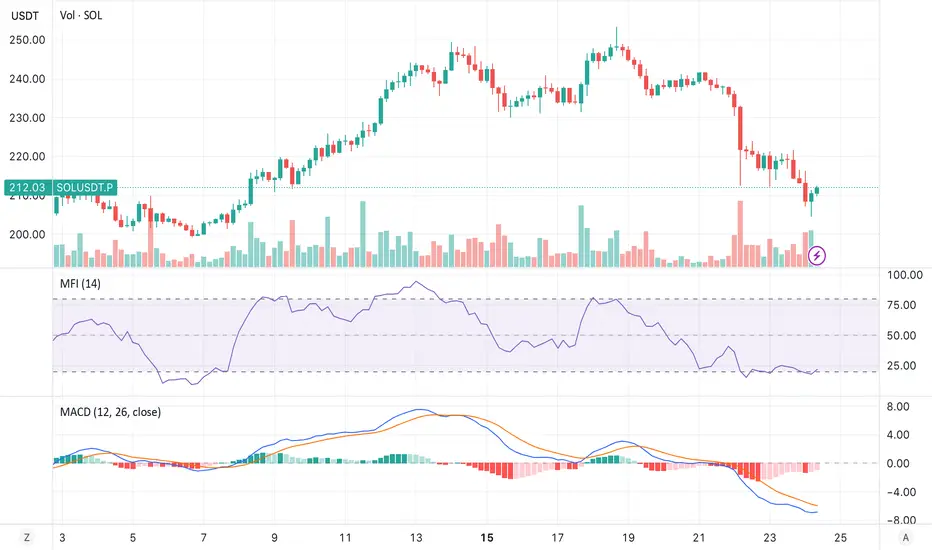
SOL 02.10#SOL
Easily broke out of the VAH local range since September 22. A possible retest of 221-222 could propel us further; I don't see any significant weakness on the indicator.
There are no serious resistances at all. The closest possible ones, from which we could react, are 235-240, 253-256, with liquidity at 273 and ATH.
Support zones:
221.5-222
215.1-215.7
207-210
Resistance zones:
207-210
234.2-234.7
238.4-240
USDTSOL.P trade ideas
Sol market snapshotIf SOL cannot break above 245, there is a chance of forming a reversal pattern — Head and Shoulders (H&S). The right shoulder should not exceed the head.
Main conditions of the Head and Shoulders pattern:
Three peaks:
Left shoulder — the first local peak formed after the price rises.
Head — a higher peak following the left shoulder.
Right shoulder — a peak approximately at the same level as the left shoulder, formed after the decline from the head.
Neckline:
Connects the lows between the left shoulder and the head, and then between the head and the right shoulder.
The neckline can be horizontal or slightly sloping.
A break below the neckline confirms the pattern and signals a potential price decline.
Volume:
Volume is often high at the left shoulder, may be higher or lower at the head, and usually decreases at the right shoulder.
Declining volume during the formation of the right shoulder strengthens the bearish reversal signal.
Movement after the breakout:
After breaking the neckline, the price is expected to fall approximately the same distance as from the neckline to the head’s peak.

SOLUSDT 1D - Bulls back in control with Golden Cross and channelOn the daily chart, SOLUSDT is forming a bullish continuation structure. After the Golden Cross (MA50 crossing MA200), the price is now pulling back toward the midline of the ascending channel and the 0.5 Fibonacci level at 166.38. This confluence with the broken trendline and 200 EMA makes this zone a prime technical area of interest.
Support: 166.38 (0.5 Fibo), EMA200 (161.77), broken trendline
Resistance: 182.84–189.67 (Fibo 0.705–0.79), 206.54, target - 255.93 (Fibo 1.618)
This retracement looks healthy, supported by higher volume during the prior bullish leg. As long as the 166.38–161.77 zone holds, continuation toward 206.54 and potentially 255.93 is on the table.
Fundamentally, Solana remains a key L1 narrative with strong traction in DePIN and AI-linked dApps. The rising TVL and investor sentiment support the trend.
Watch price action around 166 for confirmation - this is the battleground.

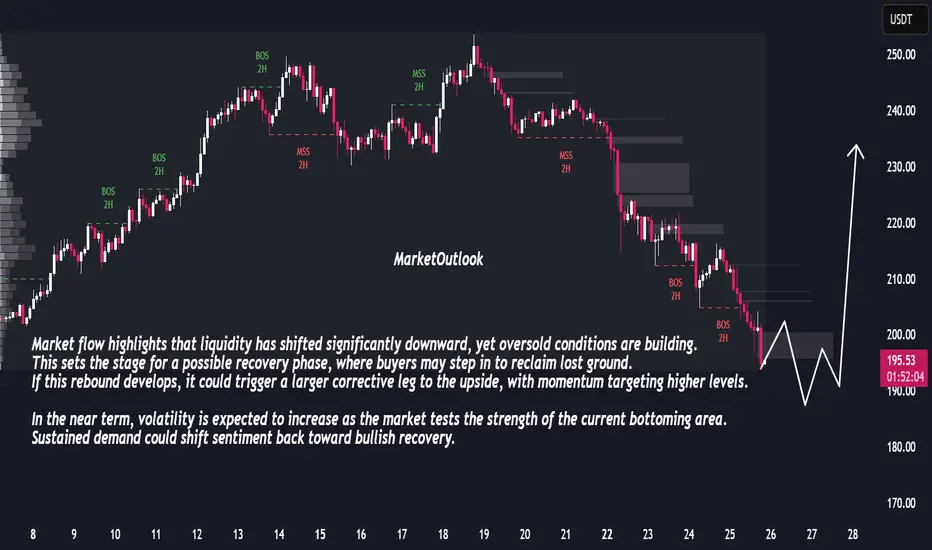
Bullish Reversal Ahead: Market Prepares for Sharp RecoveryThe market has been under consistent selling pressure, with a clear sequence of bearish breaks in structure confirming downside control. Price has now entered a zone where momentum shows signs of slowing, suggesting potential exhaustion in the recent decline. The sharp extension lower indicates that sellers may be reaching a short-term limit, creating conditions for a corrective rebound.
Market flow highlights that liquidity has shifted significantly downward, yet oversold conditions are building. This sets the stage for a possible recovery phase, where buyers may step in to reclaim lost ground. If this rebound develops, it could trigger a larger corrective leg to the upside, with momentum targeting higher levels.
In the near term, volatility is expected to increase as the market tests the strength of the current bottoming area. Sustained demand could shift sentiment back toward bullish recovery.
SOL/USDT Wave C Still Unfolding | Short Bias Until $194–186 ZoneOL/USDT has completed a 5-wave push into the $253 top and is now unfolding a corrective A-B-C move. Price is breaking below the $200 psychological level, with liquidity resting at $197–194. If this zone fails, Fibonacci projections point toward $186–184 and even $174–160 for full C-wave completion.
Any bounce into $205–210 or $215–220 should be viewed as a bearish retest and potential short entry unless structure is reclaimed. For bulls, the first real opportunity comes only if a hammer/engulfing candle with RSI/MACD divergence forms at $194–186, or on a deeper flush into $174–160. A clean break and hold above $220 would be the first sign of bullish reversal. Until then, bias remains short into lower supports.
Tags:
#SOL #Solana #Crypto #ElliottWave #TechnicalAnalysis #Altcoins #SwingTrade #Bearish #ABCMove #TradingView


SOL/USDT | Solana at $220.5 – Bulls Preparing for Next Rally!By analyzing the Solana chart on the daily timeframe, we can see that, as expected, the price started a correction and entered the $220 demand zone. After that, some buying pressure appeared, and SOL is now trading around $220.5.
If the price can hold above this level, we can expect the start of the next bullish wave. The possible upside targets are $230, $242, $254, and $262.
Please support me with your likes and comments to motivate me to share more analysis with you and share your opinion about the possible trend of this chart with me !
Best Regards , Arman Shaban

BUY AND HOLDHello friends
Due to Solana's ATH and the Solana network becoming wider every day, big money is entering this currency, and considering the pullback we made, it is a good opportunity to enter with risk capital management and buy in steps in the specified areas.
Note that the holding period is at least 3 months, so be patient and observe capital management.
*Trade safely with us*

SOL/USDT: Pullback Toward Key Confluence Zone After Double TopSOL/USDT is currently retracing from the 250 resistance zone after forming a double top pattern, signaling near-term weakness. On the 4H chart, an upward channel intersects with a downward trendline, creating a critical confluence area between 200 and 210.
If the price rebounds from this zone, buyers may attempt a retest of 230, with potential to extend the move higher. The broader bullish structure remains intact as long as support at 200 holds, keeping the upside momentum in play

Lingrid | SOLUSDT Pullback Opens Long OpportunityThe price perfectly fulfilled my previous idea . BINANCE:SOLUSDT is retracing from the 250 resistance zone after forming a double top structure. 4H chart highlights an upward channel intersecting with a downward trendline, creating a key confluence around 200–210. If price rebounds from this zone, buyers could retest 230 and potentially extend higher. The broader bullish structure remains intact as long as the 200 support holds, keeping upside momentum in play.
⚠️ Risks:
A breakdown below 200 may shift bias back to the 165 support area.
Broader crypto market weakness could suppress bullish continuation.
Macro headwinds like stronger USD or risk-off sentiment could pressure $SOL.
If this idea resonates with you or you have your own opinion, traders, hit the comments. I’m excited to read your thoughts!

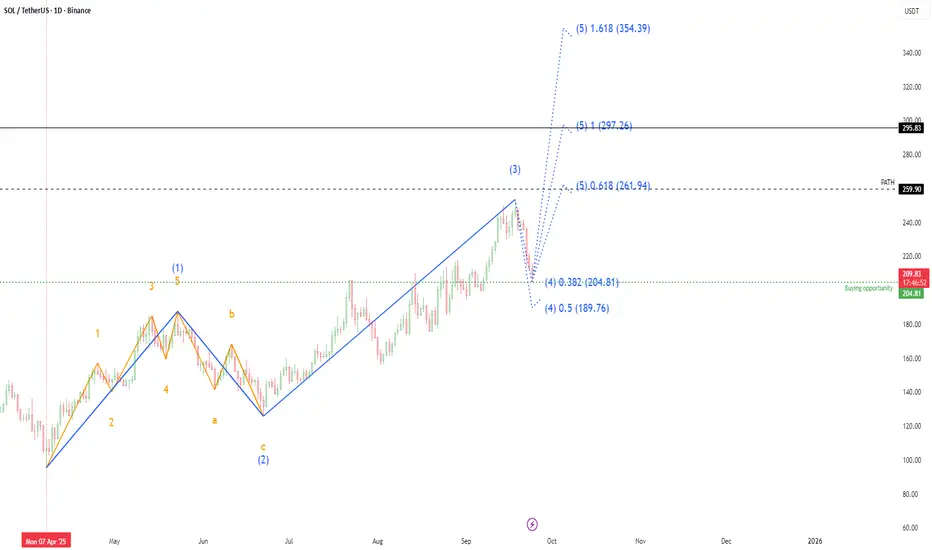
Solana - Elliott Wave Analysis Based on Elliott Wave Theory, Solana appears to be completing Corrective Wave 4, with a potential buying opportunity in the $189 – $204 range. The market structure suggests the development of Impulse Wave 5, which is becoming increasingly evident on the daily chart.
SOL/USDT 1D chart review 1. General trend
• A strong upward trend has been underway since June (orange trend marked).
• Recently, we had a very strong rally to around USD 250, but there was a violent correction.
2. Support and resistance
• resistance:
• USD 214 (local resistance, the market has bounced down here).
• 230 USD (strong resistance).
• USD 250 (peak, main resistance).
• Support:
• USD 193 (here the price is currently fighting).
• 176 USD (another strong support - earlier consolidation).
• USD 158 (key support, fracture could mean a change in the trend).
3. STOCHASTIC RSI
• Currently in the sales zone (nearly 0) → may suggest that the market is approaching a local hole and a potential reflection.
4. Scenarios
• Bullish:
If support is supported at 193 USD, possible reflection in the direction of USD 214, and after breaking this level - an attack on USD 230.
• Bearish:
If the price pierces $ 193 down, the next goal is 176 USD, and below even USD 158.
5. Summary
• The market is in correction after strong height.
• At the moment, the key level is 193 USD. Maintaining this support can be reflected.
• However, breaking 193 will open the road to 176.
• RSI shows the sale → short -term relief.

..../..../ SOLUSDT ..../..../..../..../..../..../so this is how i think i analyse with price action and i like to see how do you think so LEAVE A COMMENT
also be carefull now market is risky now we tought btc will go up but now we are going bearish but there is still a little hope that btc go up NOW and we are hiting some important support if we brake them we gonna have a whole new trend with a whole new plan
take care

$sol long SOL/USDT | LONG Position Active
Chart Time: Sep 26, 2025 | 09:56 UTC-4
Just entered a LONG position on SOL/USDT.
Current levels to watch:
Entry Zone: Around $192 - $196
Near-term Target: $215.02 (+21.0% from entry)
Key Support: $192.69 - $194.74
Price is showing strength after consolidating near the $195 region. The setup suggests momentum building toward the $215 resistance level.
Will monitor closely for any break above $199 for confirmation of continuation.
Risk Disclaimer: Trade with caution, set stops, and manage risk accordingly.

Solana Eyes 14% Upside, Approaching $275 Breakout Target SoonHello✌️
Let’s analyze Solana’s price action both technically and fundamentally 📈.
🔍Fundamental analysis:
The SIMD-0326 upgrade could cut Solana’s block finality to just 150ms, possibly bringing big traders and fresh capital. But new validator fees might be tough on smaller player
📊Technical analysis:
SOL is trading within a strong ascending channel, nearing a breakout above the upper boundary, which could propel price toward $275 with at least 14% upside. 📈🚀
✨We put love into every post!
Your support inspires us 💛 Drop a comment we’d love to hear from you! Thanks , Mad Whale

SOLUSDT: Strong Uptrend with Solid SupportSOLUSDT is currently showing a strong upward trend thanks to the stability of the cryptocurrency market and a positive risk sentiment from investors. The Solana (SOL) token is receiving significant support from fundamental factors, such as a stable commodities market and the pressure on the US dollar due to the Federal Reserve's interest rate cuts.
From a technical perspective, SOLUSDT is testing the important support level at $199.00. If this level holds, the likelihood of a rebound and continuation of the uptrend is very high. The next resistance level is expected to be at $218.00, and if this level is breached, the price could continue towards $230.00.
The upward trend line remains intact, providing positive signals for the next move. Based on both fundamental and technical factors, SOLUSDT is likely to maintain its upward momentum if the support at $199.00 holds.

#SOLUSDT SHOWING BULLISH DIVERGENCE AT 4 HOURS TIME FRAMECurrent Structure:
SOL is currently trading around $204.65, testing the lower range after breaking below a short-term trendline. The chart highlights a bullish divergence on RSI, suggesting potential upside momentum.
Key Levels:
Entry Zone: $213.22
Stop Loss (SL): $202
Take Profit 1 (TP1): $223.78
Take Profit 2 (TP2): $252
Market Context:
The chart shows a falling wedge breakout setup, often a bullish reversal pattern.
RSI has marked a bullish divergence, signaling potential strength building despite recent price drops.
Price is near a major demand zone (green area) around $200–$193, which adds confluence to the bullish case.
Bullish Targets:
TP1 ($223.78): Aligns with previous liquidity area and fair value gap (FVG).
TP2 ($252): Major resistance zone where sellers may step in again.
Bearish Risk:
If SOL breaks below $202 support, it could revisit deeper demand zones near $193 and even $185.

SOLUSDT (4h) 07:00 close I built base scenarioSnapshot of the last 4h candle (and what it means)
• Price: ~210.56 — current base reference.
• VWAP (entire period): ~201.04; z(Price−VWAP) ≈ −2.25 — price above VWAP by ~9.5$, but "premium to VWAP" is lower than usual for the last 100 bars → space for medium return to the averages upwards without overheating.
• aVWAP (anchors): start 201.04, 60d 201.76, from swing low 223.35, from swing high 220.98 — we are below the swing anchors (locally the seller dominates) and above the global ones (start/60d).
* Donchian 20/55:
-20: High 241.70 / Mid 223.09 / Low 204.49 — trading between Mid and Low → frequent rotation to the Mid.
— 55: High 253.40 / Mid 228.94 / Low 204.49 — a more "distant" average target of 228.9.
• Volume Profile (~60d): POC ~203.21, VAL ~168.24, VAH ~239.71 — higher than POC, but still in the value price zone; POC often acts as a magnet/support.
• RSI(14): ~26.9 — oversold → increased risk of a rebound.
* MFI(14): ~17.9 — cash flow is oversold, similar to RSI but with volume consideration.
• CMF(20): ~−0.13 — total capital outflow, confirms seller pressure.
• MACD(12/26/9): line −6.93 below signal −5.75, hist. −1.18 — bearish momentum is active, but histogram is shrinking (weakening).
• ADX/DMI(14): ADX ~48.6; +DI ~4.7 / −DI ~38.5 — strong downward trend (−DI≫+DI).
* ATR(14): ~5.40$ — characteristic 4h range; useful for buffers.
• Keltner: Upper 232.25 / Mid 221.96 / Lower 211.66 — standing next to KC-Lower → typical rebound zone to Mid.
• Bollinger(20,2): Upper 245.91 / Mid 224.32 / Lower 202.73 — between BB-Lower and BB-Mid; mean-reversion up is a priority.
• BB-Squeeze: OFF — volatility is not compressed; the trend has already been established.
• z(Price−VWAP) ≈ −2.25 — the "premium" to VWAP is below the norm → no overheating, and there is room for подтягивания к средним.
• OBV z-scores: z50 −1.85 / z100 −1.39 / z200 −0.56, OBV ROC(10) ≈ −0.78 — sales dominated, distribution; no fresh influx of buyers yet.
• Open Interest: ~7.95M, z(168) ≈ −0.11, ROC(5/10) ≈ +0.05 / +0.06 — moderate position set (non-aggressive), closer to neutral.
Latest divergences (auto-detector)
• RSI: bearish 13 Sep 03:00 → 14 Sep 03:00, bullish 17 Sep 03:00 → 17 Sep 15:00
• MACD: bullish 8 Sep 23:00 → 9 Sep 15:00, bearish 13 Sep 03:00 → 14 Sep 03:00
• OBV: bullish 30 Aug 15:00 → 1 Sep 03:00, bearish 13 Sep 03:00 → 14 Sep 03:00
• MFI: bearish 18 Sep 03:00 → 18 Sep 19:00, bearish 20 Sep 15:00 → 21 Sep 03:00
Reading divergences: fresh bullish signals are limited; some of the latest ones are bearish (especially on MFI/OBV), which restricts the scale of the rebound, but the oversold RSI/MFI still gives Edge to rotate to the averages.
⸻
What does this mean now
1. Mode: strong downtrend, but the price is pulled towards the lower shells (KC-Lower ~211.7 / BB-Lower ~202.7), the RSI/MFI is oversold, and the "premium to VWAP" is below normal → the base risk scenario is a rotation to the averages (221.9–224.3).
2. Profile: we are above POC ~203.2, inside the value-area (VAH ~239.7 / VAL ~168.2) → a POC retest is possible, but more often inside VA the market tends to average.
3. Derivatives: OI ≈ neutral/slightly ↑, OBV weak — a volume/capital inflow is needed for sustainable growth; otherwise, the rebound risks being “technical”.
⸻
Key levels
Resistances: 221.96 (KC-Mid) → 223.09 (Donch-20 Mid) → 224.32 (BB-Mid) → 228.94 (Donch-55 Mid) → 232.25 (KC-Upper) → 239.71 (VAH) → 241.70 (Donch-20 High) → 253.40 (Donch-55 High).
Supports: 211.66 (KC-Lower) → 204.49 (Donch-Low 20/55) → 202.73 (BB-Lower) → 203.21 (POC / support) → 201.04 (VWAP) → deeper — liquidity pockets from the profile (see JSON).
⸻
Scenarios and triggers (not financial advice)
A) Basic — rotation up to the middle / 222–224
• Trigger: 4h-close > 214.4 (≈ KC-Lower + 0.5×ATR) when RSI > 30, MFI > 25, hist. MACD↑, CMF → 0.
• Targets: 221.9–224.3 (KC/BB-Mid, Donch-20 Mid) → 228.9 → 232.3.
* Invalidator: return < 211.7 (KC-Lower) or sharp puncture < 209 (≈ KC-Lower − 0.5×ATR).
B) Continuation of the downward trend
• Trigger: 4h-close < 204.5 (Donch-Low) together with: ADX ≥ 40, OBV z50 ≤ −2, OI ROC+ on a red candle.
• Targets: 202.7 (BB-Lower) → ≈201.0 (VWAP) → with inertia — passes on LVN from the profile.
• Invalidator: return over 211.7 and hold.
C) Short-squeeze
• Trigger: impulse breakout and hold > 228.9 (Donch-55 Mid) or > 232.3 (KC-Upper) with OI falling on a green candle and OBV growing.
• Targets: 239.7 (VAH) → 241.7 → 253.4.
• Invalidator: fake breakout with return < 224.
⸻
Tactics (example of logic)
• Impulse long: after confirmation > 214.4. Partial fixation at 221.9–224.3, then trail to 228.9 → 232.3; stop under 211.7 or ~0.8–1.2×ATR (4.3–6.5$) from the entry.
• Reversal long (conservative): zones 211.7 (KC-Lower) and 203–205 (POC/Donch-Low) only when demand reacts (RSI/MFI up, CMF→0/+) — targets 223 → 229.
• Contra-trend short: carefully on rejection 228.9–232.3 (RSI<50, hist. MACD↓, OI ROC+) — targets 224 → 222 → 215; stop at 232.5–233.
⸻
In short: what to expect
The base scenario is a technical rebound to 222–224.
• We will fix ourselves above 224 → 229 → 232, and a corridor will open to 239–242.
• We will lose 211.7 and fix ourselves < 204.5 with OI↑, and we will continue down to 202.7 → 201.0 and below through thin zones.
SOL/USDT (4H chart) Bearish Bias🔎 Technical Outlook
• Trend: After a strong rally toward $250, Solana has started forming lower highs and lower lows, a clear sign of weakening momentum.
• Resistance Zone: Price faced rejection near $237 – $240, which aligns with a previous supply zone. This has turned into a ceiling for the market.
• Support Levels: Current price is hovering around $222, but if sellers maintain control, the next strong demand zone lies near $200 — also your marked target.
• Candlestick Behavior: The recent sharp decline shows strong bearish pressure, and recovery attempts have been weak, signaling more downside potential.
________________________________________
📉 Trade Setup (Bearish)
• Entry Zone: $222 – $223 (current area)
• Stop-Loss: $238 (above resistance and last swing high)
• Take Profit 1: $210 (interim support)
• Take Profit 2: $200 (major support)
• Risk/Reward: ~1:2 (attractive setup)
________________________________________
🛡 Risk Management
• 📉 Partial Profits: Secure partial gains at $210 before targeting $200.
• 🔒 Trailing Stop: Once $210 is hit, move SL to breakeven ($222) and trail down to lock profits.
• 🚫 Invalidation: A sustained break above $240 would cancel the bearish outlook and could push SOL back to $250+.
________________________________________
✅ Summary
Solana looks weak after repeated rejections at $237 – $240, and bears are in control. If sellers maintain momentum, a drop toward $210 and $200 is likely. The setup favors shorting rallies with a tight stop-loss above resistance.
________________________________________

SOL/USDT: Correction or Ready for Further Upside?Hello everyone, today I’d like to share a brief analysis of Solana (SOL) and the current market dynamics.
Currently, Solana is experiencing a slight pullback after a strong rally in recent weeks. During this phase, Fair Value Gaps (FVGs) are forming, which could provide potential opportunities for the market to fill price inefficiencies and continue its previous bullish momentum.
Technical Perspective:
From a technical standpoint, Solana is trading below the Ichimoku Cloud, which is an important indicator for determining its next move. The cloud is still thick and red, indicating a potential resistance zone. However, we are seeing some FVGs around $218–$220, which suggests that this could be a key support area. If Solana fails to hold above this level, we could see a deeper correction toward $210–$212 to fill the remaining gaps before resuming the uptrend.
Macro Factors Impacting Solana:
Institutional Adoption: Big players like Galaxy Digital and Pantera Capital have been heavily investing in Solana, indicating strong long-term belief in its blockchain ecosystem.
SEC Regulations and Crypto ETFs: The approval of crypto ETFs and potential changes in SEC regulations will likely impact Solana’s market position. If Solana continues to see ETF inflows, it could significantly increase demand for SOL.
Crypto Market Sentiment: The overall strength of the crypto market, particularly the institutional support for blockchain technologies like Solana, will continue to be a crucial factor. Bitcoin’s dominance in the market also plays a role in pushing altcoins like Solana higher.
Solana Outlook:
Although Solana is currently in a slight pullback, I anticipate that after testing the key support levels between $218 and $220, it will find buying pressure and push back higher. If these levels hold, the market is likely to continue its bullish momentum toward the next resistance levels, with a first target around $230–$235.
Therefore, if you're monitoring Solana, the $218–$220 range is a strategic area to consider buying, with expectations of continued upside momentum in the near term.
Wishing you successful trades and always exercise caution in your decisions!

$SOL bearish but long entry markedSolana made double top and currently correcting and grabbing liquidations. Marked is the zone from where i will be longing and placing stoploss at 180$. however i will be taking 2x leverage maximum.

SOLUSDT Strong Rejection at Key Support – 230.00 Incoming!Hey everyone, Ken here!
SOLUSDT has been quite interesting lately. After a sharp decline from the channel’s top, the price broke through the support zone, often referred to as the neckline, and reached a key support area below. Here, we saw a strong rejection wick, which clearly indicates that buyers have stepped in and are ready to take control of the market.
With this setup, I predict that the 230.00 level will be a reasonable target in the short term. The strong rejection at this support zone suggests a high potential for a reversal.
Feel free to leave a comment if you agree with this prediction, or if you have a different perspective. Let’s discuss and share our ideas!
