USDTSOL.P trade ideas

sol longhere again with another signal guys , just take it easy and dont panic
BINANCE:SOLUSDT long
tp : 220.20
sl : 206.44

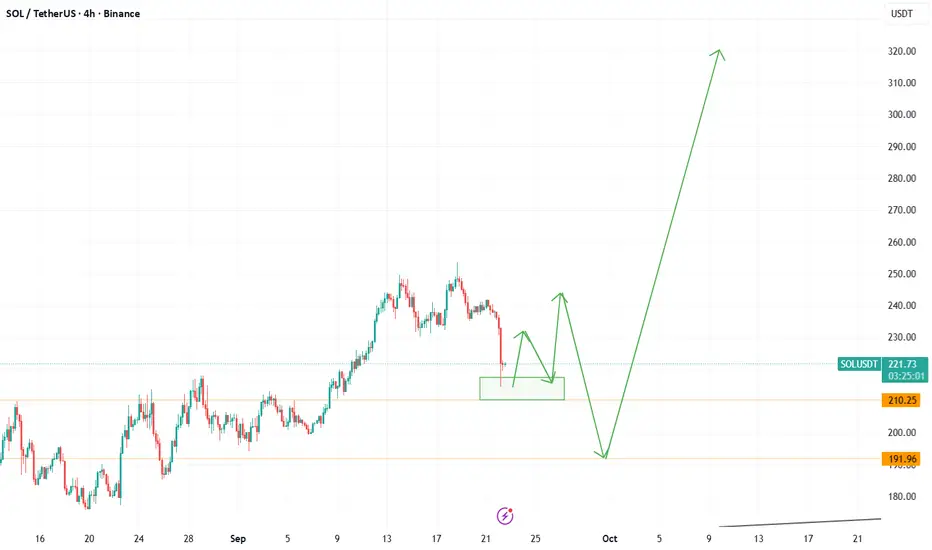
SOLANA → When will the sale end? Bullish trend...BINANCE:SOLUSDT.P is testing the key support zone of 210-215 amid a market decline. However, it is too early to say that the correction is over; additional signs are needed...
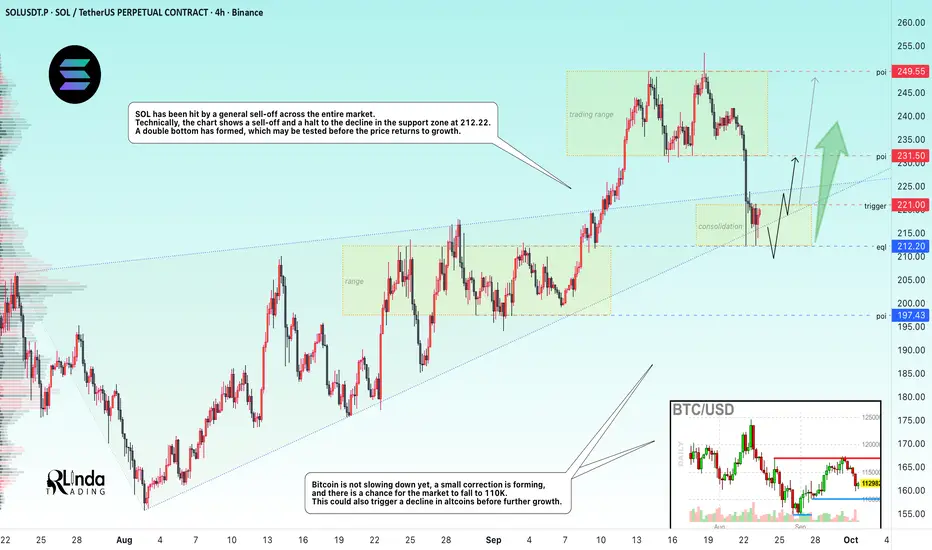
Bitcoin is not slowing down yet, a small correction is forming, and there is a chance for the market to fall to 110K. This could also trigger a decline in altcoins before further growth. SOL has been hit by a general sell-off across the entire market. Technically, the chart shows a sell-off and a halt to the decline in the support zone of 212.22. A double bottom has formed, which may be tested before the price returns to growth.
The current consolidation in the range of 212.0 - 221.0, the boundaries of which are of interest to the market, gives hope.
Support levels: 212, 200, 197
Resistance levels: 221, 231.5
A breakout of the local consolidation resistance and a close above 223.5 - 224 could trigger further growth within the bullish trend. Otherwise, MM may test the liquidity and support zone of 212.0 before the coin begins its recovery phase.
Best regards, R. Linda!
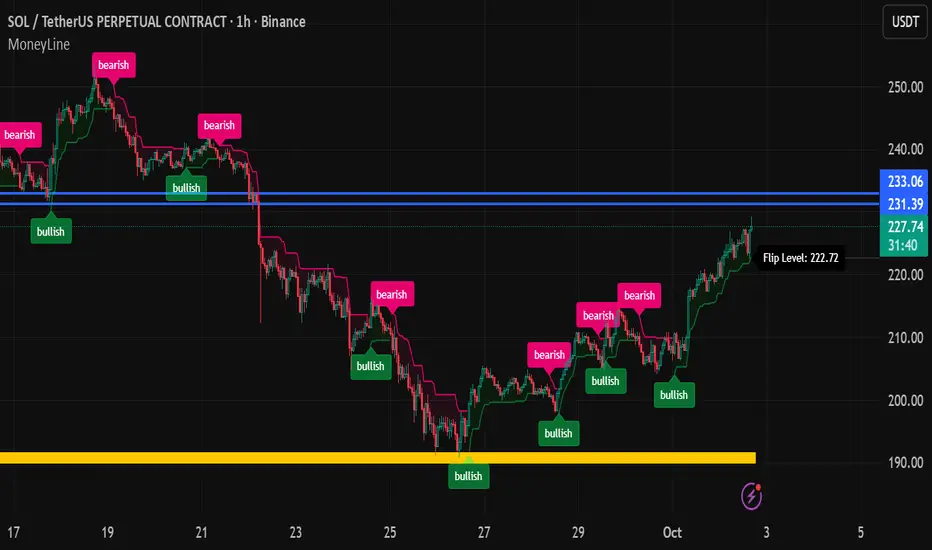
Next Stop for SOLThis is the next area for some consolidation before continuation LOL. Personally not taking profits in this area. That's because of my entry point. (I'm only up 35% at this level) I may pick more up if we can break above $233. Lets go!!
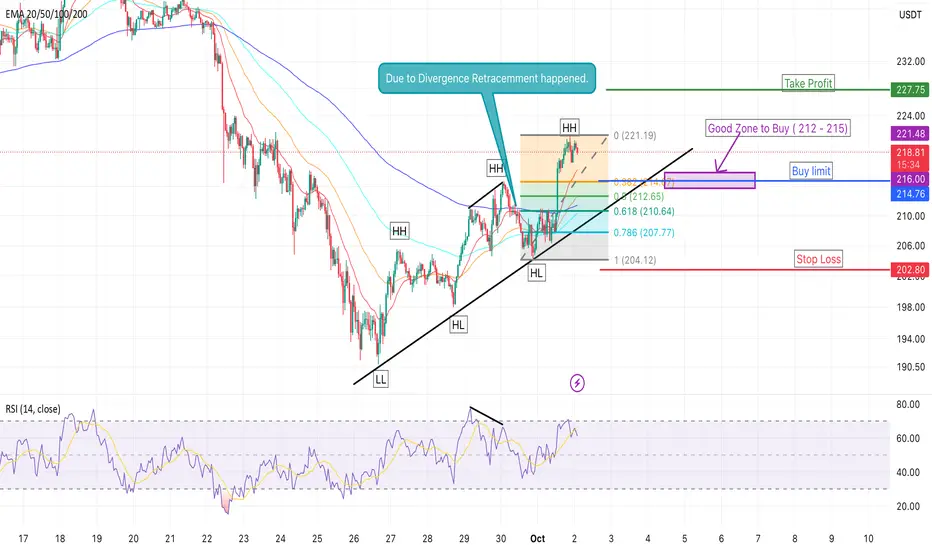
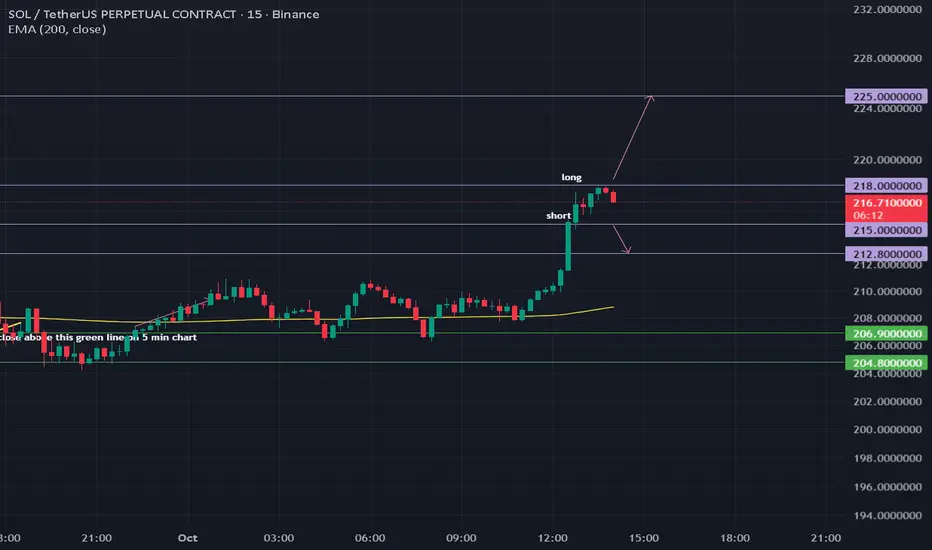
SOL/USDT: Breakout or Pullback? Key Levels AheadOn the 1H timeframe, Solana is showing a clear bullish structure with consistent Higher Highs (HH) and Higher Lows (HL). The ascending trendline is well respected, supporting the bullish move.
🔎 Technical Outlook
Price recently made a new HH at 221 before pulling back.
Current retracement is testing the Fib 0.382 level around 214.5 which also aligns with dynamic support from the EMA cluster.
Deeper retracement levels to watch:
Fib 0.5 (212.5)
Fib 0.618 (210.5) – strong confluence with trendline support.
RSI (62): Slight bearish divergence forming, suggesting short-term pullback possible.
📈 Bullish Scenario
If SOL holds above 214–212 support, we may see a continuation toward 225–230 next resistance zone.
📉 Bearish Scenario
A break below 210.5 and trendline would invalidate bullish structure → price could retest 204–205 support zone.
⚡️ Fundamentals
Solana continues to gain traction with high DeFi and NFT activity.
Overall sentiment in altcoins remains bullish, supporting continuation.
✅ Trading Plan
Watch 214–212 as key support.
Long entries possible near Fib 0.5–0.618 with tight SL below 204.
Target: 225 / 230.
💬 What do you think? Will SOL hold the trendline for another leg up, or is a deeper correction coming? Drop your thoughts below and follow for more updates!
📌 Disclaimer: This is my personal analysis, not financial advice. Trade safe and manage risk.
solusdt, solana, solanausdt, solanalysis, solchart, solanacrypto, solbullish, solbearish, solsetup, solanatrend, crypto, cryptotrading, cryptomarket, cryptocurrency, altcoins, altcoinanalysis, altcoinseason, altcoinsetup, altcoinguide, defi, nft, bullrun, breakout, trendline, fibonacci, support, resistance, ema, rsi, divergence, higherhighs, higherlows, technicalanalysis, chartanalysis, tradingsetup, cryptotrader, tradingview, tradeideas, bullishsetup, bearishtarget, cryptosignals
SOLANA LongSolana Breaks 1hr resistance , that is a good Bullish signal to go long targeting daily order block

scalp your soul again Hi
This trade targets the next major liquidity zone, capitalizing on the momentum generated by the market structure breakout and ETF speculation.
Momentum Trigger: Enter on a confirmed break and close above the current high (≈$217.42) to validate continuation after the current brief consolidation.
TP 225 A ≈3.2% move, targeting the next major psychological level and the midpoint between the current price and the all-time high zone
SOL 1H: Next Move IncomingGood morning, Solana is currently at the lower part of the channel and has tested the ascending trendline multiple times. A breakdown of this trendline could push the price down to the first support level, around $198. Conversely, a bullish breakout could drive Solana to the upper part of the channel, around $220. Awaiting confirmation.
Thank You!

Solana at 200 Support — Bounce Toward 230 or Deeper Drop?At the moment, Solana is in an upward correction but has already reacted from the weekly pivot point at 212 . I expect to see support around the 200 – 202 zone, though a dip to 198 is also possible.
However, if the price gets stuck below 198 and fails to quickly recover above 200 , the scenario with continued downside will become the priority.
For now, I’m looking for a move down into the 200 – 202 area, followed by growth with a new local high and a push toward the first resistance level at 230 .

Buy/Sell (long/short) areas for major cryptos part IIIthis is a continuation of the successful part II analysis:
note for this part III is that the green zone mid october which it seems to be a good bottom for future red zones.
November looking like a potential full green month, maybe we see a good run around then.
gl

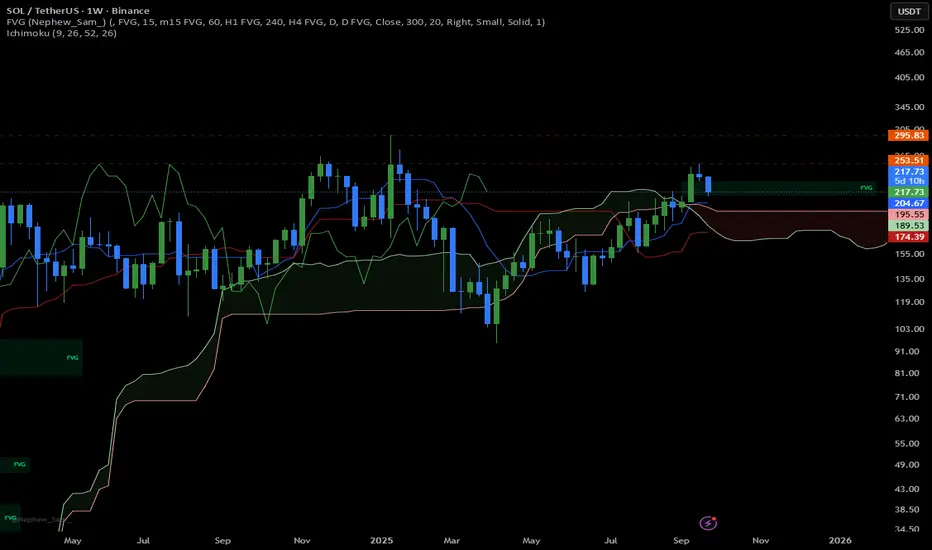
SOL TA 29.09The sectors are already 10% away from the important zone, and I don't see any signs of a decline from the current level. The most important resistance is R1 (211-212.5) – if we break it, there's a high chance we'll finally be able to renew the ATH. After R1, the nearest normal resistances are at 235-240.
The closest vital support zone is still relevant – 190-193. There's nothing particularly significant before it, just a couple of local minor ones, but they could trigger further growth.

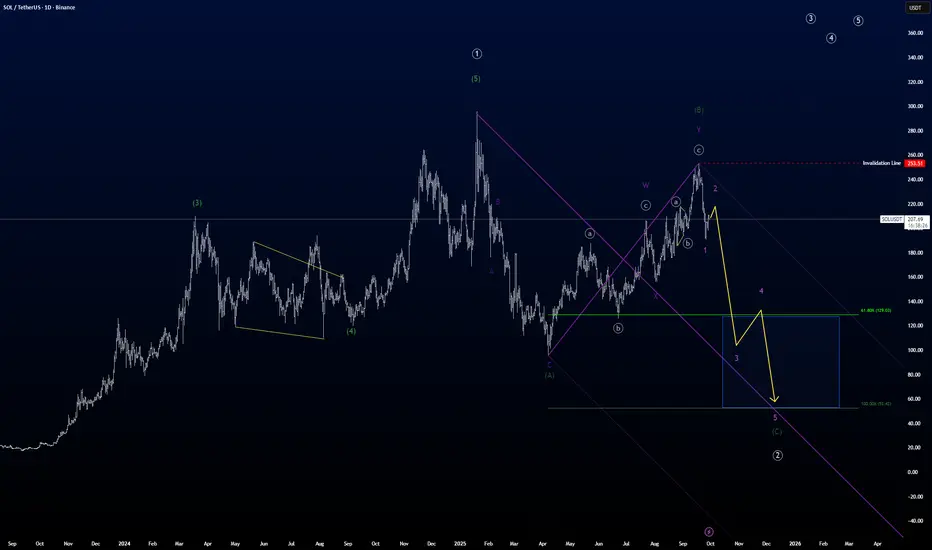
SOL is messy but is going through a correction.SOLs last move up in white primary ((1)) was not as large compared to the move up prior to that, which we can't see on the picture. So I guess we still have a large 3rd of a 3rd to come in a move up.
But first we still need to finish this correction SOL is in right now.
I believe SOL is doing a flat correction in a primary degree, so it takes some time to get through.
It looks like the green (B) wave is finally done, and now we just need the green intermediate (C) to finish. The 1st wave of that c-wave is almost over if not already, so anticipate a correction up in purple 2nd wave.
When that 2nd wave is done, SOL will move into a strong move down in wave purple 3 following the yellow path.
double (()) indicates circle on chart.
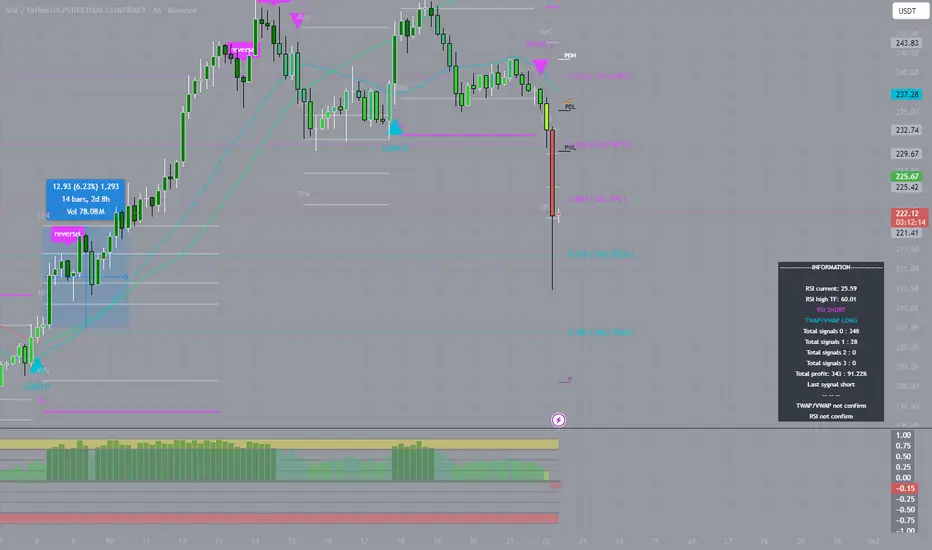
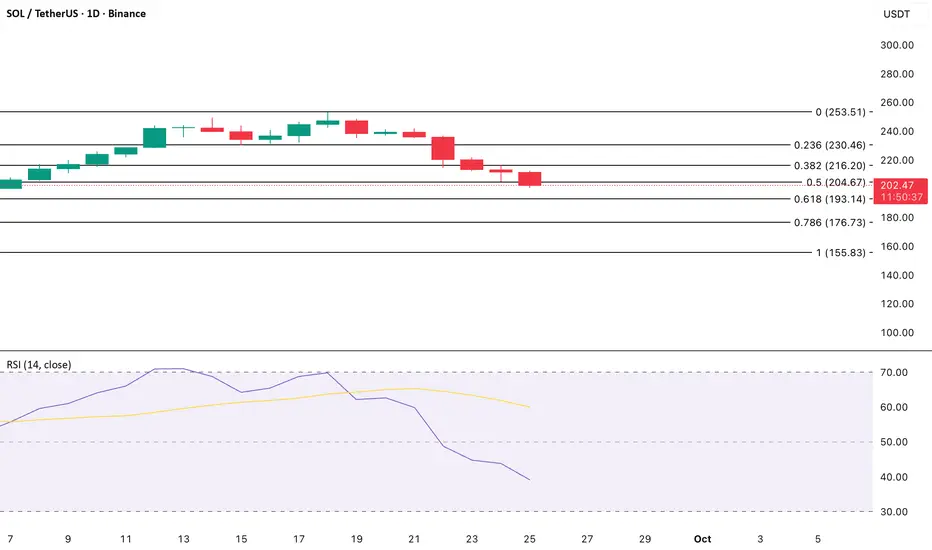
SOL RSI Signals Sustained Bearish MomentumSolana’s daily chart paints a clear picture of weakening demand as its Relative Strength Index (RSI) plunges to 39.07.
The RSI is a momentum indicator that measures overbought and oversold conditions, with levels above 70 reflecting overbought territory and below 30 signaling oversold.
At its current reading, SOL sits firmly in bearish territory, showing that selling pressure is outweighing buying momentum.
While the market may not yet be facing a capitulation phase, the outlook remains tilted to the downside. If bearish sentiment lingers, downward momentum could persist in the near term.
Solana$It seems that Solana has reached its price peak, and I’m expecting a correction.
Of course, the price may decline gradually in stages

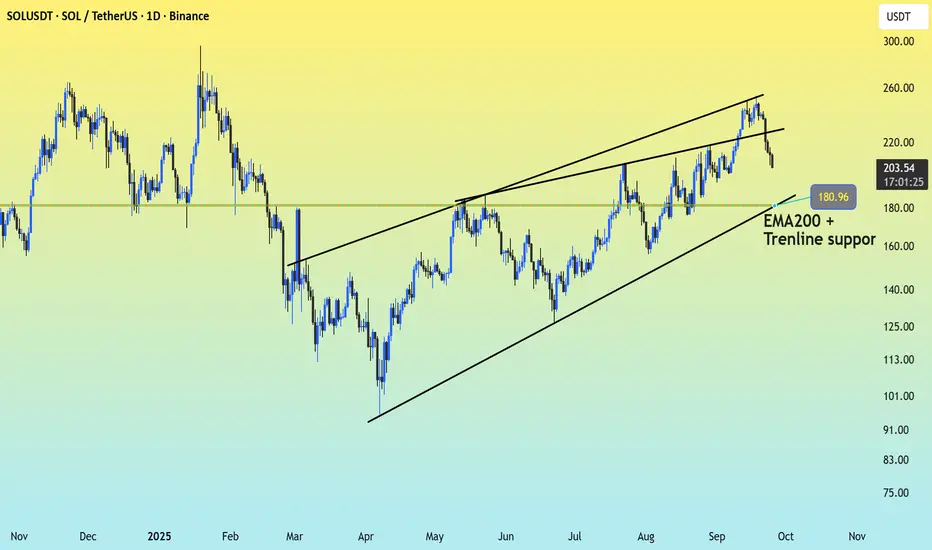
SOL at a Crossroads — Bounce or Breakdown AheadThe breakdown from the rising wedge is a bearish signal, suggesting a potential continuation of the downtrend.
Immediate Support: The next strong support lies around $181, which aligns with both the 200-day EMA and the ascending trendline support. This confluence zone will be crucial in determining if the bulls can defend the uptrend.
Resistance Levels: On the upside, resistance is seen near $220, which was the lower boundary of the wedge and may now act as resistance. Stronger resistance remains around $240–260.
Outlook: If SOL holds the $180 support, it may attempt a rebound. However, a breakdown below this level could accelerate bearish momentum, targeting the $150–160 range.
Will Solana Break Above 250 After Its Pause?The Solana (SOLUSDT) market is entering an exciting phase, with price repeatedly testing key levels and forming a dramatic sideways range. After a strong rally, SOL is now consolidating within the 230–245 zone , where support and resistance are battling fiercely.
If the 230 level holds , it could serve as a launchpad for a move toward 242 (TP1) and potentially 250 (TP2) . Positive developments, such as major institutions accumulating SOL and the surge of stablecoin inflows on the network, continue to strengthen the long-term bullish outlook .
However, risks remain if SOL loses the 230 mark and breaks the trendline, which could trigger deeper corrections. In the short term, the market remains sideways, but the broader picture still points toward a potential breakout.
The big question: can SOL sustain its momentum and explode beyond 250, opening the door to a new rally?

Possible scenario : Weekly pullback then 2 next TPHere are the potential two next take profit levels after the current pullback in the weekly timeframe.
SOL/USDT Intra day - Long IdeaBINANCE:SOLUSDT.P is showing a Bullish Divergence, if it breaks out, i am looking for longs :)

SOL Market Update📊 CRYPTOCAP:SOL Market Update
If SOL keeps retracing and arrives at the green support zone, watch for confirmation before entering long, as this is where buyers could step in and push the price up again.
🔹 Second important level is the red resistance zone — sellers are still active there. If the price returns to this zone, be aware of a possible retracement, but it could also be a potential short opportunity.

SOL riding the last wave to 300+ into Nov-Dec?Crypto might dip soon with SPX and pump much higher next month. Idea based on market patterns and fractals.
SOLANA short tradeI changed my mind on sol it rejects from fvg which signal weakness so i am in short

SOL: Clear ReversalOn September 15, I opened a short on the 4-hour chart at $237 with 10x leverage. The move down was quick: TP1 was closed at $233 and TP2 at $230. A $7 difference per coin, amplified by leverage, delivered a solid result. The maximum of the trade came exactly at $230 before the market reversed.
The focus here was not on trying to take everything but on following structure. Levels had been mapped in advance, and I executed step by step according to plan. This allowed me to control the trade calmly, without panic or guesswork.
When trading is built systematically, even sharp moves become manageable. It’s clear where to take profit, where to hold, and where to stop. With leverage, this becomes especially critical: risk stays under control, and decisions are made without emotional pressure.
The market will always move in its own way, sometimes offering more, sometimes less. But discipline and consistency make the outcome predictable. Every such trade proves that success comes not from luck, but from a systematic approach and the ability to stay on course.

SOL: Controlled Growth On September 8, I entered a long on the 4-hour chart at $206.16 with 15x leverage. The trade is still active, but the fourth profit level has already been secured at $222. The move was strong: about $16 per coin difference, with the maximum push before reversal reaching $248.
The key in this trade was not trying to squeeze everything out but strictly following the plan. Levels were defined in advance, and each of them worked out clearly. This allowed me to hold the position calmly, even as the market accelerated.
When trading is built on a systematic approach, decisions are made without rush. Clear profit-taking points, well-defined control zones, and structured scenarios guide the process. Even when using leverage, risk stays manageable, and emotions do not interfere with logic.
The market will always deliver moves bigger or smaller than expected. But discipline and structure make the outcome predictable. When trading shifts from chaos to a plan, every position becomes a step in a consistent strategy where results are defined not by chance but by the system.