#SOL/USDT bullish structure formed at the chart#SOL
The price is moving within a descending channel on the 1-hour frame, adhering well to it, and is heading for a strong breakout and retest.
We have a bearish trend on the RSI indicator that is about to be broken and retested, which supports the upward move.
There is a major support area in green at 216, which represents a strong support point.
We are heading for consolidation above the 100 moving average.
Entry price: 218
First target: 227
Second target: 234
Third target: 244
Don't forget a simple matter: capital management.
When you reach the first target, save some money and then change your stop-loss order to an entry order.
For inquiries, please leave a comment.
Thank you.
USDTSOL.P trade ideas
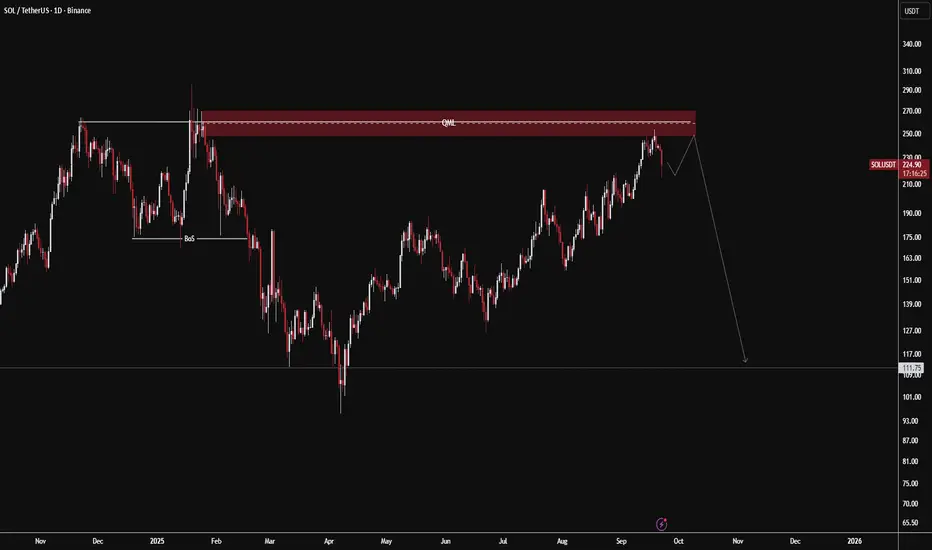
SOL/USDT – Daily OutlookSolana is now facing a critical Quasimodo Level (QML) around 260 – 270, a historically significant supply zone.
A strong rejection here could trigger a major downside move, potentially driving price back toward the 111 – 115 support area.
On the other hand, a decisive breakout and sustained move above QML would invalidate the bearish setup, opening the path for further bullish continuation.
At this stage, the QML acts as a make-or-break level for Solana. The next few daily candles will be decisive in determining whether SOL resumes its bullish trajectory or enters a sharp correction.
SOLANA ??sooo this is how i think write comment and let me know your idea
i dont use so many pattern and i thing its better to make levels and wait till they brake just using dynamic and static lines is enough BUT also you need to analyse candle by candle with EYES and use some basic candle patterns like pin bar and engulf is enough (how it worked for me)

SOLUSDT |15 m | Market Structure | Ongoing AnalysisAs of 21/09/2025
On the 15M chart, SOL is trading inside a range-bound zone, following the external LL + HL sequence from the 1H chart.
Within this range, we can see alternating HHs and HLs forming, which shows internal bullish intent, but no clean breakout has occurred yet. At the same time, price continues to respect the support zone (Internal + External BoS), suggesting buyers are active in defending this level.
📌 Current read:
The 15M structure is short-term bullish, but price remains capped by the internal BoS resistance. This makes the move more of a pullback/transition phase rather than a confirmed trend reversal.
A clean break above internal BoS would strengthen the bullish case, aligning with the defense at support.
A failure here and breakdown back below the support zone would resume the bearish external structure from the 1H chart.
For now, the 15M bias leans bullish, but higher timeframe context (1H) tells us to wait for confirmation before acting.

SOLUSDT | 1 H | Market Structure | Ongoing AnalysisSOL/USDT | 1H Time Frame (Higher TF – Swing Structure)
As of 21/09/2025
On the 1H chart, SOL had been forming HHs and HLs, but the last HL was broken, printing a LL. This confirms a bearish shift in the external structure.
However, instead of clean continuation, price has since moved into a range-bound consolidation zone.
The highlighted range reflects indecision, where the market is pausing after the initial bearish break. At the same time, price has been consistently bouncing off the support zone (marked Internal + External BoS). This suggests that buyers are actively defending this level, but we’ll wait for confirmation before calling it a reversal.
📌 Current read:
We are in a consolidation/pullback phase. The market is waiting for direction:
A break above the range could signal bullish retracement/continuation, confirming buyer strength.
A break below would confirm bearish resumption, in line with the external shift.
For now, patience is key until the higher timeframe provides a clear directional bias.

SOLUSDT under Bearish Pressure.SOL remains under bearish pressure after showing divergence on both MACD and RSI, signaling potential weakness despite holding near recent highs.
Key Levels:
Immediate support at 232.6 (Fib 0.618).
If broken, deeper downside targets lie at 218–215, with extension toward 210–206 zone.
Resistance remains at 239–245 zone.
📉 Idea: Short below 232–229 breakdown, targeting 218 → 210, with stops above 240–245 resistance zone.

SOL AGAIN/;Hello friends
You see that the price is stuck in a trading range and you must know that 80% of failures in trading ranges are fake!
Now, as the trading range lengthens, we can finally wait for its failure, and if it fails, the price will move by the same amount as the trading range.
*Trade safely with us*

SOL/USDTSolana cryptocurrency is worth buying at the $200 level, and if it holds support at that price, it could potentially rise to $300.
Currently, at $230, it's neither a good buying opportunity nor a good point to sell.

solana long to to $253.5solana long to to $253.5
Sl: 236.99
Time sensitive. Entered a while ago. Anticipating a bullish push this weekend based on the price action, currently breaking back above resistance onthe 4hr tf. If close above good chance we'll continue the pump higher

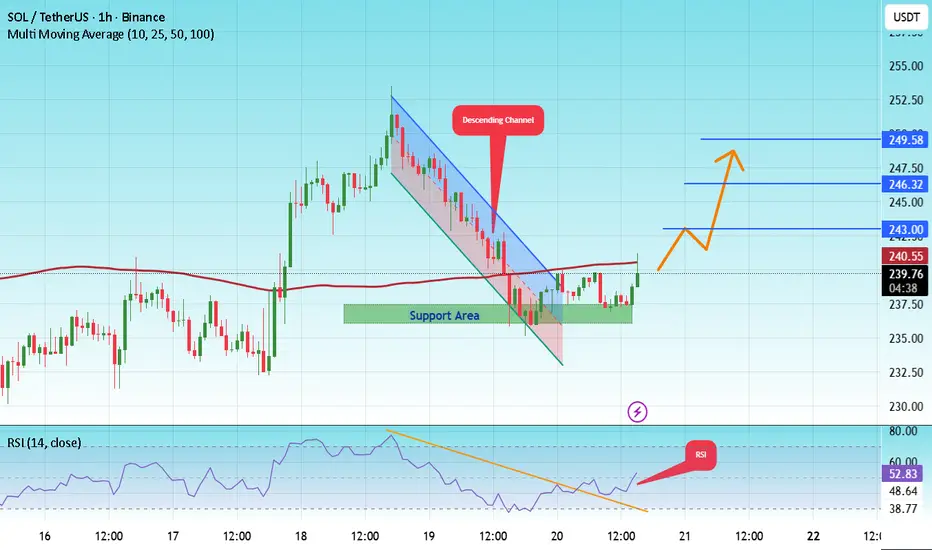
#SOL/USDT bullish structure formed at the chart#SOL
The price is moving in a descending channel on the 1-hour frame and is expected to break and continue upward.
We have a trend to stabilize above the 100 moving average again.
We have a downtrend on the RSI indicator that supports the upward move with a breakout.
We have a major support area in green that pushed the price higher at 236.
Entry price: 240.
First target: 243.
Second target: 246.
Third target: 249.
To manage risk, don't forget stop loss and capital management.
When you reach the first target, save some profits and then change your stop order to an entry order.
For inquiries, please comment.
Thank you.
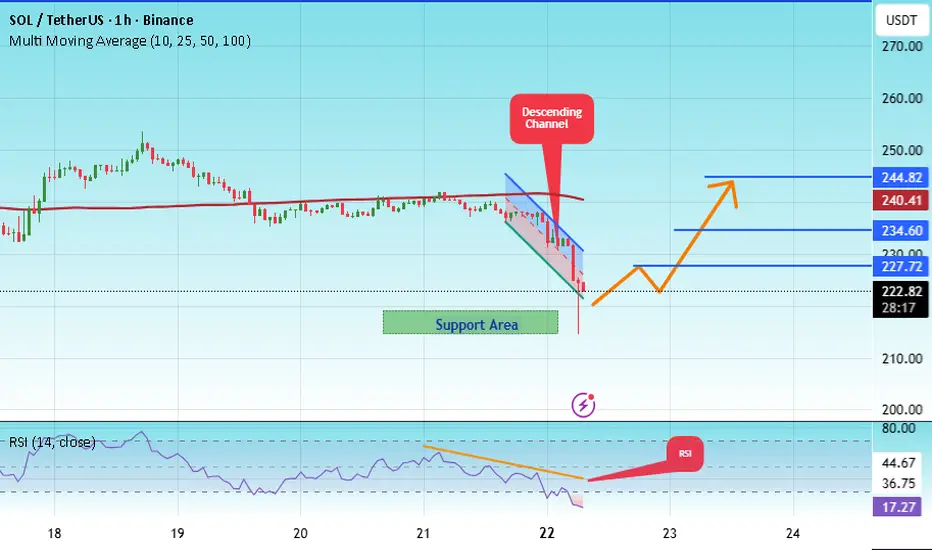
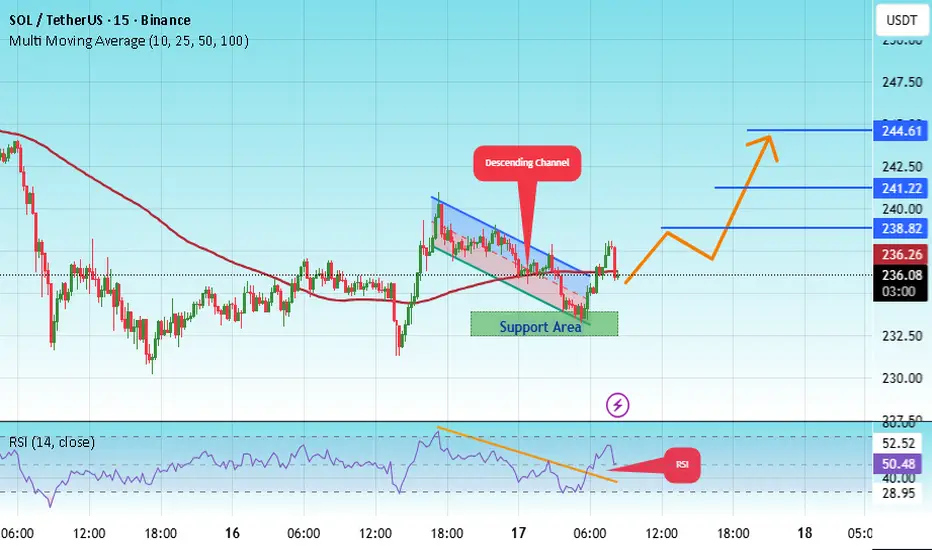
#SOL/USDT bullish structure formed at the chart#SOL
The price is moving within a descending channel on the 1-hour frame, adhering well to it, and is heading for a strong breakout and retest.
We have a bearish trend on the RSI indicator that is about to be broken and retested, which supports the upward breakout.
There is a major support area in green at 233, representing a strong support point.
We are heading for consolidation above the 100 moving average.
Entry price: 236
First target: 238
Second target: 241
Third target: 244
Don't forget a simple matter: capital management.
When you reach the first target, save some money and then change your stop-loss order to an entry order.
For inquiries, please leave a comment.
Thank you.
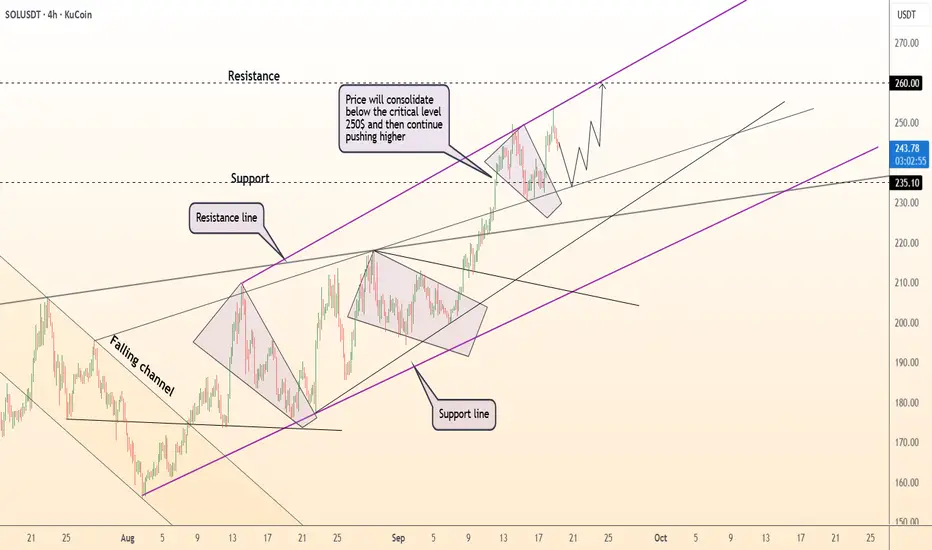
DeGRAM | SOLUSD seeks to the $260 level📊 Technical Analysis
● SOL/USD maintains a rising channel, consolidating just below the $250 resistance after strong rallies from $200 support.
● Structure suggests a bullish continuation, with a breakout targeting $260 if buyers defend $235–$240 as short-term support.
💡 Fundamental Analysis
● Solana gains momentum as institutional flows and DeFi growth increase, while broader crypto sentiment improves with easing risk aversion.
✨ Summary
SOL/USD is consolidating below $250, with $235–$240 as support and upside potential toward $260 if momentum holds.
-------------------
Share your opinion in the comments and support the idea with a like. Thanks for your support!
Solana Price Forecast | SOLUSDT Market OutlookSOLUSDT has completed a strong upward cycle and is now unwinding through a structured retracement. This phase is not showing disorderly selling but rather a controlled reset, where liquidity is being cleared to prepare for the next expansion.
The chart reflects a market that is cycling through accumulation, breakout, and pullback phases with consistency. Current downside movement is shaping a foundation zone that could serve as the springboard for renewed upward momentum.
Overall, the asset is displaying a constructive trajectory: corrections are functioning as fuel rather than weakness, pointing toward continuation of its broader growth path once this reset stabilizes.

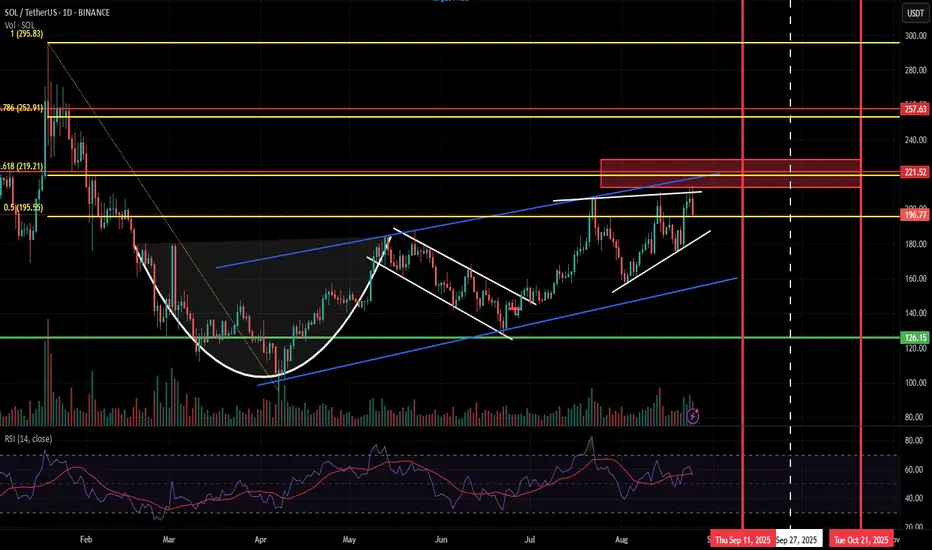
SOL big picture: All Time High again in this cycle?
Solana has being showing strength in its price action recently compared to top 10 altcoins (in MarketCap) within the past few days, yet failing to break the strong resistance within 200 and 220. Bears have consistently defended this region while maintaining the price below the 0.618 Fibonacci level of the mid January - April price drawback.
Since then, the price has maintained an uptrend where the cup-and-handle pattern strongly playing out. But the the uptrend was restricted within a parallel channel (blue) and yet to be broken, which is a breakout to be played for SOL to break the 210 barrier. Price has been moving within a bearish wedge (white) during the months July and August, and still failed to confirm a positive breakout even after the price surge due to Jerome Powell's hint on rate cuts at annual economic policy symposium in Jackson Hole, Wyoming.
The current Bull Cycle is shortly coming to an end. Based on historical behavior, BTC reaches its ATH within 510 to 550 days from its recent halving which falls between mid-September to October end. BTC is supposed to go for an ATH within this region and September rate cuts can be a good fuel to reach this target. Mostly we will be having a short altcoin season for this cycle with a probability of an extension until year end (November or early December).
Statutory 240-day deadline for VanEck and Franklin SOL ETF applications will conclude by October 2025. As reported by Coinpaper, the final deadline has been set to October 16, 2025 for five Solana ETF applications. (source: coinpaper). These positive news can align with the last phase of the Crypto Cycleand trigger new ATH for SOL. Price will take a downturn if Bulls progressively struggle to break the parallel channel resistance by this time, marking the end of the current cycle.
So, a high probability exist for SOL to reach new ATHs with caution on the overall market sentiment within the coming 2 to 4 months. As the time of writing, SOL is at 198.14 , plunged from a local high of 213.6.
SOL 19.09.25SOL came into the last supply there is on the chart, i'm looking for a short if it manages to confirm a distribution. A accumulation into demand to create that 3rd tap would also be nice.

$SOLANA 250+ or bearish trend to 225/200With the recent solana pump, major profits have been taking place.
However, SOL stopped out at 249. Just under the Psychological level of 250.
On this chart we can see the following:
- Supply & Demand
- Anchored Volume
- Pattern: BF / BC /SR
- Two 4 hour FVG's below price, with HTF GP on the second FVG.
- One swing high & swing low
- OBV tool in place forming a bearish channel
- Psychological levels of 250, 225, 200
With these in place, we can see solana is looking pretty bearish now.
What comes up, must come down.
Solana is making a retest on the demand zone, which is also the resistance and golden pocket.
If price wicks and successfully rejects. We will definitely see 225.
A long with the Volume Anchor acting as a magnet for price to come back down as there has not yet been a retest.
But if it closes above the resistance, there is a greater chance of it breaking above the demand zone.
We will begin looking for shorting opportunities once solana fails to break above.
We will begin looking for long opportunities if solana succeeds in it's break above.
Right now, keep your eyes peeled.
We have movement incoming.

SOLUSDT → Correction amid a strong bullish trend BINANCE:SOLUSDT , after updating its next high, formed a false breakout of local resistance and returned to the trading range as part of a correction. What to expect from altcoin?
The main driver of the crypto market, Bitcoin, is consolidating above 115K and facing fairly strong resistance at 117400. Earlier, the price completed a downward correction. The market is dominated by a positive technical and fundamental background.
SOL looks stronger than Bitcoin and is testing new highs...
The price of SOLANA is forming a false breakout of resistance and is entering a correction phase amid a bullish trend. As part of the correction, the price may test the local imbalance zone and the key liquidity level of 242.5.
Resistance levels: 244, 249.2, 253.5
Support levels: 242.5, 239, 231.5
Technically, the price may form a false breakdown of the nearest zone of interest at 242.5, and if the bulls manage to keep the price above the resistance zone of 242.5-244.0 after this maneuver, the coin may return to an upward movement. However, if this does not happen, I would wait for a retest of the 239.0 zone, where the trend support line is located. The medium- and long-term outlook for SOL is positive, and the price is highly likely to test the ATH 295.0.
Best regards, R. Linda!

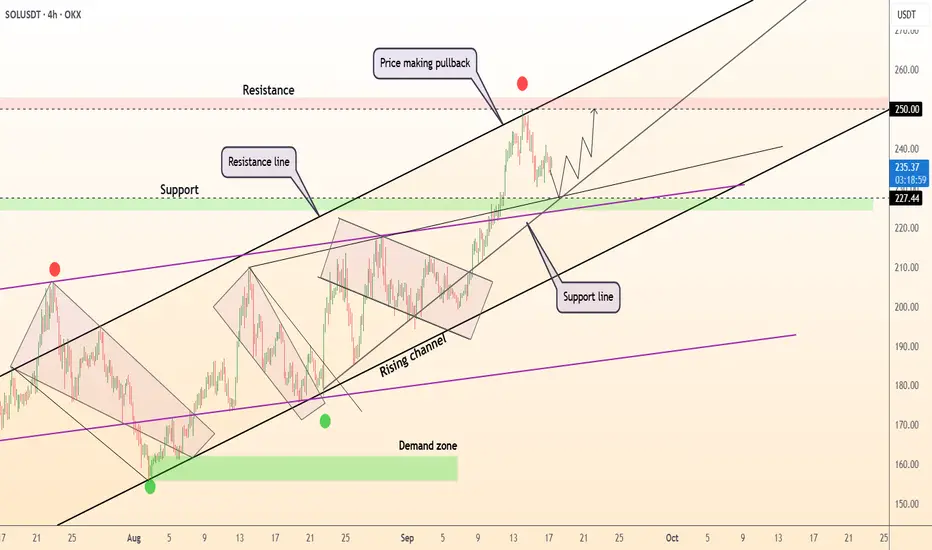
DeGRAM |SOLUSD will test the support level📊 Technical Analysis
● SOL/USD is trading inside a rising channel, with price pulling back toward 227 support after rejecting 250 resistance.
● Structure shows continuation potential, with higher lows along the support line keeping momentum intact and targeting a retest of 250 if buyers hold.
💡 Fundamental Analysis
● Solana’s ecosystem strength is supported by growing NFT volumes and DeFi activity, while recent whale inflows highlight institutional interest in altcoins.
✨ Summary
Bullish above 227; targets 240 → 250. Invalidation on a close below 227.
-------------------
Share your opinion in the comments and support the idea with like. Thanks for your support!
SOL ShortsPrice rejected cleanly from the weekly rejection block at 249–252 and is now failing to hold minor intraday structure. The selloff broke lower, and every retest into 246 → 249 is now acting as supply.
The next liquidity pool sits at 242.6, and if that level gives way, the clean draw is the imbalance resting at 230.1. The market already showed willingness to reject the weekly block, so until that zone is reclaimed, bias remains lower toward these liquidity levels.
Why this happens:
• WRB rejection capped the rally.
• Intraday mitigation blocks forming lower highs.
• Liquidity magnets below at 242.6
The chart is showing displacement + mitigation → continuation lower.

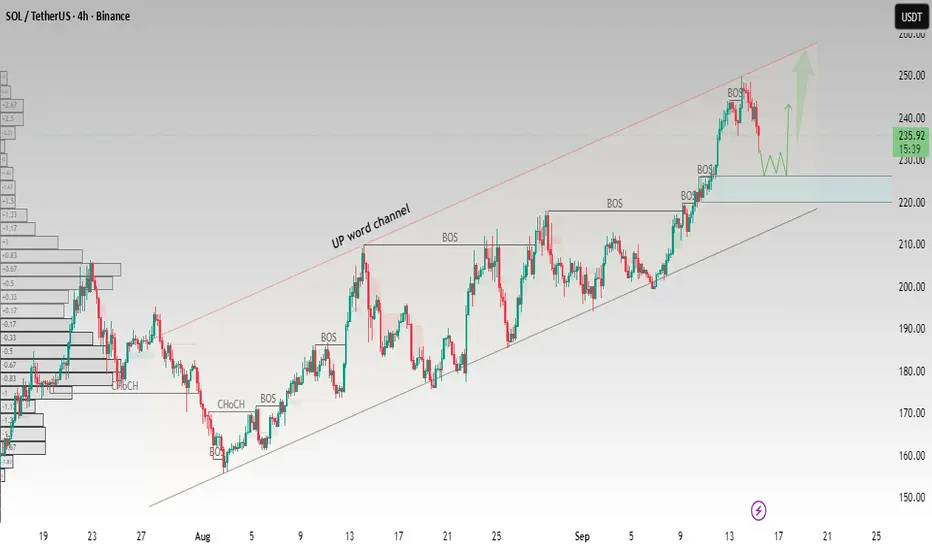
SOL/USDT – Testing Support Within Upward ChannelSOL is moving inside a clear upward channel on the 4H timeframe. After multiple Breaks of Structure (BOS), the price is now pulling back from the upper channel resistance.
Key zone to watch: $225 – $230 support area. If buyers defend this level, SOL could bounce and retest the $245 – $250 zone at the channel top.
Price holding below $225 may signal deeper retracement toward the lower boundary of the channel.
This setup highlights how structure, BOS levels, and channel dynamics can guide potential trade decisions.
Educational purpose only. Not financial advice
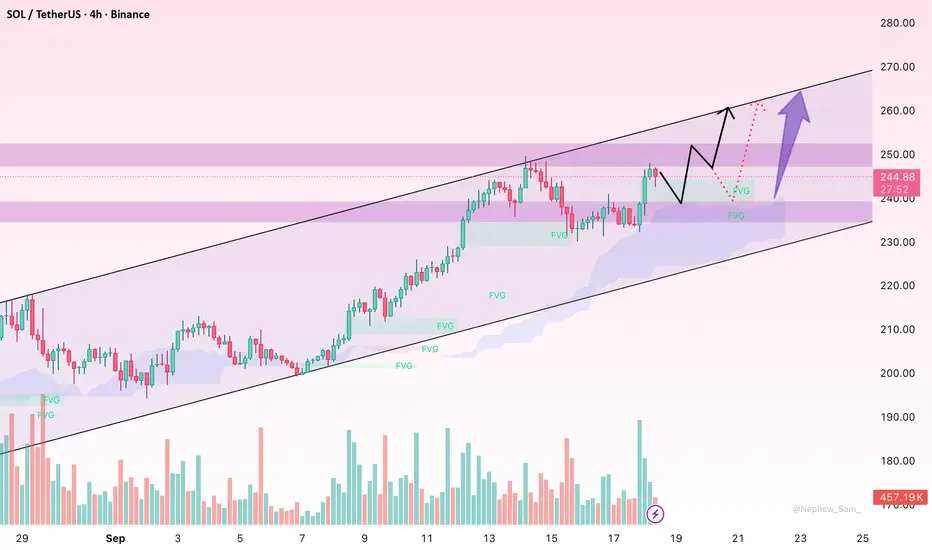
SOL/USDT: Keep Rising or Time for a Correction?Hello everyone, recently SOL/USDT has seen a strong upward movement, and now it’s at a quite sensitive price zone. The big question now is: will the uptrend continue, or is the market due for a correction before pushing further?
On the chart, SOL is still holding above the Ichimoku cloud, a sign that the bullish trend is intact. The Fair Value Gaps (FVG) formed during the rise could act as "stepping stones" of support, providing opportunities for price to bounce when it comes down to retest. The volume spike on September 17th also shows real market participation, indicating that this is not just a “fake breakout.” The 240 USD zone is currently an important support level— as long as the price stays above here, the chances of reaching 250 USD, or even 260 USD, are quite high.
Recent news also supports SOL. The crypto market, in general, is benefiting from new funds pouring in from large institutions, and Solana is no exception. The Solana development team also released updates that improve speed and reduce transaction fees, which certainly strengthens confidence in the project. Additionally, the Fed maintaining stable monetary policy creates a favorable environment for risk assets, including altcoins.
I still lean towards a continuation of the uptrend, as long as SOL doesn’t break below 240 USD. If it holds, the next target is 250 USD, and potentially even 260 USD. However, traders should also prepare for a potential correction to avoid being caught off guard.
What about you? Do you think SOL will hit 260 USD soon, or does the market need a breather before going higher? Share your views!
Solbat pattern on the SOL/USDT 4H and 1D charts appears solid , based on the visible trendlines and labeled points (A, B, C, D) connecting the swings. The structure aligns with a classic bearish bat harmonic pattern: it starts with an initial downmove (X to A, potentially from the higher swing around 260+ implied by the chart scale), retraces upward to B (around the 0.382-0.50 Fib of XA, near the 220-231 zone based on the horizontal lines), extends to C (0.886-0.886 Fib retrace of AB, fitting the lower color lines around 210-220), and projects to D (the PRZ at 0.886 Fib extension of XA, The ascending trendlines from X-A and B-C, plus the converging resistance (color lines), give it a clean, non-overlapping look without deviation. On the 1D timeframe, it scales up well, reinforcing the pattern across higher timeframes for confluence. Minor nitpick: The volume labels (e.g., 0.69, 0.79) and some wicks might slightly offset exact Fib precision, but it's visually coherent and not over-drawn.Yes, this setup looks valid for a short position if confirmed at the PRZ (D point). Recent analyses confirm SOL forming a bearish bat around these levels in mid-September 2025, with the pattern signaling exhaustion after the rally from 220 lows. Current price (248 USDT as of Sept 18) is hovering just below the C-D leg, and the overall structure suggests reversal potential at D, especially with neutral-to-bearish oscillators (RSI ~55-60, MACD flattening) and resistance clustering at 250-255. Key invalidation would be a clean break above 260 but if it respects the bat's 88.6% extension, target downside to 230 (38.2% Fib of XD), 220 (50%), and 200 (61.8%)—aligning with broader support zones.
Risk: High volatility in perps, so use tight stops.
For DCA entries into the short as price touches 253 (ideal PRZ rejection zone), focus on scaling in on pullbacks or confirmations within the leg up from current levels.
Aim for 3-4 entries to average ~
248-252 average entry,
with 25-30% position size per layer. Best spots:Entry 1: 250 USDT (First resistance test; —
enter 25% if rejection candle forms, e.g., shooting star or doji with volume spike).
Entry 2: -253-257
USDT (Core PRZ; add 30% on bearish divergence or breakdown below 251 hourly—watch for failure at the converging trendlines).
Stop loss, Breakout and close above 259
Tp
246
243
238
232

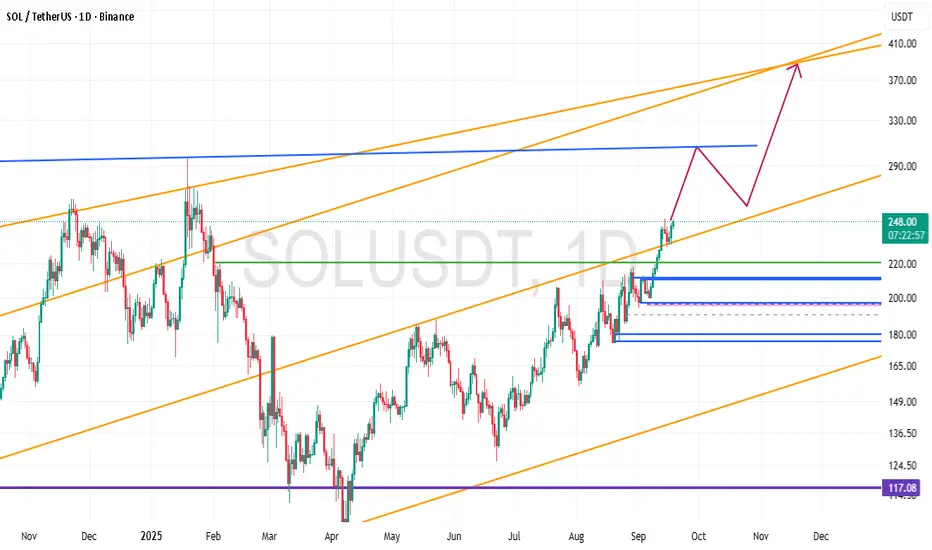
Technical Analysis Report: Solana (SOL/USDT)Current Price: ~$248
Solana is currently trading within a bullish ascending channel on the daily timeframe. The overall mid-term trend remains positive, supported by higher highs and higher lows.
🔑 Key Levels
Support Zones:
$220 → psychological support and trendline retest
$200 → major structural support (critical level)
$180 → strong support in case of a deeper correction
Resistance Zones:
$290 → short-term resistance and potential rejection area
$370 → upper boundary of the channel and main bullish target
📈 Possible Scenario
Price may extend its rally toward $290.
A corrective pullback to the $250–260 range could follow.
If momentum holds, the next bullish target lies around $370 at the channel top.
⚠️ Risk Notes
As long as SOL holds above $200, the bullish trend remains intact.
Losing the $200 support could trigger a decline toward $180.
Risk management and stop-loss placement are essential due to possible short-term volatility.
📌 Summary
Solana maintains a bullish outlook while trading inside its ascending channel. The medium-term upside targets stand at $290 and $370, with key supports at $220–200. Short-term corrections are possible, but the overall structure favors further upside as long as $200 holds.