Solana: Targeting 240–245 USDT After BreakoutHello everyone,
On the H4 chart, SOL is maintaining a strong uptrend, continuously breaking resistance and staying above key support zones. The recent break above 234 USDT shows dominant buying pressure, while price action holding above the Ichimoku cloud reinforces the potential to reach 240–245 USDT in the short term.
Trading volume is gradually increasing, and SOL not breaking prior lows adds further confidence to the trend. On the downside, the 220–225 USDT area serves as a key support, with lower FVG zones providing additional cushioning in case of corrections or consolidation.
From a news perspective, Solana benefits from growing interest in DeFi and network expansion. The ecosystem is attracting significant capital through technological solutions, NFTs, and institutional participation, providing further support to the ongoing uptrend.
Do you think SOL will reach 245 USDT soon? Share your thoughts in the comments!
USDTSOL.P trade ideas

$SOL breakoutbeen waiting for quite sometime for this to break.
taking a good size low lev long on todays close.
invalidation if we get a daily close below the tl, really good r/r to ignore
gl

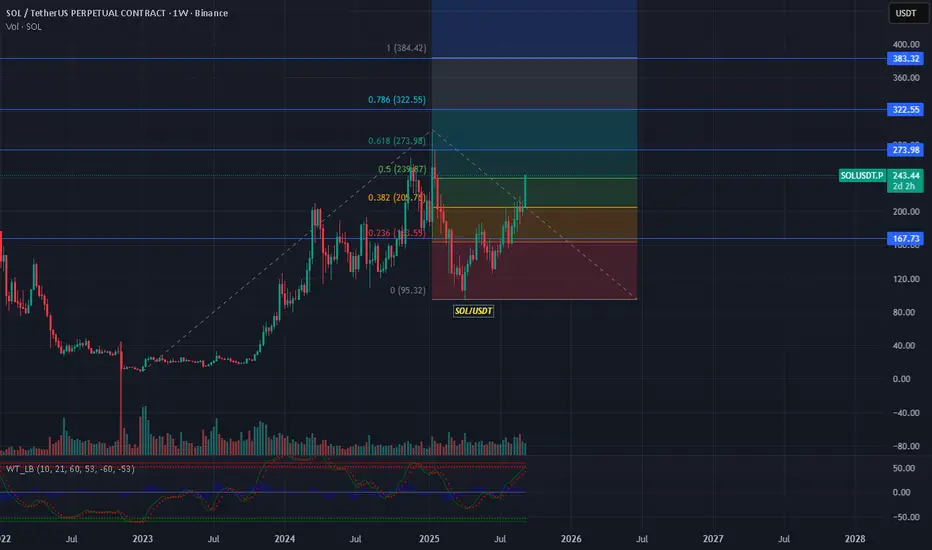
SOL/USDT Weekly Chart Analysis## 📊 Chart Overview
* **Pair:** SOL/USDT (Perpetual Futures, Binance)
* **Current Price:** \$243.44 (+18.01%)
* **Timeframe:** 1W (long-term trend)
* **Volume:** 147.8M (rising, signaling strong participation)
* **Indicators:** Fibonacci retracement, WaveTrend oscillator
---
## 🔑 Fibonacci Levels (swing low \$95.32 → swing high \$384.42)
* **0.236 Fib:** \$163.55 → strong support, successfully defended.
* **0.382 Fib:** \$205.87 → breakout level, now acting as support.
* **0.5 Fib:** \$239.87 → current zone, SOL is testing this level.
* **0.618 Fib:** \$273.98 → next resistance if \$240 holds.
* **0.786 Fib:** \$322.55 → heavy resistance zone.
* **1.0 Fib:** \$384.42 → previous high, potential long-term target.
---
## 📈 Price Action
* SOL has **broken above the \$205 level** and is now consolidating near **\$240**.
* The weekly breakout candle suggests **renewed bullish momentum**.
* Higher lows since the \$95 bottom show a **reversal structure** forming.
---
## 📉 Indicators
* **WaveTrend Oscillator (WT):**
* Currently moving upward, showing **bullish momentum**.
* Entering overbought territory, so short-term corrections are possible.
* **Volume:**
* A surge in weekly volume confirms **strong buying interest**.
---
## 🧭 Outlook
* **Bullish Case:**
* Sustained move above **\$240** opens targets at **\$274 → \$322 → \$384**.
* If momentum extends in a bull cycle, the Fibonacci extension could take SOL toward **\$500–\$560**.
* **Bearish Case:**
* If rejected at \$240–\$245 zone, price may retest **\$205**.
* Failure to hold \$205 could drag it back to **\$167** support.
---
## ⚠️ Risk Note
* SOL is at a **critical mid-Fib level (0.5 zone)**, which often acts as a **decision point**.
* Weekly close above \$240 will confirm strength, but if it fails, downside correction risk rises.
* Always track Bitcoin’s movement since SOL is highly correlated.
---
✅ **Summary:**
SOL is in a **bullish breakout phase**, reclaiming the \$240 zone. Holding above this level can accelerate a rally toward **\$274–\$322**, while failure may bring a pullback to **\$205–\$167**.
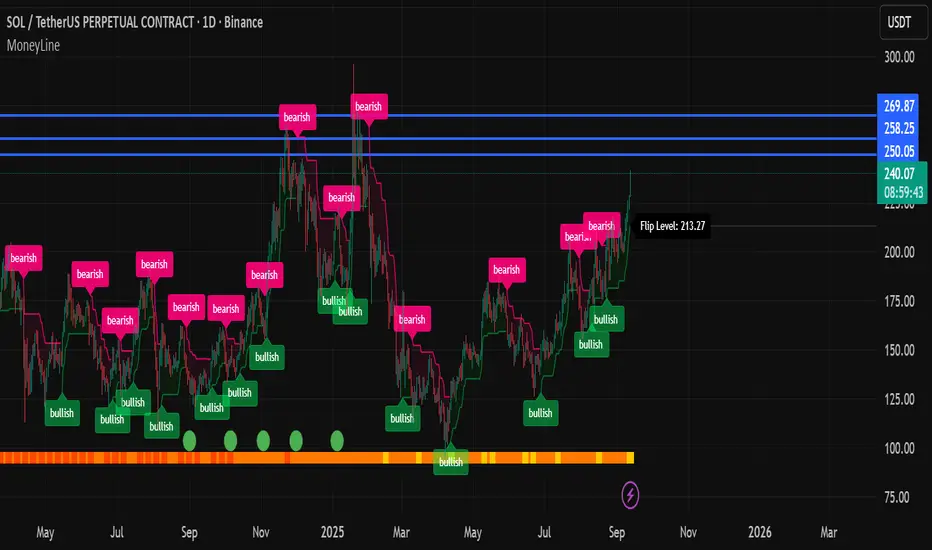
SOL 1D – Breakout in Motion, Next Stop $263.9 LiquiditySolana has confirmed a breakout above the $210–220 retest zone, continuing its strong bullish momentum while holding trendline support and both EMAs.
Upside:
The next major liquidity sits at $263.91, with potential for continuation toward $280–300 if broken and retested.
Downside:
If price rejects $263, a retest of the $210–220 zone would be key for continuation.
Losing that level risks a retrace into the Fib base between $176–164, with $148 as the deeper support.
Stoch RSI remains overbought, but momentum stays strong while structure and EMAs remain bullish.
📊 Key focus: Can SOL extend into the $263 liquidity pool and hold a breakout-retest structure for higher targets?

$SOL has hit all 3 targets on the HOURLY, $212-$224 next?CRYPTOCAP:SOL has just hit its all 3 targets on the hourly chart and currently printing a bearish engulfing candle, so a reversal here is pretty likely.
Also falling volumes on this current last 5/5 Elliot's Wave so not a good time to be starting longs, some profits has to be taken as far as I'm concerned, you always do you👽💙

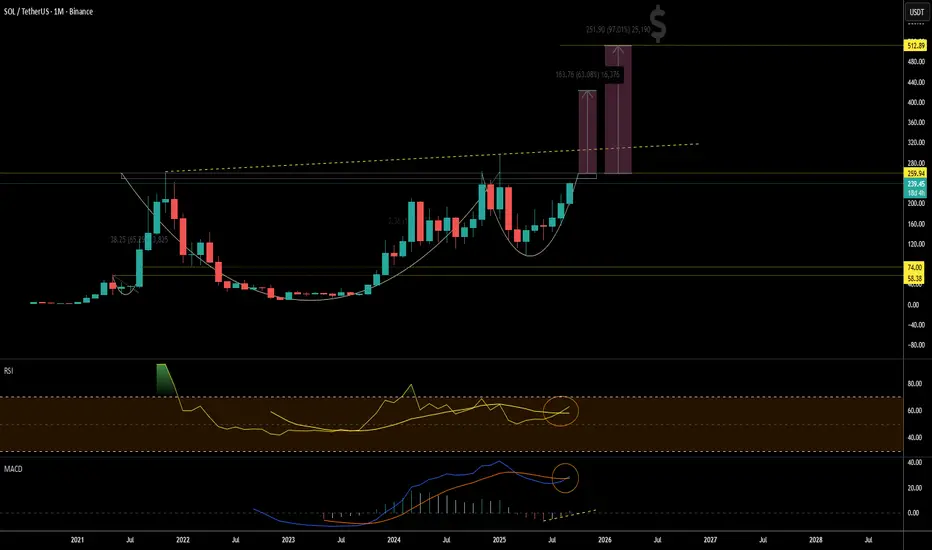
MONTHLY $SOL CHARTBeautiful chart with strength accompanied by several indicators that act to drive the value of this crypto asset above the current price. "Technical analysis"
The way the market grows, I see this target close to reaching.
SOL BREAKS OUT We can easily see a bullish breakout from SOL/USDT , this is one of the most basic price action where in the coins breakout and retest the upper trendline . Now in the current scenario we are targeting the previous resistance clusters and also bitcoin seems pretty bullish here.

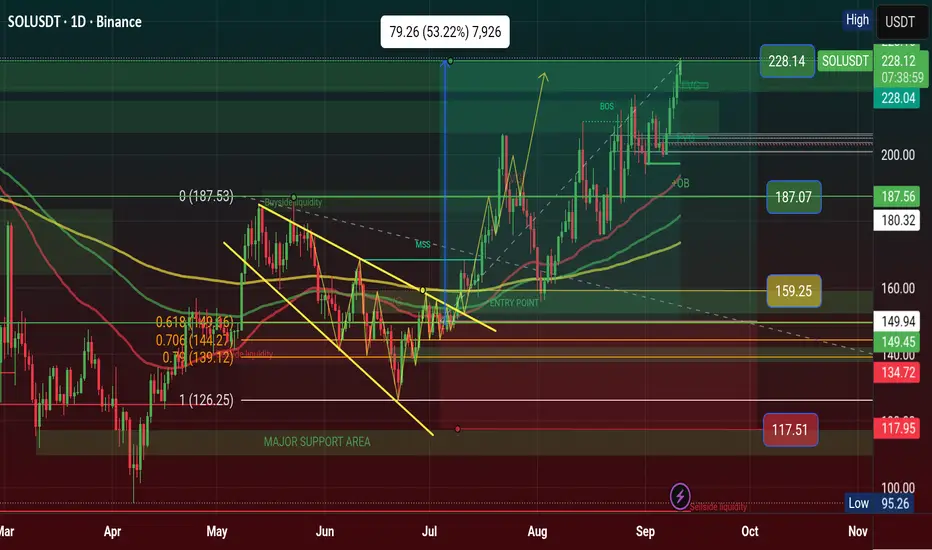
SOLANA (SOL/USDT) – TP: 170 - 252 & 295SOLANA (SOL/USDT) is currently trading at $130.17 after rebounding from a well-defined sell-side liquidity zone between $98 and $131. The recent weekly candle shows a strong bullish recovery (+22.93%), suggesting that liquidity has been swept and buyers are stepping in. This level has historically served as a key accumulation zone, and the bounce aligns with oversold conditions on the StochRSI, which is now curling upward — indicating growing bullish momentum. If price sustains above the $125–131 level, the next immediate upside target lies between $170 and $188, where prior supply and consolidation occurred. A confirmed breakout above this range opens the path toward a higher resistance zone between $254 and $295 — a region that aligns with unfilled inefficiencies and previous price distribution.
The ideal swing trade approach would be to enter on a pullback within the $110–125 range, set a stop loss below $98, and scale out at the $170 and $254 levels. This setup offers a favorable risk-to-reward ratio of approximately 1:3.5.
Trade Strategy Suggestion (Swing or Positional):
Entry: Ladder between $115–$125 on retrace
SL: $105–110 (below wick low)
TP1: $170–188
TP2: $254–295
Scaling Out: 50% at TG1, rest at TG2 or trail stops above $200
With macro tailwinds like renewed interest in Solana’s DeFi and meme coin ecosystems, institutional flow returning, and technical confirmation across multiple timeframes, this could be a high-conviction mid-term play for swing traders and positional investors alike.
🔮 Narrative & Fundamentals:
ETH L2 congestion → SOL gets transactional inflows
SOL’s DeFi, NFT, and memecoin activity resurging (e.g., SEED_WANDERIN_JIMZIP900:WIF , SEED_DONKEYDAN_MARKET_CAP:BONK ecosystem)
Institutional flow picking up (Grayscale SOL trust rallying)
SOL remains one of the fastest L1s with growing developer traction

$SOL hits TRIANGLE target perfectly.. what's next?CRYPTOCAP:SOL on 4-HOUR chart has perfectly hit its main Triangle target of $241 even after having to overcome a bearish Butterfly harmonic pattern.
RSI getting overheated a bit here after hitting 80, and I call these Power Moves into resistance. There were flashing some bearish divergences on OBV and RSI recently so now after hitting the target I would not long from here. Next two-three candle sequence will be decisive after printing an indecision candle.
Bearish engulfing would be a signal to leave long altogether let's see 💙👽

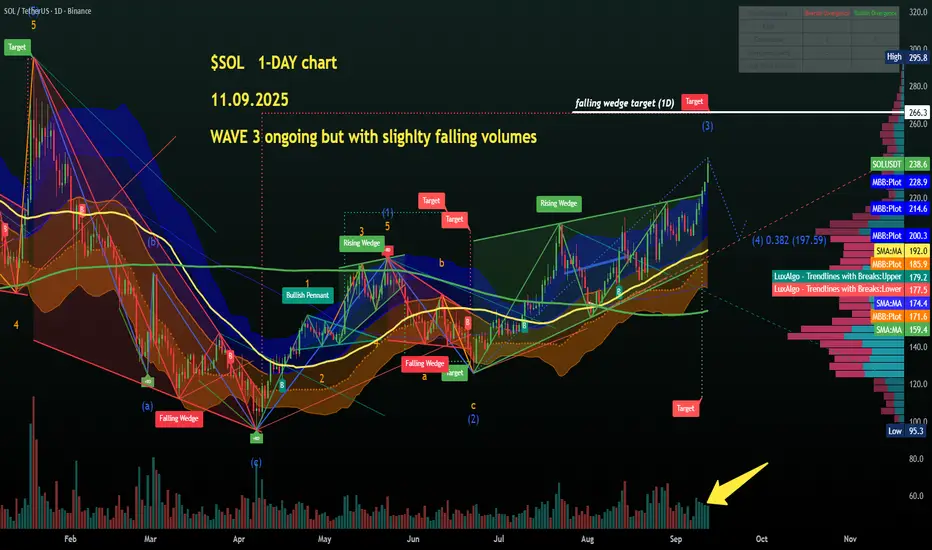
$SOL on 1-DAY chart... has just invalidated a nasty RISING WEDGECRYPTOCAP:SOL on 1-DAY chart has just invalidated that nasty nasty rising wedge pattern that was building from mid-June and impressively failed yestarday, and that's pretty bullish.
Wave 3 in terms of Elliot's Wave count the volumes have been slighly decreasing each day, so imo too late to panic buy but still, it could keep rising as Wave3s often overextend beyond expectations.
Strong chart, green flag for Solana memecoin hunting season, I'm researching the best looking ones currently, will post later on some of them👽💙
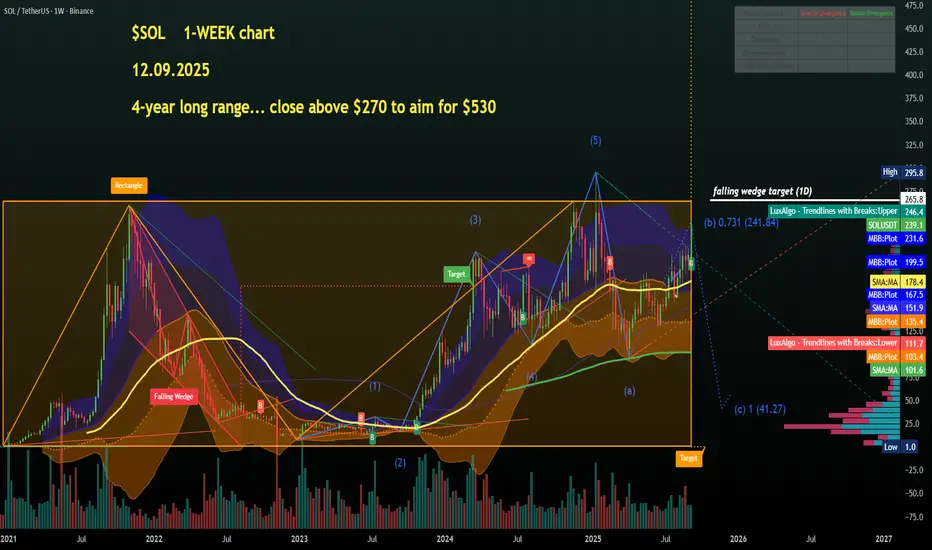
$SOL 1-WEEK chart: 4-year old range... break $270 to aim at $525CRYPTOCAP:SOL top down analysis incoming in my next couple of posts starting from a weekly view.
So, first of all a huge range since the beginning of 2021, let's call that a rectangle pattern giving us a clear long-term breakout level on weekly candle close above $265-$275, the higher the better.
RSI upcurved nicely at 66 so plenty of room to grow in Q4.
From there we would have a target of around $525, not unrealistic. Daily view next💙👽☝️
Solana runIn my opinion these three levels for Solana will be very important over the next 24 hours. Hopefully we don't lose momentum over the weekend but it is to be expected. However should we not lose Momentum and breakthrough these levels of resistance anything is possible.
DeGRAM | SOLUSD broke the key resistance level📊 Technical Analysis
● SOL/USD broke above the 224 resistance, confirming strong bullish momentum within the rising channel and sustaining higher lows along support.
● Price action is targeting the 240 resistance zone, with potential extension toward 260 if buyers maintain control.
💡 Fundamental Analysis
● Solana adoption gains traction as its DeFi and NFT ecosystems see fresh inflows, while recent institutional endorsements reinforce long-term demand.
✨ Summary
Bullish above 224; targets 240 → 260. Invalidation on a close below 224.
-------------------
Share your opinion in the comments and support the idea with a like. Thanks for your support!

SOLUSDT Rallies: Heading Towards New HighsSOL is in a strong uptrend, with the support level at 225.00 USD having been tested and held. The price is currently aiming for 250.00 USD, with technical indicators signaling the continuation of this trend. The clear upward trendline and institutional inflows are strengthening SOL's bullish momentum.
Forecast:
If SOL maintains above the 225.00 USD support, there is a high probability it will continue to rise towards 250.00 USD.
Buy SOL when the price retraces to the 225.00 USD support zone.
Set a stop loss below 220.00 USD to protect your capital.
US Unemployment Claims data came in higher than expected, weakening the USD, which provides favorable conditions for SOL to increase in value. Additionally, Forward Industries completed a 1.65 billion USD fundraising deal to build the Solana Treasury, with participation from Galaxy Digital, Jump Crypto, and Multicoin Capital, providing a strong boost for the Solana ecosystem.

DeGRAM | SOLUSD keeps bullish momentum📊 Technical Analysis
● SOL/USD broke above the 220 level, confirming bullish momentum within the rising channel, with price sustaining higher lows along the support line.
● The structure points toward continuation, eyeing 230 first and then 240 as the next resistance zone if momentum persists.
💡 Fundamental Analysis
● Solana’s ecosystem continues to expand, with growing institutional participation and sustained developer activity driving confidence and demand in its blockchain.
✨ Summary
Bullish above 218; targets 230 → 240. Invalidation on a close below 218.
-------------------
Share your opinion in the comments and support the idea with a like. Thanks for your support!

SOLUSDT Drops At Key Resistance ZoneHello there,
SOLUSDT looks bearish at the H1, and the price has the potential to drop to the 204.57 area with a directional bias of 200. Additionally, a change in trend direction to bearish is also indicated by the RSI.
Happy Trading
K.
Not trading advice.

SOL/USDT – The Powerful Wave Isn’t Over YetSolana is showcasing its strength by holding firmly above the 200 USDT psychological level while also being backed by massive inflows, with open interest hitting record highs. This clearly shows strong market confidence in SOL’s breakout potential.
On the 12H chart, the bullish structure remains crystal clear: price is clinging to the trendline, holding above both the EMA34 and EMA89, and bouncing solidly from support zones. The next key destination the market is eyeing is 223 USDT – a crucial resistance. If broken, Solana could easily open the path to even higher levels.
In short, both news and technicals are in sync: SOL/USDT’s bullish momentum is far from over – in fact, it’s gearing up for an even more impressive breakout.

SOLUSDTThis is a bullish setup for BINANCE:SOLUSDT , but the $230 level is crucial for potential reactions. My strategy is to stay bullish and wait for the upcoming US CPI news, then decide whether to buy or sell CRYPTOCAP:SOL based on the news.
⚠️Ensuring your position size aligns with your risk tolerance.


Buy Solana and Change Your Life Solana on track to make the most bullish move ever right now . Minimum $600 . I mean minimum .

SOLUSDT NEW TIMES COMING? Thank you for reading this update.
Solona looks to have a new incoming volume
Will this bring this volume Solana to $100 with time?
This volume depends on day trade and has no guarantees for the long term.

SOL: Long Move Up"
On August 22, I entered a long at $191 on the 1-hour chart, using 20x leverage. The move turned out to be extended: price climbed to $224, four profit-taking levels were reached, but I kept the position open further. A difference of more than $30 per coin delivered a solid result.
The key here was not guessing but consistency. The indicator highlighted the important levels in advance, and I followed the plan step by step. This eliminated impulsive decisions and allowed me to stay calm throughout the entire trade.
When trading is built on structure, even long moves become manageable. The plan makes it clear where to take profit, where to hold, and where to keep a cool head. With high leverage, this becomes critical: risk stays under control, and emotions don’t interfere with decision-making.
The market will always remain unpredictable, but a disciplined approach turns it into a field of opportunities, where results depend not on luck but on the ability to work systematically."

$SOL Finally hit $228 and My Prediction is Done CRYPTOCAP:SOL Finally hit $228 and My Prediction is Done, Next week if Retest and Breakout it will be $333 price in 2026 of Q1, Solana will Archived the price when we are HOLD.
From News, Solana Climbs to $225 as Analysts Predict Strong Year-End 2025 - 2026 Prediction price will hit $333 1st Quarter.
Solana surged to a seven-month high this week, touching nearly $225 as demand from institutions and speculation around ETFS lifted momentum. The token is up 25% in the past month, marking the best performance among the top 10 crypto assets.
Digital asset treasuries have been steadily accumulating Solana throughout 2025. Firms such as Upexi and DeFi Development Corp. each disclosed holdings of over $400 million in the token since January. Forward Industries added fuel to the trend earlier this week, announcing a $1.65 billion private investment in public equity to establish a Solana treasury. The plan, spearheaded by Multicoin Capital's Kyle Samani, could create the largest publicly traded SOL treasury if executed.
ETF applications tied to Solana are also awaiting SEC decisions. Issuers including Bitwise, Canary Funds, and 21Shares have filed proposals, while analysts expect approvals on CRYPTOCAP:SOL , CRYPTOCAP:XRP , and Dogecoin ETFS
sometime in 2025. Market research platforms have taken note of the shifting sentiment. Prediction markets on Myriad now give Solana a 57% chance of reaching a new all-time high this year, up from 23% just weeks ago.
Despite trading about 24% below its January peak of $293.31, Solana's rally has made it one of the strongest performers among major assets. Hougan emphasized that the relative size of Solana compared to Bitcoin and Ethereum means even modest ETF inflows could have an outsized effect on price.
He estimated that Forward's planned treasury allocation, if fully executed, would be equivalent to a $33 billion purchase in Bitcoin terms. With Solana at $221 at press time, investors are closely monitoring whether ETF approvals and treasury expansion will drive the next leg upward.
#Write2Earn #BinanceSquareFamily #Binance #SOL #SUBROOFFICIAL
Disclaimer: This article is for informational purposes only and does not constitute financial advice. Always conduct your own research before making any investment decisions. Digital asset prices are subject to high market risk and price volatility. The value of your investment may go down or up, and you may not get back the amount invested. You are solely responsible for your investment decisions and Binance is not available for any losses you may incur. Past performance is not a reliable predictor of future performance. You should only invest in products you are familiar with and where you understand the risks. You should carefully consider your investment experience, financial situation, investment objectives and risk tolerance and consult an independent financial adviser prior to making any investment.